Influence of non-covalent preorganization on supramolecular effective molarities†
Received
3rd February 2015
, Accepted 20th March 2015
First published on 30th March 2015
Abstract
A family of closely related zinc porphyrin–pyridine complexes were used to examine the influence of linker preorganization on supramolecular effective molarities for formation of intramolecular H-bonds. Each pyridine ligand was equipped with a side-chain containing two H-bond acceptors, one on the end of the chain (terminal) and one in the middle of the chain (linker). These H-bond acceptors make intramolecular interactions with phenol H-bond donors on the porphyrin periphery. Two different H-bonding acceptors were used as linker groups in order to construct frameworks with significantly different degrees of preorganization: ester linkers populate the H-bonded state 60–70% of the time, whereas amide linkers populate the H-bonded state 90–100% of the time. Thus the amide linkers provide a significantly more preorganised ligand framework than the ester linkers. Effective molarities (EM) for intramolecular H-bonds between the terminal H-bond acceptor groups on the ligands (esters and amides) and the porphyrin phenol groups were quantified using 32 chemical double mutant cycles. The values of EM for interactions with the terminal H-bond acceptors are independent of the nature of the linker H-bond acceptor (weakly bonded ester or strongly bonded amide), which indicates that preorganization of the linker has no effect on chelate cooperativity in these systems.
Introduction
Multivalency or chelate cooperativity is a key strategy in designing ligands with high specificity and affinity.1–4 This principle has been applied in the self-assembly of functional nanosystems, material science and new toxin therapies.5–7 However, a quantitative understanding of the thermodynamic contributions of individual interactions within a multivalent system is still problematic. One important question that needs to be addressed is will the strength of any individual functional group interaction depend on the overall stability of the multivalent complex in which it is found? Whether the free energy contribution of an intramolecular interaction changes significantly between a weakly bound and a strongly bound complex influences how transferrable interactions are from one system to another, and thus the rational design of supramolecular systems. In order to answer this question, we have designed a series of zinc porphyrin–pyridine complexes to investigate the relationship between ligand preorganization in a supramolecular complex and chelate cooperativity. By comparing the free energy contributions of the same H-bond to the overall stabilities of different complexes, we show that there are no structural tightening effects and that the strength of an intramolecular interaction is independent of ligand preorganization.8
Approach
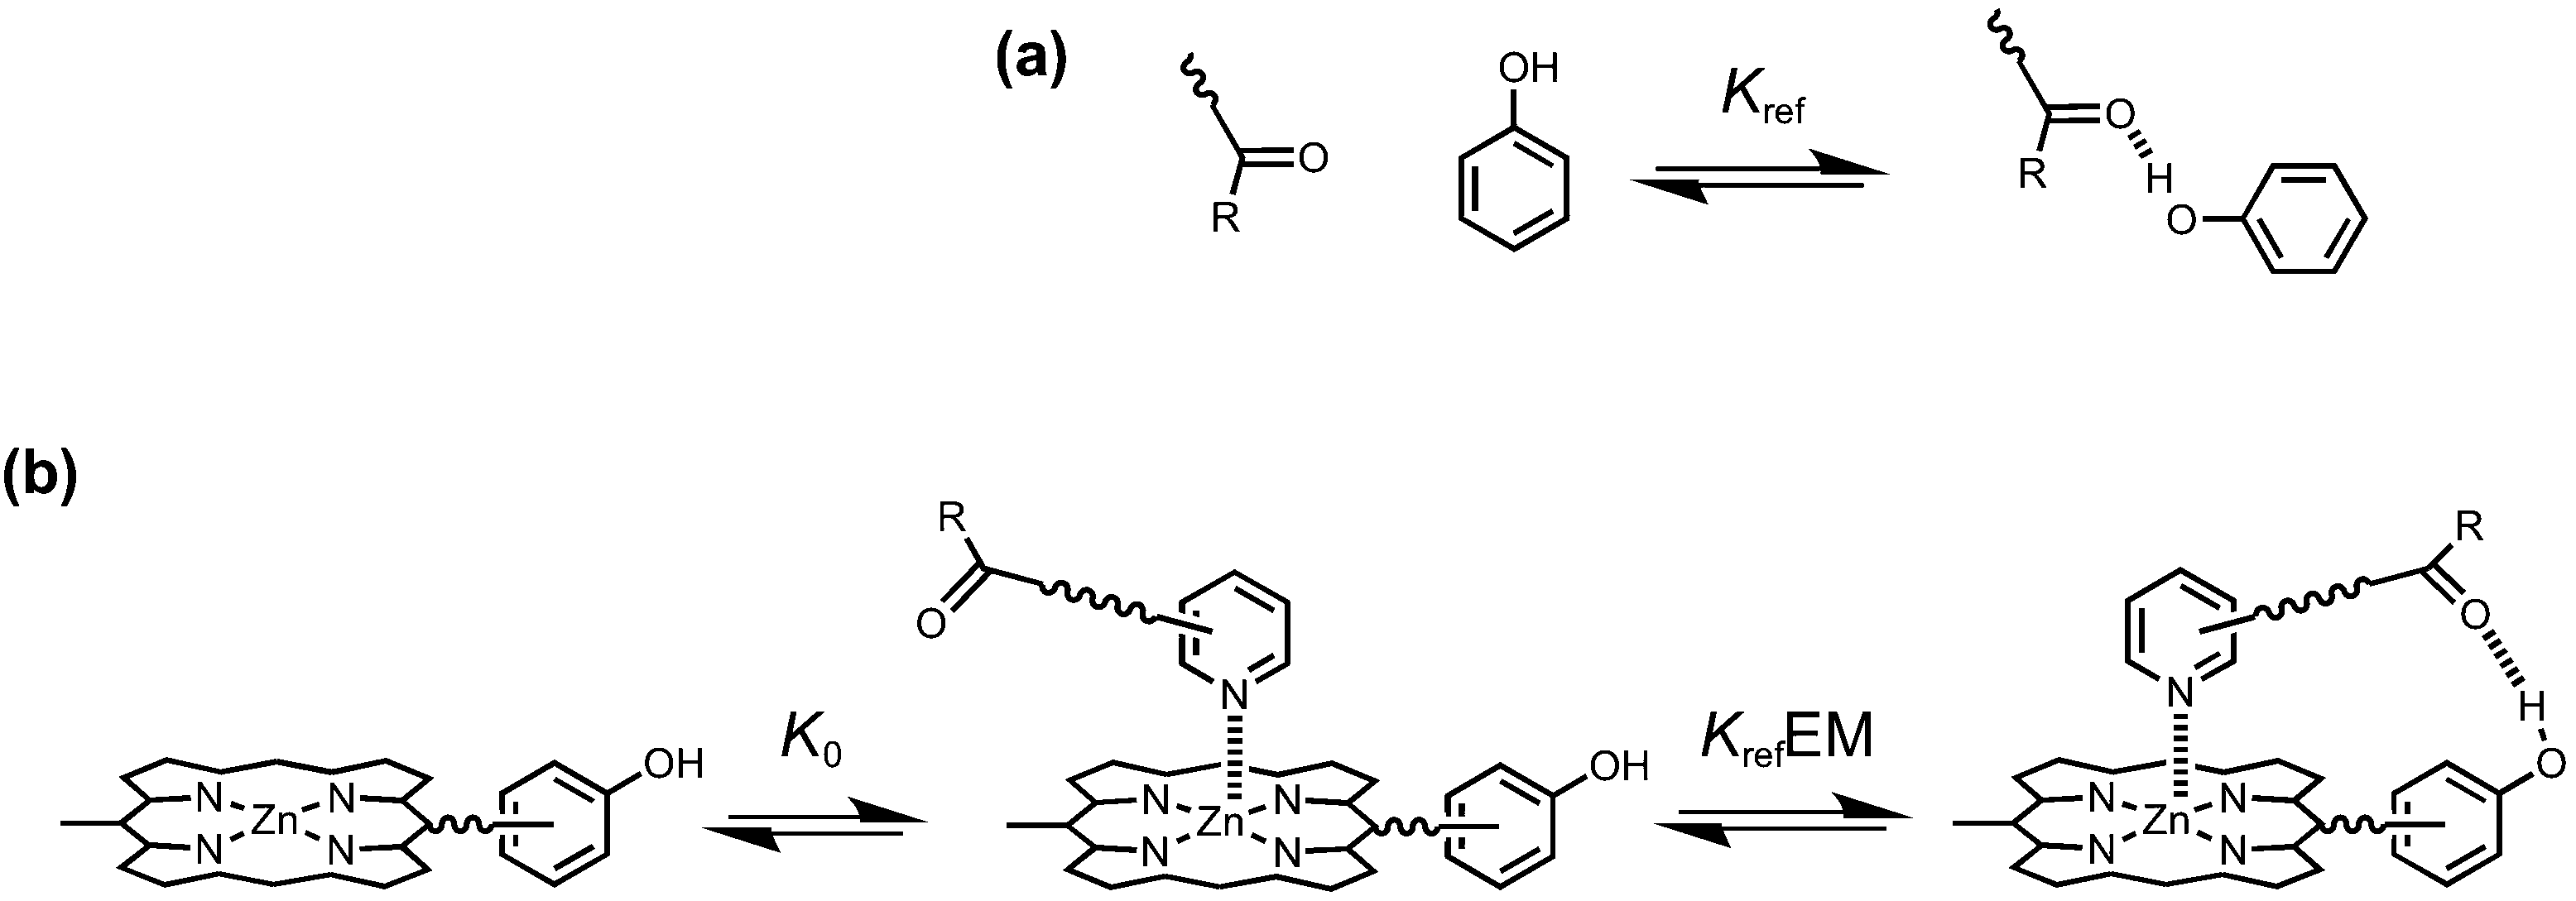
Cooperativity between multiple interaction sites renders the overall stability of a supramolecular system different from the sum of the individual interactions in isolation.9,10 The key parameter used for quantifying chelate cooperativity is effective molarity (EM). EM defines the concentration at which intermolecular interactions, which result in oligomerization, start to compete with intramolecular interactions.11–13Fig. 1 illustrates how EM values can be measured for the formation of intramolecular H-bonds in synthetic zinc porphyrin–pyridine complexes. We consider that the formation of a zinc porphyrin–pyridine complex, as shown in Fig. 1b, goes through two steps: first formation of a zinc–pyridine coordination bond with association constant K0, and then formation of an intramolecular H-bond with equilibrium constant KrefEM, where Kref is the association constant for formation of the corresponding intermolecular interaction (Fig. 1a). Strictly, the H-bond in Fig. 1b is an intermolecular interaction, but considering that it governs the second step of the process, we will refer to this interaction as intramolecular here. Through comparison between the intramolecular and intermolecular association constants for H-bond formation, the value of effective molarity (EM) can be determined experimentally.
 |
| | Fig. 1 (a) Kref is the association constant for formation of an intermolecular H-bond. (b) Stepwise equilibria in the formation of a porphyrin–pyridine complex containing an intramolecular H-bond. K0 is the intermolecular association constant for formation of the zinc–nitrogen interaction. KrefEM is the equilibrium constant for formation of the intramolecular H-bond, and EM is the effective molarity for the intramolecular interaction. | |
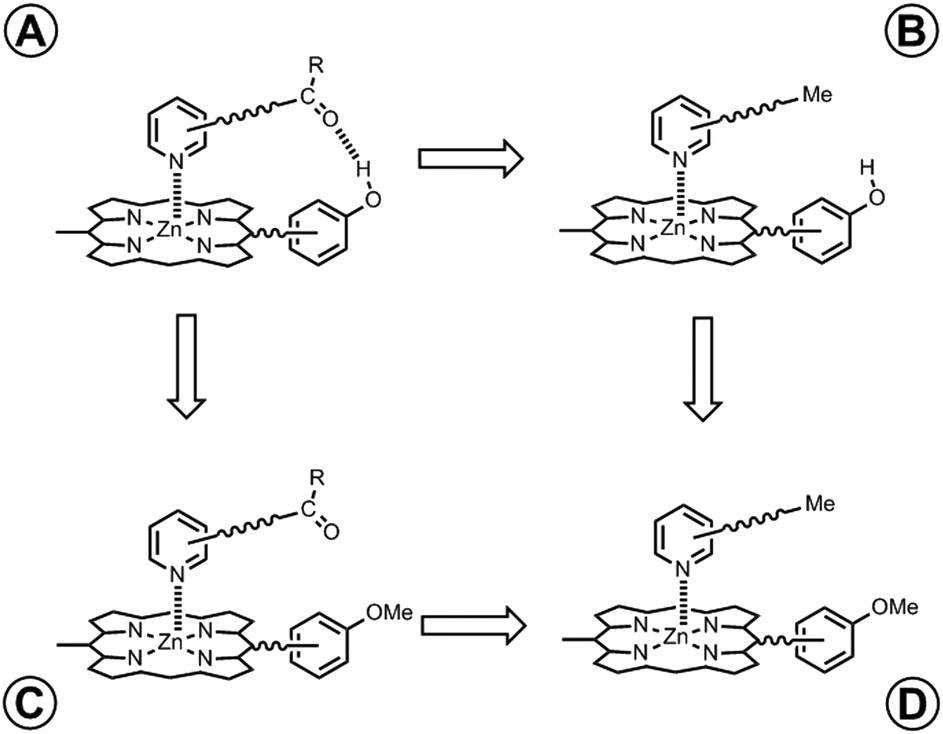
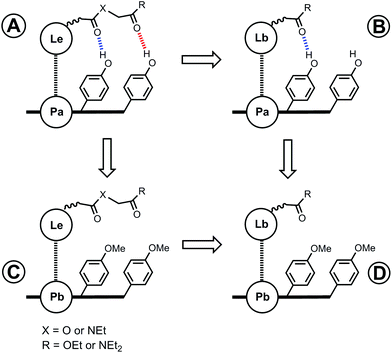
In order to measure the intramolecular equilibrium constant KrefEM, a chemical double mutant cycle (DMC) can be used to dissect out the free energy contribution of individual intramolecular interactions as shown in Fig. 2.14,15 In principle, comparison of the free energies of formation of complexes A and B measures the H-bond interaction between the porphyrin phenol group and the ligand carbonyl group. However, the difference between the stabilities of complexes A and B also includes a contribution from secondary interactions between the carbonyl H-bond acceptor and the porphyrin core. These secondary interactions can be directly measured by comparing the free energies of formation of non-H-bonding complexes C and D. Thus, the free energy contribution due to the intramolecular H-bond can be quantified using eqn (1). Using this approach and assuming that free energy contributions are additive, all secondary interactions cancel in a pairwise manner.14–16
| | | ΔΔG° = ΔG°A − ΔG°B − ΔG°C + ΔG°D | (1) |
 |
| | Fig. 2 Chemical double mutant cycle (DMC) for measurement of the free energy contribution of an intramolecular H-bond to the stability of complex A. | |
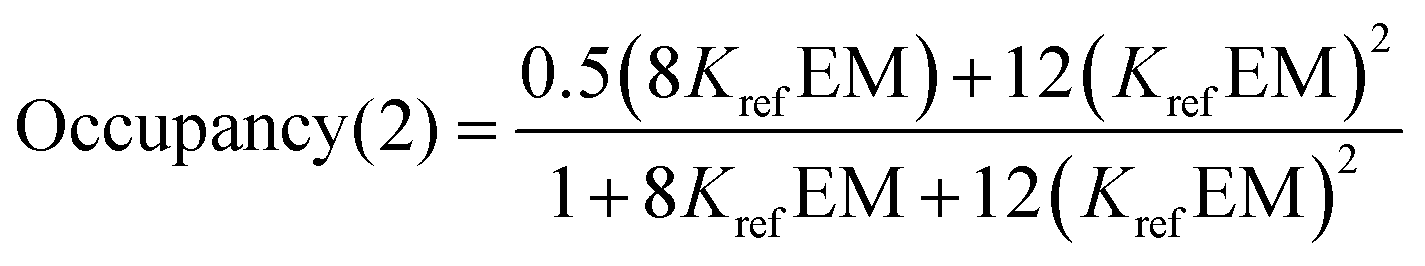
In any complex held together by multiple weak interactions, the bound state is a mixture of partially bound states, where not all of the interactions are fully populated.17,18 For example, the bound state in Fig. 1b is a population weighted average of the fully bound state, where both the H-bond and zinc–nitrogen interaction are formed, and the partially bound state, where only the zinc–nitrogen interaction is formed. The fully bound state will only dominate when KrefEM ≫ 1. Thus the value of ΔΔG° measured by the DMC reflects a population-weighted average of the partially and fully bound states and the value of EM is given by eqn (2). When KrefEM ≪ 1, the intramolecular H-bond is not formed and ΔΔG° is zero.
| | ΔΔG° = −RT![[thin space (1/6-em)]](https://www.rsc.org/images/entities/char_2009.gif) ln(1 + KrefEM) ln(1 + KrefEM) | (2) |
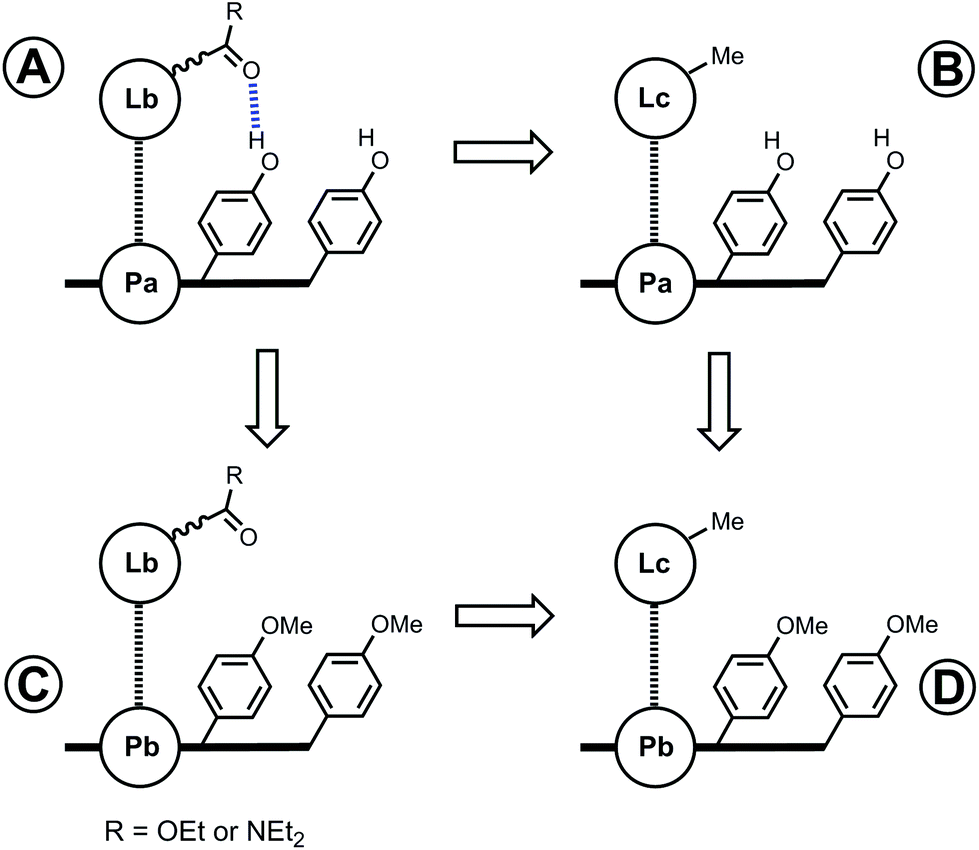
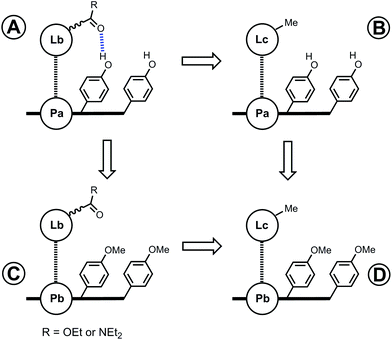
For complexes that can make two H-bonds, there are four possible bound states. Fig. 3 shows a complex where the porphyrin phenol groups can form a H-bond with a terminal carbonyl group (red) and with a linker carbonyl group (blue). When X = O, the terminal carbonyl group on the ligand is connected by an ester linker, which makes a weak H-bond (β = 5.3). When X = NEt, the terminal carbonyl group is connected by an amide linker, which makes a strong H-bond (β = 8.5).19 The strong H-bond formed with the amide linker will be highly populated compared with the ester linker, and the consequent preorganization of the amide ligand (X = NEt) might be expected to enhance the free energy contribution due to the H-bond formed with the terminal carbonyl group. In other words, the population of the blue H-bond in Fig. 3 may influence the population of the red H-bond. In this paper, we quantify the effect of linker preorganization on the EM for formation of H-bonds with the terminal carbonyl group by comparing families of ligands with amide and ester linkers.
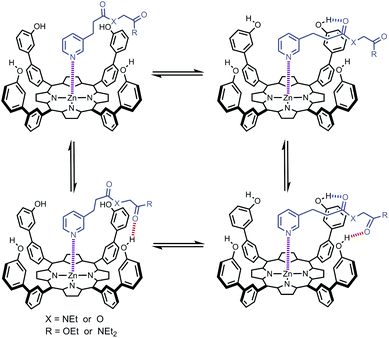 |
| | Fig. 3 Structure of a zinc porphyrin–pyridine ligand complex that can make two H-bonds. There are four different bound states with populations that depend on the strengths of the H-bonds that the porphyrin phenol groups make with the terminal carbonyl group (red) and with the linker carbonyl group (blue). | |
Results and discussion
Fig. 4 shows the structures of porphyrin receptors used in this work. Porphyrins P1a–P4a have peripheral phenol H-bond donor groups at different locations, and P1b–P4b are the corresponding non-H-bonding controls with methoxy groups. The two ligand families with ester linkers (L5 and L6) and amide linkers (L11 and L12) are shown in Fig. 5. The ligands are equipped with two different terminal H-bond acceptor groups, amide (Le) and ester (Lf). Control ligands with only the linker H-bond acceptors (Lb) and with no H-bond acceptors (Lc) are also shown.
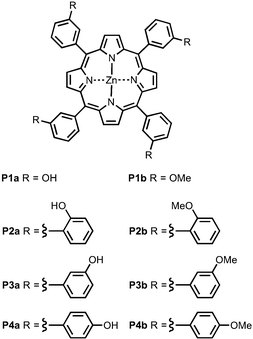 |
| | Fig. 4 Porphyrin receptors that can make H-bonds (P1a–P4a) and that cannot (P1b–P4b). | |
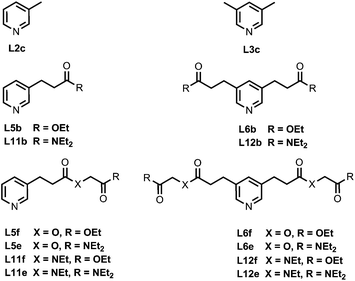 |
| | Fig. 5 Ligands equipped with different combinations of ester and amide H-bond acceptors and the control ligands (the numbering scheme is used to maintain consistency with previous publications). | |
Synthesis
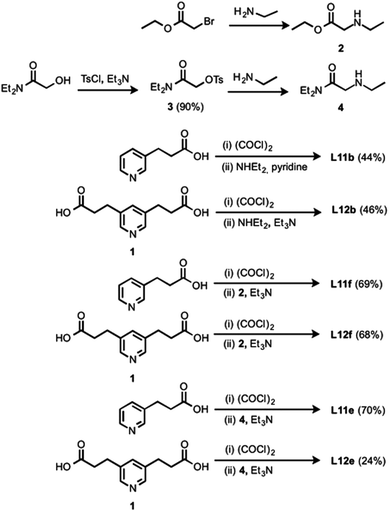
All ligands in the Lc series are commercially available. The synthesis of the porphyrin receptors and the ligands with ester linkers (L5 and L6) was published previously.16,20 The ligands with amide linkers (L11 and L12) were prepared by converting the corresponding pyridine carboxylic acid to the acid chloride and coupling with the appropriate amine (Scheme 1). Amines 2 and 4 were prepared based on literature procedures.21
 |
| | Scheme 1 | |
Binding studies
The association constants for formation of the 48 complexes between the 8 porphyrins and the 6 ligands (L11 and L12) were measured using UV/vis absorption and fluorescence titrations in both toluene and TCE (see Experimental section for details). All titration data fit well to a 1:1 binding isotherm apart from complex P4a·L12f in toluene, and the results are reported in Tables 1 and 2 for toluene and TCE respectively. Association constants for the complexes formed with the Lc, L5 and L6 ligand families in toluene and TCE have been reported previously.16,20
Table 1 Association constants (K/M−1) for the formation of 1:1 porphyrin–ligand complexes in toluene at 298 K (with percentage errors in brackets)
| Ligand |
Porphyrin |
|
P1a
|
P2a
|
P3a
|
P4a
|
P1b
|
P2b
|
P3b
|
P4b
|
|
Measured by manual displacement fluorescence titration.
Measured by automated fluorescence titration.
The titration data did not fit to a 1:1 binding isotherm, see appendix I for the UV/vis spectra.
The association constants measured in this work differ slightly from the previously published data.20,22
|
|
L5b
|
2.0 × 10⁴ (40%) |
3.1 × 10⁴ (60%) |
5.2 × 10⁴(20%)d |
9.2 × 10³ (10%)d |
6.9 × 10³ (30%) |
5.2 × 10³ (20%) |
9.1 × 10³ (30%) |
8.8 × 10³ (20%) |
|
L6b
|
2.8 × 10⁴ (20%) |
4.9 × 10⁴ (40%) |
1.2 × 10⁵ (30%) |
7.5 × 10³ (30%) |
4.7 × 10³ (30%) |
2.8 × 10³ (20%) |
6.0 × 10³ (20%) |
5.3 × 10³ (30%) |
|
L5f
|
1.7 × 10⁴ (10%) |
2.0 × 10⁴ (10%) |
3.8 × 10⁴ (5%) |
9.4 × 10³ (7%) |
6.2 × 10³ (20%) |
4.6 × 10³ (10%) |
8.5 × 10³ (4%) |
7.7 × 10³ (5%) |
|
L6f
|
5.2 × 10⁴ (20%) |
5.8 × 10⁴ (7%) |
1.0 × 10⁵ (10%) |
1.0 × 10⁴ (4%) |
6.3 × 10³ (10%) |
3.5 × 10³ (20%) |
5.6 × 10³ (5%) |
7.3 × 10³ (7%) |
|
L5e
|
2.4 × 10⁵ (30%)d |
2.2 × 10⁵ (10%) |
7.2 × 10⁵ (30%) |
2.5 × 10⁴ (4%) |
6.2 × 10³ (30%) |
4.0 × 10³ (8%) |
8.0 × 10³ (20%) |
6.9 × 10³ (1%) |
|
L6e
|
4.2 × 10⁶ (20%)b |
4.2 × 10⁶ (20%)b |
2.5 × 10⁷ (40%)b |
1.7 × 10⁵ (10%) |
7.3 × 10³ (30%) |
5.2 × 10³ (20%) |
9.0 × 10³ (7%) |
1.2 × 10⁴ (20%) |
|
L11b
|
2.6 × 10⁵ (10%) |
2.2 × 10⁵ (2%) |
8.0 × 10⁵ (20%) |
2.1 × 10⁴ (10%) |
1.3 × 10⁴ (5%) |
9.0 × 10³ (3%) |
1.6 × 10⁴ (3%) |
1.4 × 10⁴ (5%) |
|
L12b
|
2.3 × 10⁶ (9%) |
4.0 × 10⁶ (20%) |
3.3 × 10⁷ (2%)a |
5.1 × 10⁴ (8%) |
1.4 × 10⁴ (7%) |
9.2 × 10³ (2%) |
1.8 × 10⁴ (6%) |
1.8 × 10⁴ (4%) |
|
L11f
|
8.4 × 10⁴ (20%) |
2.0 × 10⁵ (4%) |
6.9 × 10⁵ (10%) |
1.4 × 10⁴ (30%) |
7.8 × 10³ (10%) |
5.9 × 10³ (5%) |
7.9 × 10³ (6%) |
1.0 × 10³ (5%) |
|
L12f
|
1.2 × 10⁶ (20%) |
2.7 × 10⁶ (10%) |
1.5 × 10⁷ (40%)b |
|
1.1 × 10⁴ (1%) |
8.1 × 10³ (3%) |
1.7 × 10⁴ (4%) |
1.7 × 10⁴ (5%) |
|
L11e
|
5.0 × 10⁵ (10%) |
6.7 × 10⁵ (4%) |
1.3 × 10⁶ (5%) |
6.3 × 10⁴ (6%) |
3.4 × 10³ (3%) |
4.1 × 10³ (4%) |
7.9 × 10³ (3%) |
7.6 × 10³ (7%) |
|
L12e
|
1.2 × 10⁸ (10%)a |
1.4 × 10⁸ (30%)a |
2.6 × 10⁸ (8%)a |
7.1 × 10⁵ (6%) |
1.4 × 10⁴ (6%) |
7.6 × 10³ (4%) |
1.9 × 10⁴ (3%) |
1.9 × 10⁴ (2%) |
Table 2 Association constants (K/M−1) for the formation of 1:1 porphyrin–ligand complexes in TCE at 298 K (with percentage errors in brackets)
| Ligand |
Porphyrin |
|
P1a
|
P2a
|
P3a
|
P4a
|
P1b
|
P2b
|
P3b
|
P4b
|
|
L5b
|
7.6 × 10³ (40%) |
6.1 × 10³ (30%) |
7.4 × 10³ (30%) |
2.0 × 10³ (30%) |
1.9 × 10³ (30%) |
1.4 × 10³ (30%) |
1.9 × 10³ (30%) |
1.6 × 10³ (30%) |
|
L6b
|
7.6 × 10³ (50%) |
4.6 × 10³ (50%) |
8.3 × 10³ (50%) |
7.5 × 10² (40%) |
8.1 × 10² (20%) |
5.7 × 10² (10%) |
7.2 × 10² (20%) |
6.5 × 10² (20%) |
|
L5f
|
6.8 × 10³ (10%) |
4.8 × 10³ (2%) |
4.9 × 10³ (10%) |
1.8 × 10³ (5%) |
1.6 × 10³ (40%) |
1.3 × 10³ (10%) |
1.7 × 10³ (10%) |
1.7 × 10³ (1%) |
|
L6f
|
1.3 × 10⁴ (5%) |
9.8 × 10³ (9%) |
1.0 × 10⁴ (20%) |
1.2 × 10³ (5%) |
1.0 × 10³ (20%) |
6.7 × 10² (10%) |
8.9 × 10² (20%) |
9.1 × 10² (10%) |
|
L5e
|
3.0 × 10⁴ (30%) |
2.2 × 10⁴ (9%) |
2.1 × 10⁴ (5%) |
4.0 × 10³ (8%) |
1.6 × 10³ (20%) |
1.2 × 10³ (20%) |
1.6 × 10³ (20%) |
1.4 × 10³ (7%) |
|
L6e
|
2.0 × 10⁵ (10%) |
1.1 × 10⁵ (9%) |
1.4 × 10⁵ (10%) |
4.4 × 10³ (10%) |
1.1 × 10³ (40%) |
7.9 × 10² (10%) |
8.7 × 10² (3%) |
8.9 × 10² (4%) |
|
L11b
|
3.7 × 10⁴ (10%) |
4.3 × 10⁴ (5%) |
7.8 × 10⁴ (4%) |
2.5 × 10³ (10%) |
2.3 × 10³ (20%) |
2.1 × 10³ (4%) |
2.4 × 10³ (4%) |
2.2 × 10³ (5%) |
|
L12b
|
1.8 × 10⁵ (10%) |
3.0 × 10⁵ (7%) |
1.6 × 10⁶ (10%) |
2.1 × 10³ (10%) |
1.9 × 10³ (4%) |
1.4 × 10³ (10%) |
1.6 × 10³ (10%) |
1.6 × 10³ (20%) |
|
L11f
|
2.4 × 10⁴ (8%) |
2.8 × 10⁴ (7%) |
3.3 × 10⁴ (9%) |
2.5 × 10³ (10%) |
2.6 × 10³ (2%) |
2.0 × 10³ (10%) |
2.4 × 10³ (8%) |
2.2 × 10³ (5%) |
|
L12f
|
9.1 × 10⁴ (40%) |
9.3 × 10⁴ (1%) |
1.8 × 10⁵ (4%) |
2.3 × 10³ (1%) |
1.4 × 10³ (3%) |
1.0 × 10³ (3%) |
1.1 × 10³ (4%) |
1.2 × 10³ (6%) |
|
L11e
|
4.5 × 10⁴ (30%) |
5.6 × 10⁴ (3%) |
3.3 × 10⁴ (1%) |
3.9 × 10³ (5%) |
1.2 × 10³ (20%) |
1.0 × 10³ (9%) |
1.0 × 10³ (9%) |
1.4 × 10³ (8%) |
|
L12e
|
8.2 × 10⁵ (8%) |
8.1 × 10⁵ (10%) |
9.7 × 10⁵ (20%) |
8.0 × 10³ (10%) |
1.3 × 10³ (10%) |
7.9 × 10² (7%) |
9.4 × 10² (4%) |
1.1 × 10³ (5%) |
The association constants in Tables 1 and 2 span six orders of magnitude from 102 to 108 M−1, depending on the H-bond acceptors, the solvent and geometrical complementarity. Fig. 6 compares the association constants measured for isomeric zinc porphyrin–ligand complexes in toluene (black) and in TCE (gray): the terminal amide ligands with ester linkers (L5e and L6e) and the terminal ester ligands with amide linkers (L11f and L12f) have practically identical association constants in both solvents. This suggests that the H-bonding interactions in these complexes make similar free energy contributions regardless of whether they are located in the linker or terminal sites on the ligands.
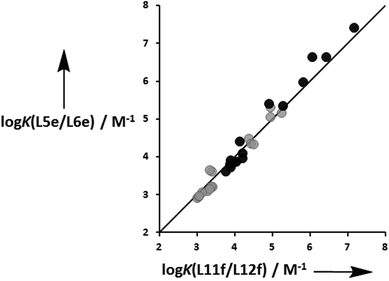 |
| | Fig. 6 Comparison of the association constants measured for isomeric zinc porphyrin–ligand complexes in toluene (black) and in TCE (gray): L5e and L6e are terminal amide ligands with ester linkers, and L11f and L12f are terminal ester ligands with amide linkers. The line corresponds to logK(L5e/L6e) = logK(L11f/L12f) (rmsd = 0.2). | |
DMC analysis of intramolecular H-bonds
The association constant data in Tables 1 and 2 are illustrated graphically in Fig. 7. The results are colour coded according to the role of the complex in the DMC. Complexes in blue, which can make both linker and terminal H-bonds, are generally more stable than the complexes in yellow, which can only make the linker H-bond, and the complexes in green and red, which cannot make any H-bonds.
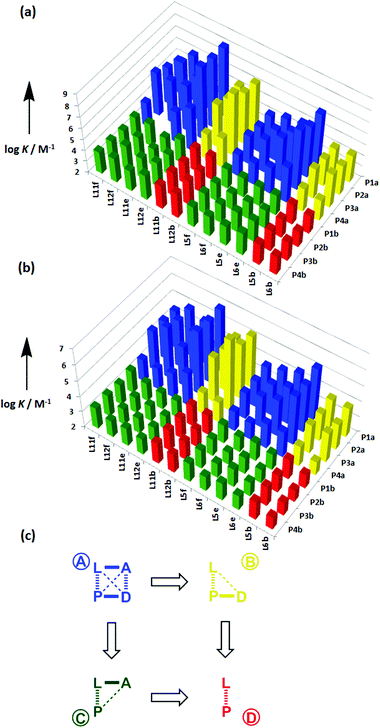 |
| | Fig. 7 Association constants (logK/M−1) with data colour coded according to the role in the DMC measured in (a) toluene and (b) TCE. (c) Schematic representation of the chemical double mutant cycle used to extract information on the magnitude of the intramolecular H-bonding interaction between H-bond acceptor A and H-bond donor D in complexes formed between a zinc porphyrin (P) and a pyridine ligand (L). | |
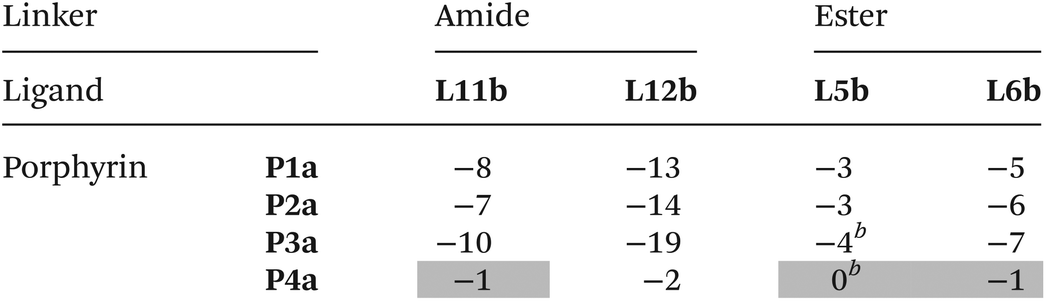
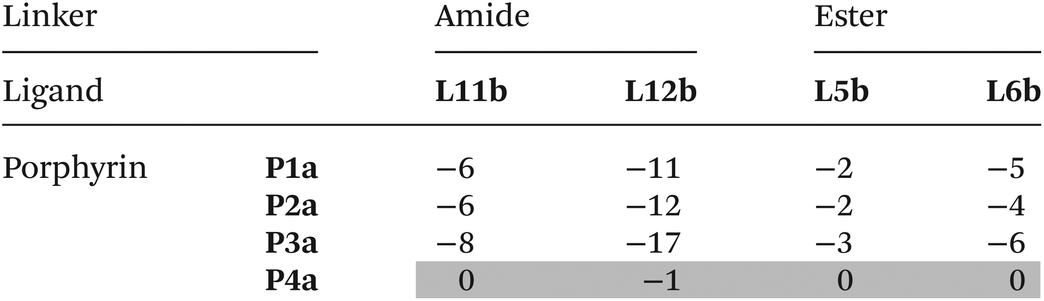
The free energy contributions of the linker H-bonds for the Lb series of ligands were determined using the DMC shown in Fig. 8. The results are listed in Tables 3 and 4 for toluene and TCE respectively. In toluene, 13 of 16 complexes make detectable intramolecular H-bonds. In TCE, 12 of 16 complexes make detectable H-bonds. On average, the linker amide H-bonds are 5 kJ mol−1 stronger than the linker ester H-bonds.
 |
| | Fig. 8 Chemical double mutant cycle (DMC) for measurement of the free energy contribution of H-bonds formed with the linker carbonyl group (blue) to the stability of a porphyrin–ligand complex. | |
Table 3 Free energy contributions from linker amide-phenol and linker ester-phenol H-bonds (ΔΔG°/kJ mol−1) determined using the DMC in Fig. 8 at 298 K in toluenea
|
Average error over the data set is ±1 kJ mol−1. Entries for complexes that do not make detectable H-bonds are italicized.
The association constants measured in this work differ slightly from the previously published data, and the values of ΔΔG° for these complexes correspondingly differ within 1 kJ mol−1.22
|

|
Table 4 Free energy contributions from linker amide-phenol and linker ester-phenol H-bonds (ΔΔG°/kJ mol−1) determined using the DMC in Fig. 8 at 298 K in TCEa
|
Average error over the data set is ±1 kJ mol−1. Entries for complexes that do not make detectable H-bonds are italicized.
|
|
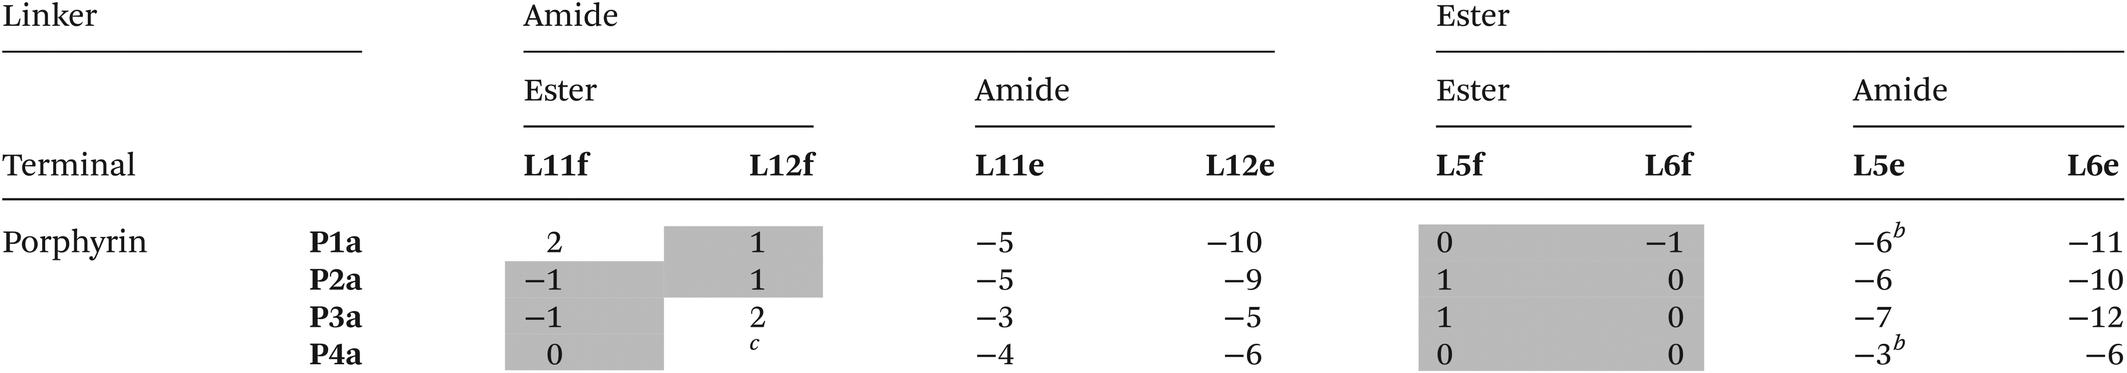
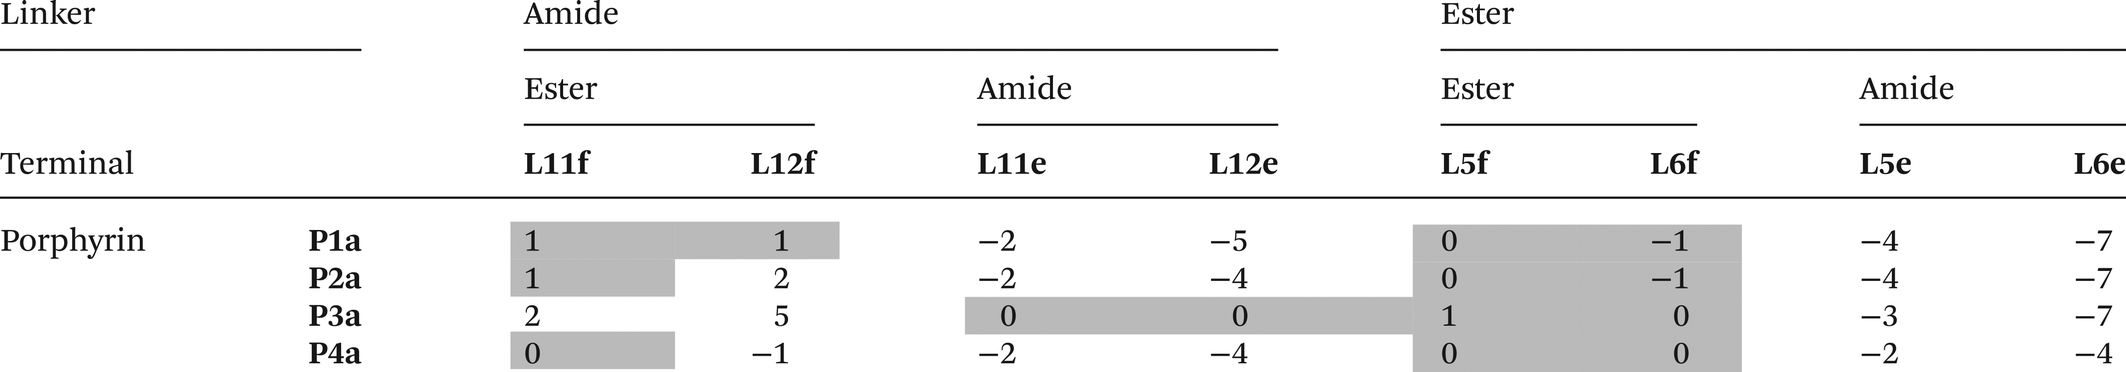
The free energy contributions due to the terminal H-bonds for the Le and Lf ligand series were determined using the DMC shown in Fig. 9. The results are listed in Tables 5 and 6 for toluene and TCE respectively. For the Lf ligands, most systems do not form detectable H-bonds with the terminal ester groups. For the Le ligands, all of the complexes make detectable amide-phenol H-bonds in toluene, and 14 of 16 complexes make detectable amide-phenol H-bonds in TCE.
 |
| | Fig. 9 Chemical double mutant cycle (DMC) for measurement of the free energy contribution of H-bonds formed with the terminal carbonyl group (red) to the stability of a porphyrin–ligand complex. | |
Table 5 Free energy contributions from terminal amide-phenol and ester-phenol H-bonds (ΔΔG°/kJ mol−1) determined using the DMC in Fig. 9 at 298 K in toluenea
|
Average error over the data set is ±1 kJ mol−1. Entries for complexes that do not make detectable H-bonds are italicized.
The association constants measured in this work differ slightly from the previously published data, and the values of ΔΔG° for these complexes correspondingly differ by 1–2 kJ mol−1.20
The titration data did not fit to a 1:1 binding isotherm (see ESI).
|

|
Table 6 Free energy contributions from terminal amide-phenol and ester-phenol H-bonds (ΔΔG°/kJ mol−1) determined using the DMC in Fig. 9 at 298 K in TCEa
|
Average error over the data set is ±1 kJ mol−1. Entries for complexes that do not make detectable H-bonds are italicized.
|

|
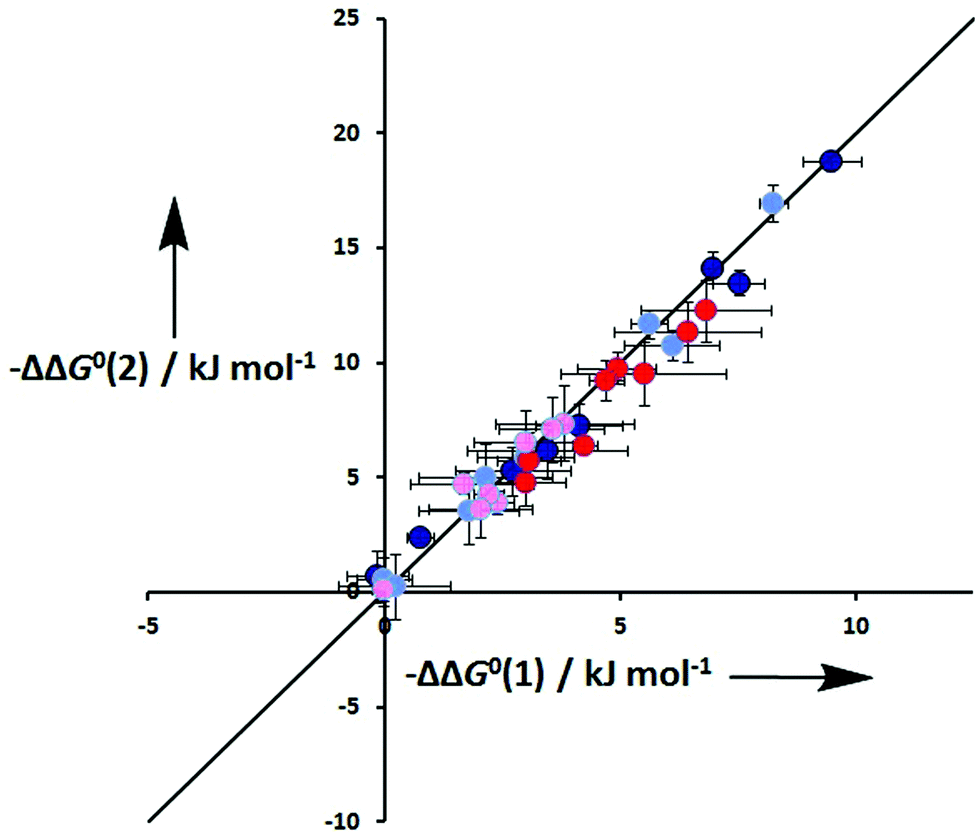
One assumption of the DMC methodology is that the free energy contributions from individual interactions are additive. Fig. 10 compares the total free energy contribution due to H-bonding interactions in complexes of one-armed ligands with complexes of the corresponding two-armed ligands. If free energy contributions are additive in these systems, the free energy contribution measured for two H-bonds (ΔΔG°(2)) should be double of the contribution due to one H-bond (ΔΔG°(1)). Fig. 10 shows that it is indeed the case in all of the systems studied here, confirming the validity of the additivity assumption.
 |
| | Fig. 10 Total free energy contribution due to intramolecular H-bonds for ligands with two identical side arms, ΔΔG°(2), compared with data for the corresponding one-armed ligands, ΔG°(1). Data for linker H-bonds in toluene are dark blue, and pale blue in TCE. Data for terminal H-bonds in toluene are red, and pink in TCE. The line corresponds to ΔΔG°(2) = 2ΔΔG°(1) (rmsd = 0.9 kJ mol−1). | |
Effective molarities for intramolecular H-bonds
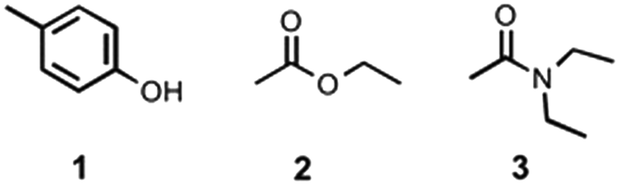
In order to convert the values of ΔΔG° into effective molarities (EM), the association constants for formation of the corresponding intermolecular interactions (Kref) were measured by 1H NMR titrations using the compounds shown in Fig. 11.23 In all cases, the data fit well to a 1:1 binding isotherm. The results are listed in Table 7 and compared with values estimated using literature H-bond parameters and eqn (3) (Kcalc). There is a good agreement between the experimental and calculated values.19| | | −RTlnKcalc = −(α − αS)(β − βS) + 6 kJ mol−1 | (3) |
where α and β are the H-bond parameters for the H-bond donor and acceptor, and αS and βS are the H-bond parameters for the solvent.
 |
| | Fig. 11 Compounds used to quantify intermolecular H-bonding interactions. | |
Table 7 Association constants (M−1) for the formation of intermolecular H-bonded complexes measured by 1H NMR titrations in d2-TCE and d8-toluene at 298 K (Kref) and estimated using eqn (3) (Kcalc)
| Solvent |
Complex |
α
|
β
|
α
S
|
β
S
|
K
ref
|
K
calc
|
| TCE |
5·6 |
3.8 |
5.3 |
2.0 |
1.3 |
2 ± 1 |
2 |
| TCE |
5·7 |
3.8 |
8.5 |
2.0 |
1.3 |
22 ± 3 |
16 |
| Toluene |
5·6 |
3.8 |
5.3 |
1.0 |
2.2 |
3 ± 1 |
3 |
| Toluene |
5·7 |
3.8 |
8.5 |
1.0 |
2.2 |
86 ± 20 |
110 |
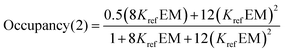
As illustrated in Fig. 3, complexes held together by multiple non-covalent interactions are mixtures of partially and fully bound states. Thus the association constant measured experimentally, Kobs, is the sum of the association constants of all possible bound states (eqn (4)).
where
K0 is the association constant for formation of only the intermolecular zinc–nitrogen coordination bond, and
f is given by
eqn (5).
| |  | (5) |
where
Ki are the association constants for formation of the corresponding intermolecular H-bonds (
i.e. Kref), EM
i are the effective molarities for formation of intramolecular H-bonds, and
σi are statistical factors that account for the degeneracies of the bound states (see ESI
† for details of the equations used for different complexes).
The zinc–nitrogen coordination bonds are not identical in all of the complexes, but differences in K0 cancel out in the DMC, so that the value of ΔΔG° can be related to the values of Ki and EMi by eqn (6).
| |  | (6) |
where the values of
fA,
fB,
fC and
fD are given by
eqn (5).
Values of EMi were determined by solving eqn (5) and (6) using the values of ΔΔG° in Tables 3–6 and the values of Ki in Table 7. The results are reported in Tables 8 and 9. The values of EM for formation of intramolecular H-bonds span two orders of magnitude from 7 mM to 460 mM.
Table 8 Effective molarities (EM mM−1) for linker H-bonds measured at 298 Ka
| Solvent |
Toluene |
TCE |
| Linker |
Amide |
Ester |
Amide |
Ester |
| Ligand |
L11b
|
L12b
|
L5b
|
L6b
|
L11b
|
L12b
|
L5b
|
L6b
|
|
Average errors over the data set are ±50%.
The association constants measured in this work differ slightly from the previously published data, and the values of EM for these complexes correspondingly differ slightly.22
No interaction detected.
|
| Porphyrin |
P1a
|
58 |
47 |
170 |
170 |
100 |
100 |
180 |
240 |
|
P2a
|
45 |
54 |
250 |
230 |
100 |
120 |
130 |
140 |
|
P3a
|
130 |
140 |
360b |
310 |
310 |
380 |
290 |
310 |
|
P4a
|
|
2 |
|
|
|
|
|
|
Table 9 Effective molarities (EM/mM) for terminal amide-phenol H-bonds measured at 298 Ka
| Solvent |
Toluene |
TCE |
| Linker |
Amide |
Ester |
Amide |
Ester |
| H-bond acceptor ligand |
Amide |
Amide |
Amide |
Amide |
|
L11e
|
L12e
|
L5e
|
L6e
|
L11e
|
L12e
|
L5e
|
L6e
|
|
Average errors over the data set are ±50%.
The association constants measured in this work differ slightly from the previously published data, and the values of EM for these complexes correspondingly differ slightly.20
No interaction detected.
|
| Porphyrin |
P1a
|
35 |
53 |
54b |
51 |
29 |
48 |
59 |
74 |
|
P2a
|
31 |
47 |
38 |
36 |
34 |
37 |
49 |
60 |
|
P3a
|
13 |
15 |
72b |
72 |
|
|
42 |
64 |
|
P4a
|
15 |
11 |
7b |
8 |
16 |
18 |
15 |
13 |
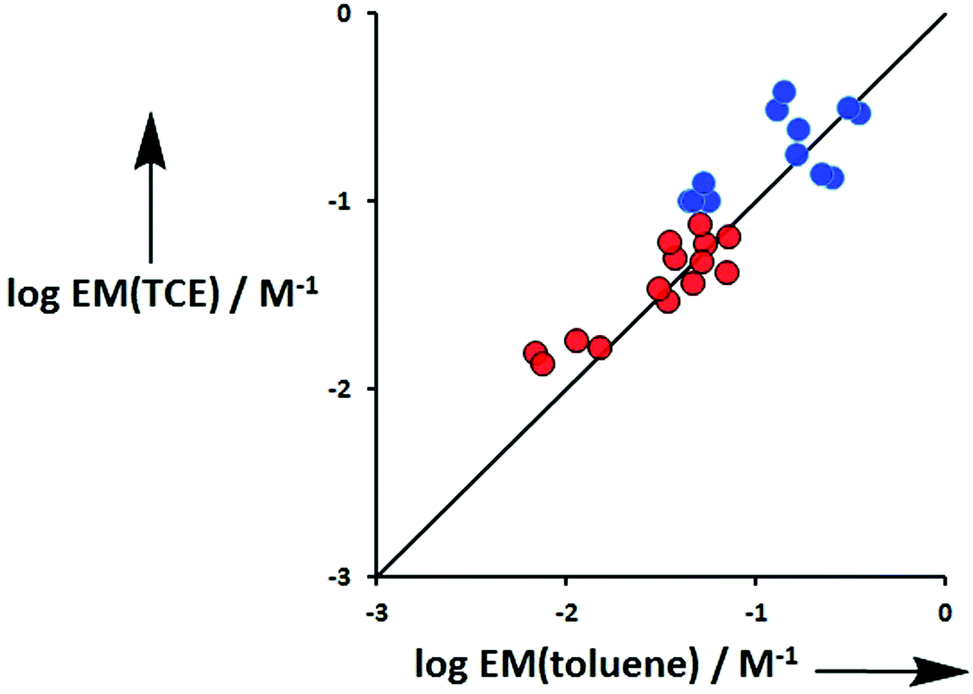
Fig. 12 compares values of EM measured in TCE with the corresponding values measured in toluene for both terminal H-bonds (red) and linker H-bonds (blue). There is good agreement between the values measured in the two different solvents, which indicates that EM is independent of solvent. This is consistent with previous observations and indicates that the major influence of solvent in these systems is to change the intrinsic strength of the individual interactions through competition for individual binding sites.24
 |
| | Fig. 12 Comparison of effective molarities (EM) for formation of intramolecular H-bonds measured in TCE with the corresponding values measured in toluene. Data for terminal H-bonds (Le) are shown in red and linker H-bonds (Lb) in blue. The line corresponds to logEM(TCE) = logEM(toluene) (rmsd = 0.2). | |
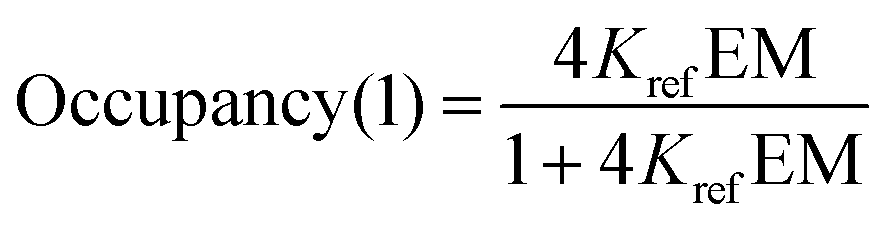
For the one armed ligands, the occupancy of the linker H-bond is given by the population of the fully bound state in the complexes formed with ligands L5b and L11b (eqn (7)).
| |  | (7) |
For the two armed ligands, the occupancy of the linker H-bond can be estimated based on the populations of fully and partially bound states in the complexes formed with ligands L6b and L12b. The probability that the linker H-bond is occupied is given by the sum of the population of the fully bound state and half of the population of the state where only one of the two H-bonds is made (eqn (8)).
| |  | (8) |
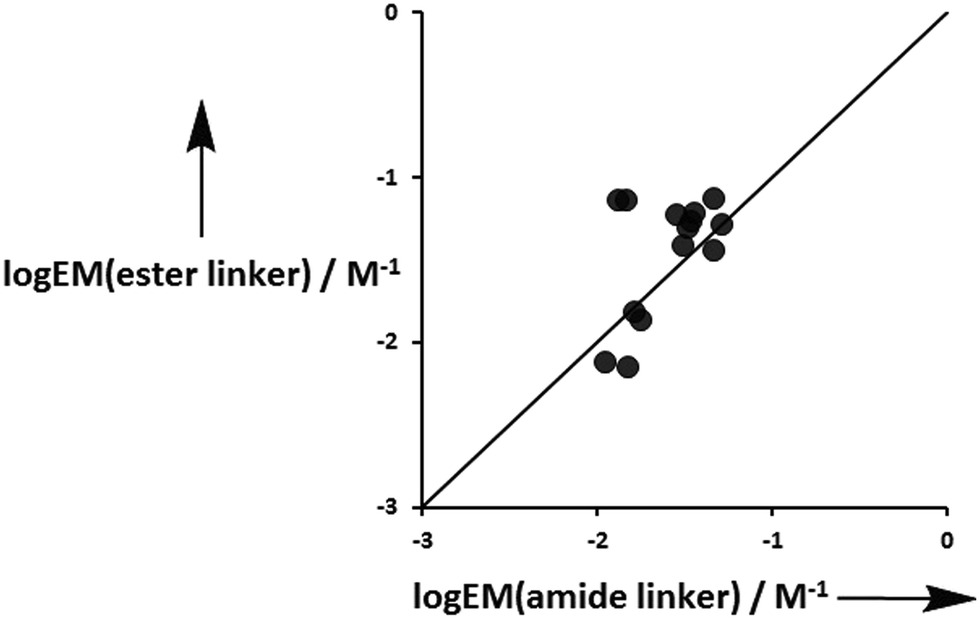
With the exception of the P4 complexes, where geometric mismatch precludes H-bonding, on average the amide linker H-bonds are 95% and 91% occupied in toluene and TCE respectively, whereas the ester linker H-bonds are 73% and 60% bound in toluene and TCE (Table 10). This implies that the amide linker imposes a significantly greater conformational restriction than an ester linker. Fig. 13 compares the values of EM measured for formation of terminal phenol-amide H-bonds using ligands with an ester linker (L5e and L6e) with the corresponding values measured for ligands with an amide linker (L11e and L12e). The values of EM are in good agreement in most cases, which indicates that the preorganization of the linker has no effect on chelate cooperativity for the formation of intramolecular H-bonds in these systems. There are two outliers in Fig. 13, and these correspond to the P3a·L11e/L12e and P3a·L5e/L6e complexes in toluene. In these systems, the EM for the amide linker is five times smaller than the value for the ester linker. In this case, it appears that the formation of the first H-bond with the amide linker prevents the terminal amide group from achieving an optimal geometry for formation of the second H-bond.
 |
| | Fig. 13 Comparison of effective molarities (EM) measured for formation of terminal phenol-amide H-bonds using ligands with an ester linker, logEM(ester linker), with the corresponding values measured for ligands with an amide linker, logEM(amide linker). The line corresponds to logEM(ester linker) = logEM(amide linker) (rmsd = 0.3). | |
Table 10 Occupancy of the linker H-bond (%)
| Solvent |
Toluene |
TCE |
| Linker |
Amide |
Ester |
Amide |
Ester |
| Ligand |
L11b
|
L12b
|
L5b
|
L6b
|
L11b
|
L12b
|
L5b
|
L6b
|
|
No interaction detected.
|
| Porphyrin |
P1a
|
95 |
93 |
67 |
63 |
90 |
87 |
58 |
61 |
|
P2a
|
94 |
93 |
75 |
69 |
90 |
89 |
52 |
49 |
|
P3a
|
98 |
97 |
81 |
81 |
96 |
96 |
70 |
67 |
|
P4a
|
|
37 |
|
|
|
|
|
|
Conclusion
We have use a series of zinc porphyrin–pyridine complexes to investigate the influence of overall stability on chelate cooperativity for formation of intramolecular H-bonds. Two ligand families with different combinations of amide and ester H-bond acceptors located at different positions on the ligand framework were used to investigate the effects of preorganization of the ligand. The interactions of these ligands with eight different zinc porphyrins were studied in both toluene and TCE using UV/Vis absorption and fluorescence titrations. Thirty-two different DMCs were constructed to dissect out the free energy contributions of the intramolecular H-bonds and to determine the corresponding values of EM. Two different types of H-bond were measured: interactions with H-bond acceptors located on the end of the ligand side arms (terminal H-bonds), and interactions with H-bond acceptors located in the middle of the ligand side arms (linker H-bonds). Linker ester groups populate the H-bonded state 60–70% of the time, whereas amide linker groups populate the H-bonded state 90–100% of the time. Thus the amide linkers provide a significantly more preorganised ligand framework than the ester linkers. Nevertheless, the values of EM for the terminal H-bonds are very similar for both types of linker. The results suggest that preorganization of linker has no effect on chelate cooperativity in these systems.
Experimental section
Synthesis
Compound 3 A solution of p-toluene sulphonyl chloride (3.66 g, 19.2 mmol) in dichloromethane (10 ml) was added to a solution of N,N-diethyl-2-hydroxy-acetamide (2.00 ml, 15.4 mmol) in dichloromethane (10 ml) protected under a nitrogen atmosphere, and the mixture was cooled to 0 °C. Triethylamine (3.22 ml, 23.1 mmol) was added dropwise, and the solution was stirred for 18 hours at room temperature. The reaction mixture was washed with brine (2 × 20 ml), and dried with magnesium sulphate. The solvent was removed on a rotary evaporator, and the crude product was purified by column chromatography on silica eluting with a mixture of hexane and ethyl acetate. The product was isolated as a colourless oil (3.95 g, 90%). 1H NMR (250 MHz, CDCl3): δH = 7.71 (d, 2H, J = 8), 7.24 (d, 2H, J = 8), 4.54 (s, 2H), 3.26–2.98 (m, 4H), 2.32 (s, 3H), 1.11–0.99 (m, 6H).
Ligand L11b.
Oxalyl chloride (2.70 ml, 31.0 mmol) and DMF (20 μl) were added to 3-(3-pyridinyl)propanoic acid (1.00 g, 6.62 mmol) in dichloromethane (100 ml) protected by a nitrogen atmosphere. The reaction mixture was stirred for 2 hours, the solvent was removed on a rotary evaporator, and the residue was redissolved in dichloromethane (80 ml). The solution was cooled to 0 °C in a flask protected by a nitrogen atmosphere and a CaCl2 drying tube, then diethylamine (1.13 ml, 13.2 mmol) and pyridine (1.61 ml, 19.2 mmol) were added in small portions with stirring. After 24 hours, the reaction mixture was washed with aqueous sodium hydrogen carbonate (10% w/v) (2 × 100 ml), brine (50 ml) and dried with sodium sulphate. The solvent was removed on a rotary evaporator, and the residue was purified by column chromatography on silica eluting with a mixture of ethyl acetate and hexane. The product was isolated as a clear oil (0.60 g, 44%). 1H NMR (250 MHz, CDCl3): δH = 8.50 (s, 1H), 8.46 (d, 1H, J = 5), 7.58 (d, 1H, J = 8), 7.22 (dd, 1H, J = 5, J = 8), 3.38 (q, 2H, J = 7), 3.24 (q, 2H, J = 7), 3.02 (t, 2H, J = 7), 2.60 (t, 2H, J = 7), 1.11 (t, 6H, J = 7); 13C NMR (101 MHz, CDCl3):δC = 170.5, 149.9, 147.6, 136.9, 136.2, 123.3, 41.9, 40.3, 34.4, 28.6, 14.3, 13.1; HRMS (ES+): calcd for C12H19N2O: 207.1497; found 207.1499; FT-IR (thin film): νmax/cm−1 2975, 2930, 1628, 1465, 1424, 1220, 1145, 1119, 1030, 1000.
Ligand L12b.
Oxalyl chloride (0.91 ml, 10.8 mmol) and DMF (20 μl) were added to 3,5-pyridinedipropanoic acid (0.24 g, 1.08 mmol) in dichloromethane (100 ml) protected by a nitrogen atmosphere at 0 °C. The reaction mixture was stirred for 3 hours, the solvent was removed on a rotary evaporator, and the residue was redissolved in dichloromethane (80 ml). The solution was cooled to 0 °C in a flask protected by a nitrogen atmosphere and a CaCl2 drying tube, and diethylamine (0.40 ml, 4.30 mmol) and triethylamine (0.90 ml, 6.46 mmol) were added in small portions with stirring. After 24 hours, the reaction mixture was washed with aqueous sodium hydrogen carbonate (10% w/v) (2 × 20 ml), brine (20 ml) and dried with sodium sulphate. The solvent was removed on a rotary evaporator, and the residue was purified by column chromatography on silica eluting with a mixture of ethyl acetate and hexane. The product was isolated as a clear oil (0.17 g, 46%). 1H NMR (250 MHz, CDCl3): δH = 8.30 (s, 2H), 7.41 (s, 1H), 3.35 (q, 4H, J = 7), 3.22 (q, 4H, J = 7) 2.95 (t, 4H, J = 7), 2.57 (t, 4H, J = 8), 1.09 (t, 6H, J = 7), 1.08 (t, 6H, J = 7); 13C NMR (63 MHz, CDCl3): δC = 170.5, 147.6, 136.6, 136.3, 41.9, 40.3, 34.4, 28.4, 14.3 13.1; HRMS (ES+): calcd for C19H32N3O2: 334.2495; found 334.2479; FT-IR (thin film): νmax/cm−1 2974, 2922, 1624, 1426, 1388, 1263, 1216, 1135, 720.
Ligand L11f.
Ethylamine (14.0 ml, 28.0 mmol) was dissolved in dry acetonitrile (25 ml) and the solution was cooled to 0 °C. Ethyl 2-bromoacetate (0.78 ml, 7.00 mmol) was added to the vigorously stirred reaction mixture. The reaction mixture was allowed to warm up to room temperature and stirred for an additional four hours. The solvent was removed on a rotary evaporator to afford amine 2 as a slightly yellow oil.
Oxalyl chloride (2.80 ml, 33.0 mmol) and dimethylformamide (10 μl) were added slowly to a solution of 3-pyridyl-propionic acid (1.00 g, 6.60 mmol) in dichloromethane (100 ml) in a flask protected by a nitrogen atmosphere and cooled to 0 °C. The reaction mixture was stirred for two hours at room temperature. The solvent was removed on a rotary evaporator, and the residue was redissolved in dichloromethane (100 ml). The freshly prepared amine 2 (0.92 g, 7.00 mmol) was added in small portions and then triethylamine (2.00 ml, 19.8 mmol) was added dropwise. The solution was allowed to stir for 18 hours at room temperature. After dilution with dichloromethane (20 ml), the solution was washed with aqueous sodium hydrogen carbonate (10% w/v) (1 × 40 ml), brine (1 × 40 ml) and dried with magnesium sulphate. The solvent was removed on a rotary evaporator, and the crude product was purified on silica eluting with a mixture of hexane and ethyl acetate. The product was isolated as yellow oil (1.20 g, 69%). 1H NMR (250 MHz, CDCl3): δH = 8.45 (s, 1H), 8.43–8.39 (m, 1H), 7.56–7.50 (m, 1H), 7.20–7.15 (m, 1H), 4.18–4.12 (m, 2H), 4.01 (s, 1.5H), 3.92 (s, 0.5H), 3.44 (q, 0.5H, J = 7 Hz), 3.36 (q, 1.5H, J = 7 Hz), 2.99–2.93 (m, 2H), 2.67 (t, 1.5H, J = 8 Hz), 2.51 (t, 0.5H, J = 8 Hz), 1.24 (t, 2.3H, J = 7 Hz), 1.10 (t, 2.3H, J = 7 Hz), 1.06 (t, 0.7H, J = 7 Hz); 13C NMR (126 MHz, CDCl3): δC = 171.6 (171.4), 169.4 (169.2), 149.7, 147.5, 136.6, 136.1, 123.3, (61.6) 61.1, (49.2) 47.2, 43.5 (42.3), (34.4) 33.9, 28.2, 14.1, 13.7 (12.5); HRMS (ES+): calcd for C14H21N2O3: 265.1552; found 265.1553; FT-IR (thin film): νmax/cm−1 2977, 2941, 1743, 1641, 1448, 1423, 1193, 1124, 1030, 746, 662.
Ligands L11e.
Ethylamine (14.0 ml, 28.0 mmol) was dissolved in dry acetonitrile (25 ml) and the solution was cooled to 0 °C. N,N-Diethyl-2[(4-methylbenzenesulphonyl)-oxy]acetamide 3 (2.00 g, 7.00 mmol) was added to the vigorously stirred reaction mixture. The reaction mixture was allowed to warm up to room temperature and was stirred for additional four hours. The solvent was removed on a rotary evaporator to afford the amine 4 as a slightly yellow oil.
Oxalyl chloride (2.80 ml, 33.0 mmol) and dimethyl-formamide (10 μl) were added slowly to a solution of 3-pyridyl-propionic acid (1.00 g, 6.60 mmol) in dichloromethane (100 ml) in a flask protected by a nitrogen atmosphere and cooled to 0 °C. The mixture was stirred for two hours at room temperature. The solvent was removed on a rotary evaporator, and the residue was redissolved in dichloromethane (100 ml). The freshly prepared amine 4 (1.11 g, 7 mmol) was added in small portions, and then triethylamine (2.0 ml, 19.8 mmol) was added dropwise. The solution was allowed to stir 18 hours at room temperature. After dilution with dichloromethane (20 ml), the solution was washed with aqueous sodium hydrogen carbonate (10% w/v) (1 × 40 ml), brine (1 × 40 ml) and dried with magnesium sulphate. The solvent was removed on a rotary evaporator, and the crude product was purified on silica eluting with a mixture of ethyl acetate, methanol and acetic acid. The product was isolated as a yellow oil (1.35 g, 70%). 1H NMR (250 MHz, CDCl3): δH = 8.47 (s, 1H), 8.44–8.38 (m, 1H), 7.67–7.62 (m, 1H), 7.29–7.24 (m, 1H), 4.10 (s, 1.7H), 3.97 (s, 0.3H), 3.46–3.23 (m, 6H), 2.99 (t, 2H, J = 8 Hz), 2.69 (t, 1.7H, J = 8 Hz), 2.47 (t, 0.3H, J = 8 Hz), 1.24–1.15 (m, 3H), 1.13–1.02 (m, 6H); 13C NMR (101 MHz, CDCl3): δC = 171.7, 167.3, 148.3 (148.1), 146.0 (145.8), 137.6, 137.5, 123.9, (48.6) 46.3, 43.5 (42.6), 41.4 (41.2), (40.9) 40.7, (34.2) 33.9, 28.2, (14.4) 14.1, 13.61 (13.0), 12.9 (12.6); HRMS (ES+): calcd for C16H26N3O2: 292.2025; found 292.2018; FT-IR (thin film): νmax/cm−1 2975, 2932, 1716, 1635, 1457, 1426, 1263, 1221, 1123.
Ligand L12f.
Ethylamine (14.0 ml, 28.0 mmol) was dissolved in dry acetonitrile (25 ml) and the solution was cooled to 0 °C. Ethyl 2-bromoacetate (0.78 ml, 7.00 mmol) was added to the vigorously stirred reaction mixture. This reaction mixture was allowed to warm up to room temperature and stirred for additional four hours. The solvent was removed on a rotary evaporator to afford the amine 2 as a slightly yellow oil.
Oxalyl chloride (2.80 ml, 33.0 mmol) and dimethyl-formamide (20 μl) were added slowly to a solution of diacid (0.74 g, 3.30 mmol) in dichloromethane (100 ml) in a flask protected by a nitrogen atmosphere and cooled at 0 °C. The mixture was stirred for two hours at room temperature. The solvent was removed on a rotary evaporator, and the residue was redissolved in dichloromethane (100 ml). The freshly prepared amine 2 (0.92 g, 7.00 mmol) was added in small portions and then triethylamine (1.3 ml, 12.9 mmol) was added dropwise. The solution was allowed to stir 18 hours at room temperature. After dilution with dichloromethane (20 ml), the solution was washed with aqueous sodium hydrogen carbonate (10% w/v) (1 × 40 mL), brine (1 × 40 ml) and dried with magnesium sulphate. The solvent was removed on a rotary evaporator, and the crude product was purified on silica eluting with a mixture of ethyl acetate, methanol and acetic acid. The product was isolated as a yellow oil, (1.01 g, 68%). 1H NMR (400 MHz, CDCl3): δH = 8.21–8.14 (m, 2H), 7.35–7.26 (m, 1H), 4.10–3.99 (m, 4H), 3.91 (s, 3H), 3.86 (s, 1H), 3.36–3.21 (m, 4H), 2.90–2.76 (m, 4H), 2.62–2.52 (m, 3H), 2.45–2.33 (m, 1H), 1.13 (t, 6H, J = 7 Hz), 1.01 (t, 4.5H, J = 7 Hz), 0.95 (t, 1.5H, J = 7 Hz); 13C NMR 171.6 (171.4), 169.3, 147.5, 136.3, 136.1, (61.5) 60.9, (49.2) 47.2, (43.5) 42.2, (34.1) 33.8, 27.9 (27.9), 14.0, 13.7 (12.5); HRMS (ES+): calcd for C23H36N3O6: 450.2604; found 450.2606; FT-IR (thin film): νmax/cm−1 2979, 2936, 1745, 1646, 1446, 1197, 1125, 1030.
Ligand L12e.
Ethylamine (14.0 ml, 28.0 mmol) was dissolved in dry acetonitrile (25 ml) and the solution was cooled to 0 °C. N,N-Diethyl-2[(4-methylbenzenesulphonyl)-oxy]acetamide 3 (2.00 g, 7.00 mmol) was added to vigorously stirred reaction mixture. The reaction mixture was allowed to warm up to room temperature and was stirred for additional 4 hours. The solvent was removed on a rotary evaporator to afford the amine 4 as a slightly yellow oil.
Oxalyl chloride (2.8 ml, 33 mmol) and dimethylformamide (20 μl) were added slowly to the diacid (0.74 mg, 3.3 mmol) in dichloromethane (100 ml) in a flask protected by a nitrogen atmosphere and cooled at 0 °C. The mixture was stirred for 2 hours at room temperature. The solvent was removed on a rotary evaporator, and the residue was redissolved in dichloromethane (100 ml). The freshly prepared amine 4 (1.11 g, 7.00 mmol) was added in small portions and then triethylamine (1.30 ml, 12.9 mmol) was added dropwise. The solution was allowed to stir 18 hours at room temperature. After dilution with dichloromethane (20 ml), the solution was washed with aqueous sodium hydrogen carbonate (10% w/v) (1 × 40 ml), brine (1 × 40 ml) and dried with magnesium sulphate. The solvent was removed on a rotary evaporator, and the crude product was purified first on silica eluting with a mixture of ethyl acetate, methanol and acetic acid and then by a reverse phase C18 column eluting with a mixture of methanol and water. The product was isolated as a yellow oil, (0.4 g, 24%). 1H NMR (400 MHz, CDCl3): 8.34–8.27 (m, 2H), 7.44–7.37 (m, 1H), 4.12 (s, 3.3H), 3.98 (s, 0.7H), 3.50–3.20 (m, 12H), 3.02–2.90 (m, 4H), 2.74–2.64 (m, 3.3H), 2.50–2.42 (m, 0.7H), 1.27–1.18 (m, 6H), 1.17–1.07 (m, 12H); 13C NMR (172.0) 171.7, 167.2 (166.5), 147.5, 136.6, 136.3, (48.6) 46.2, 43.4 (42.5), 41.4 (41.2), (40.9) 40.6, (34.4) 34.1, 28.2, 14.2, 13.7, 13.0; HRMS (ES+): calcd for C27H46N5O4: 504.3550; found 504.3564; FT-IR (thin film): νmax/cm−1 2974, 2933, 1645, 1450, 1382, 1263.
Automated UV/vis absorption titrations
UV/vis titrations were carried out using a BMG FLUOstar Omega plate reader equipped with a UV/v is detector and equilibrated at 298 K. A 5 ml solution of porphyrin was prepared at known concentration (1–5 μM) in spectroscopic grade solvent. A 10 ml solution of ligand was prepared at known concentration (8–40000 μM) using spectroscopic grade solvent. 150 μl of the porphyrin solution was added to a well of a Hellma quartz microplate, and the absorbance at five wavelengths was recorded. Aliquots of the ligand solution (3, 6 or 10 μl) were successively added to the well, and the absorbance was recorded after each addition. Changes in absorbance were fit to a 1:1 binding isotherm in Microsoft Excel to obtain the association constant. Each titration was repeated at least three times, and the experimental error is quoted as twice the standard deviation at a precision of one significant figure.
Automated fluorescence titrations
Fluorescence titrations were carried out at 298 K using the BMG FLUOstar Omega plate reader equilibrated. A 10 ml solution of porphyrin was prepared at known concentration (0.1–1 μM) in spectroscopic grade solvent. A 10 ml solution of ligand was prepared at known concentration (5–63 μM) using spectroscopic grade solvent. 150 μl of the porphyrin solution was added to each of 12 wells of a Hellma quartz microplate. Different volumes of ligand solution (0–150 μl) were added to each well and solvent was added to give a total volume of 300 μl. The excitation wavelength was set at 420 or 430 nm, and the fluorescence emission was measured at four wavelengths (590, 600, 620 and 650 nm) for each well. Changes in fluorescence emission were fit to a 1:1 binding isotherm in Microsoft Excel to obtain the association constant. Each titration was repeated at least three times, and the experimental error is quoted as twice the standard deviation at a precision of one significant figure.
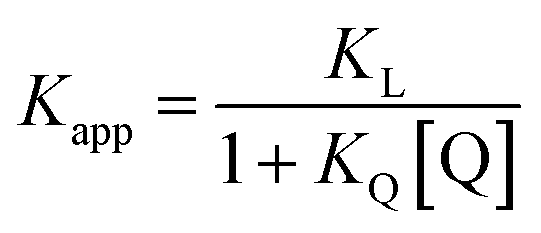
Fluorescence displacement titrations
Fluorescence displacement titrations were carried out at 298 K using a Hitachi F-4500 fluorescence spectrophoto-meter. A 20 ml solution of ligand Q (Fig. 14) at known concentration (about 10 mM) was prepared using spectroscopic grade solvent. A 10 ml solution of porphyrin was prepared at known concentration (about 0.5 μM) by dissolving the porphyrin in the Q stock solution. A 2 ml stock solution of ligand L was prepared at known concentration (about 1 μM) by dissolving L in the porphyrin-Q stock solution, so that the concentration of the porphyrin and Q remained constant throughout the titration. 2 ml of the porphyrin-Q stock solution was loaded into a 1 cm path length fluorescence cuvette, and the fluorescence emission spectrum was recorded between 500 and 750 nm exciting at 427 nm. Aliquots of the L stock solution were added successively to the cuvette, and the emission spectrum was recorded after each addition. Microsoft Excel was used to fit the fluorescence emission intensity at fixed wavelengths to a 1:1 binding isotherm with a linear correction to allow for non-specific effects. This gave the apparent association constant, Kapp, which was used to determine the association constant for formation of the porphyrin–ligand complex using eqn (9) and KQ from Table 11. Each titration was repeated at least three times, and the experimental error is quoted as twice the standard deviation at a precision of one significant figure.| |  | (9) |
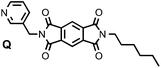 |
| | Fig. 14 Ligand Q used in fluorescence displacement titrations. | |
Table 11 Association constants (M−1) for the formation of zinc porphyrin·Q complexes measured by UV/vis absorption titrations at 298 K in toluene (KQ)
| Porphyrin |
K
Q/104 M−1 |
|
P1a
|
3.3 ± 1 |
|
P2a
|
3.1 ± 0.1 |
|
P3a
|
2.3 ± 0.6 |
|
P4a
|
1.6 ± 0.2 |
Acknowledgements
We thank the EPSRC, the China Scholarship Council, and the University of Sheffield for funding.
Notes and references
- C. Fasting, C. A. Schalley, M. Weber, O. Seitz, S. Hecht, B. Koksch, J. Dernedde, C. Graf, E.-W. Knapp and R. Haag, Angew. Chem., Int. Ed., 2012, 51, 10472 CrossRef CAS PubMed.
- J. D. Badjic, A. Nelson, S. J. Cantrill, W. B. Turnbull and J. F. Stoddart, Acc. Chem. Res., 2005, 38, 723 CrossRef CAS PubMed.
- R. J. Pieters, Org. Biomol. Chem., 2009, 7, 2013 CAS.
- N. Jayaraman, Chem. Soc. Rev., 2009, 38, 3463 RSC.
- D. Philp and J. F. Stoddart, Angew. Chem., Int. Ed. Engl., 1996, 35, 1155 CrossRef CAS.
- A. Mulder, J. Huskens and D. N. Reinhoudt, Org. Biomol. Chem., 2004, 2, 3409 CAS.
- P. I. Kitov, J. M. Sadowska, G. Mulvey, G. D. Armstrong, H. Ling, N. S. Pannu, R. J. Read and D. R. Bundle, Nature, 2000, 403, 669 CrossRef CAS PubMed.
- D. H. Williams, N. L. Davies and J. J. Koivisto, J. Am. Chem. Soc., 2004, 126, 14267 CrossRef CAS PubMed.
- C. A. Hunter and H. L. Anderson, Angew. Chem., Int. Ed., 2009, 48, 7488 CrossRef CAS PubMed.
- C. A. Hunter, N. Ihekwaba, M. C. Misuraca, M. D. Segarra-Maset and S. M. Turega, Chem. Commun., 2009, 3964 RSC.
- R. Cacciapaglia, S. DiStefano and L. Mandolini, Acc. Chem. Res., 2004, 37, 113 CrossRef CAS PubMed.
- A. J. Kirby, Adv. Phys. Org. Chem., 1981, 17, 183 CrossRef.
- C. Galli and L. Mandolini, Eur. J. Org. Chem., 2000, 3117 CrossRef CAS.
- A. Camara-Campos, D. Musumeci, C. A. Hunter and S. Turega, J. Am. Chem. Soc., 2009, 131, 18518 CrossRef CAS PubMed.
- S. L. Cockroft and C. A. Hunter, Chem. Soc. Rev., 2007, 36, 172 RSC.
- C. A. Hunter, M. C. Misuraca and S. M. Turega, J. Am. Chem. Soc., 2011, 133, 582 CrossRef CAS PubMed.
- C. A. Hunter and S. Tomas, Chem. Biol., 2003, 10, 1023 CrossRef CAS PubMed.
- E. Chekmeneva, C. A. Hunter, M. J. Packer and S. M. Turega, J. Am. Chem. Soc., 2008, 130, 17718 CrossRef CAS PubMed.
- C. A. Hunter, Angew. Chem., Int. Ed., 2004, 43, 5310 CrossRef CAS PubMed.
- H. Sun, C. A. Hunter, C. Navarro and S. Turega, J. Am. Chem. Soc., 2013, 135, 13129 CrossRef CAS PubMed.
- J. Pospisil and M. Potacek, Tetrahedron, 2007, 63, 337 CrossRef CAS PubMed.
- C. A. Hunter, M. C. Misuraca and S. M. Turega, J. Am. Chem. Soc., 2011, 133, 20416 Search PubMed.
- H. Adams, E. Chekmeneva, C. A. Hunter, M. C. Misuraca, C. Navarro and S. M. Turega, J. Am. Chem. Soc., 2013, 135, 1853 CrossRef CAS PubMed.
- C. A. Hunter, M. C. Misuraca and S. M. Turega, Chem. Sci., 2012, 3, 589 RSC.
Footnote |
| † Electronic supplementary information (ESI) available. See DOI: 10.1039/c5ob00231a |
|
| This journal is © The Royal Society of Chemistry 2015 |
Click here to see how this site uses Cookies. View our privacy policy here. 
 Open Access Article
 This Open Access Article is licensed under a