 Open Access Article
Creative Commons Attribution 3.0 Unported Licence
Size- and shape-dependent phase diagram of In–Sb nano-alloys
Masoomeh
Ghasemi
*a,
Zeila
Zanolli
bc,
Martin
Stankovski
d and
Jonas
Johansson
a
aSolid State Physics, Lund University, Box 118, SE-22100 Lund, Sweden. E-mail: masoomeh.ghasemi@ftf.lth.se
bPeter Grünberg Institute (PGI-1) & Institute for Advanced Simulation (IAS-1), Forschungszentrun Jülich, 52425 Jülich, Germany
cEuropean Theoretical Spectroscopy Facility (ETSF), Germany
dLU Open Innovation Center, Lund University, Box 117, SE-22100 Lund, Sweden
First published on 28th September 2015
Abstract
Nano-scale alloy systems with at least one dimension below 100 nm have different phase stabilities than those observed in the macro-scale systems due to a large surface to volume ratio. We have used the semi-empirical thermodynamic modelling, i.e. the CALPHAD method, to predict the phase equilibria of the In–Sb nano-scale systems as a function of size and shape. To calculate the size- and shape-dependent phase diagram of the In–Sb system, we have added size-dependent surface energy terms to the Gibbs energy expressions in the In–Sb thermodynamic database. We estimated the surface energies of the solution phases and of the InSb intermetallic phase using the Butler equation and DFT calculations, respectively. A melting point and eutectic point depression were observed for both nanoparticle and nanowire systems. The eutectic composition on the In-rich and Sb-rich sides of the phase diagram shifted towards higher solubility. We believe that the phase diagram of In–Sb nano-alloys is useful for an increased understanding of the growth parameters and mechanisms of InSb nanostructures.
1. Introduction
InSb is a direct band gap semiconductor with a small energy gap of 0.17 eV at 300 K (ref. 1) which makes it suitable for fabrication of mid-wave infrared detectors and lasers.2 The electronic band gap of InSb nanowires can be engineered as a function of nanowire radius since it exhibits a large excitonic Bohr radius of about 65 nm compared to other semiconductors.3 This property is useful for the fabrication of multispectrum photodetectors and multijunction solar cells.4 Moreover, InSb has the highest electron mobility among all semiconductor materials making it a promising candidate for applications in high-speed electronic devices.5 Recently, there has been a considerable attention towards the fabrication of InSb nanostructures6–10 because they have some advantages over bulk InSb, including high quality heterostructure growth with minimum defect density and precise control over the doping level. In this regard, we have studied the phase stability of the nano-scale In–Sb systems which is important for understanding the growth mechanism of InSb nanostructures.The focus of the current work is to study the phase equilibria of In–Sb nanoparticles and nanowires by calculating the size- and shape-dependent phase diagram of the In–Sb system using semi-empirical thermodynamic modelling, i.e. the CALPHAD (CALculation of PHAse Diagrams) method.11 CALPHAD is a powerful and well-established technique for predicting the bulk phase equilibria of multicomponent systems, but it can be extended to nano-scale systems by adding the size parameter to the bulk thermodynamic description. This kind of calculations are useful for modelling the growth process of nanostructures as it requires to take the surface effects arising from finite sizes of the system into account. As a result of a more accurate modelling of the fabrication process, less experimental attempts would be needed.
The CALPHAD approach can be used to predict the thermodynamic properties of alloy nanoparticles with a radius larger than 5 nm. Below this size, the average surface energy of the solid particles decreases due to the contribution of edges and vortices, hence, the CALPHAD method may not be applicable.12,13 Tanaka et al.13–15 extended the CALPHAD technique to predict the phase transitions of nano-scale systems. Later, Park and Lee16 developed an approach for calculating the phase diagram of nano-scale systems using available software for phase diagram calculations such as Thermo-Calc.17 This model was further improved and optimized for varying geometries by Lee and Sim18 and for systems containing intermetallic phases by Kroupa et al.,19 Bajaj et al.20 and Sim and Lee.21 There has also been some experimental studies19,22–24 on thermal analysis of nanoparticles to compare with the CALPHAD calculations, all showing a good agreement.
The phase diagram of a system within the CALPHAD method is obtained by defining the Gibbs energy terms for all phases. At constant temperature and pressure, the phase (or phases) with minimum Gibbs energy are the stable phases. In addition to the composition- and temperature-dependence, the Gibbs energy of a nano-scale phase is also a function of size. The size effect arises from the role of the surface energies which cannot be neglected for small systems. Therefore, one needs to add the surface energy contribution to the Gibbs energy expressions of the bulk system. To reach this goal, one should have the knowledge of the surface energy of all phases in a system. In this work, we have used a similar methodology as in ref. 19 and 20 to construct the size- and shape-dependent phase diagram of the In–Sb binary system. We have estimated the surface energies of liquid and solid solutions using the so called Butler equation25 and that of the InSb intermetallic phase using Density Functional Theory (DFT) calculations. Finally, we have calculated the phase diagram of In–Sb nanoparticles and nanowires as a function of their size.
2. Thermodynamic modelling
In this section, the thermodynamic equations for the size-dependent phase diagram of a binary A–B system based on the approach developed by Park and Lee16 and optimized later by Lee and Sim18 will be derived. The total Gibbs energy of a bulk phase† with A and B components can be expressed as: | (1) |
| GEx,Bulk = xAxB∑Lv(xA − xB)v (v = 0, 1, 2,…) | (2) |
Lv = a + bT + cT![[thin space (1/6-em)]](https://www.rsc.org/images/entities/char_2009.gif) ln ln![[thin space (1/6-em)]](https://www.rsc.org/images/entities/char_2009.gif) T + … T + … | (3) |
The total Gibbs energy of a nano-particle also has a contribution of the surface energy due to its high surface to volume ratio:‡
 | (4) |
The surface contribution to the Gibbs energy, GSurface, of an isotropic spherical particle and a nanowire (see Appendix A and ref. 18), respectively, are:
 | (5) |
 | (6) |
It is worth mentioning that if the aspect ratio of the nanowires (i.e. length to radius ratio) is low as discussed by Goswami and Nanda,26 the contribution of the length should also be considered in GSurface for the cylinder case. However, the assumption of the infinite length in our work is due to the fact that usually nanowires are grown in a few thousands of nanometers of length and a few tens of nanometers in diameter.
It is assumed that the excess Gibbs energy of an alloy nano-particle, GEx,nano, has the same form as eqn (2):16
| GEx,nano = xAxB∑Lvnano(xA − xB)v (v = 0, 1, 2,…) | (7) |
The term Lvnano can be expressed as:
 | (8) |
The interaction parameter will then have the following form:
 | (9) |
To find the size-dependent interaction parameters, one needs the molar volume and the surface tension of the alloy. Assuming that the excess volume is negligible, the molar volume of the alloy can be determined from the pure elements as follows:
| Valloy = xAVA + xBVB | (10) |
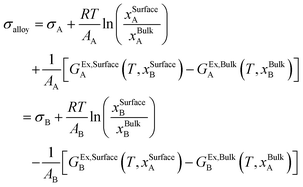
The surface tension of the alloy can be calculated using the Butler equation:25
 | (11) |
The Butler equation assume equilibrium between the bulk phase and a hypothetical surface phase. In eqn (11), σi is the surface tension of the pure components (A or B) in the solution phase. GEx,Surfacei and GEx,Bulki are the partial excess Gibbs energy of component i in the surface phase and the bulk phase, respectively. GEx,Bulki (T, xBulki) can be obtained from the thermodynamic database. Using the Yeum's model,27GEx,Surfacei (T, xSurfacej) can be obtained by replacing xBulkj by xSurfacej in GEx,Bulki and multiplying it by a constant, β:
| GEx,Surfacei (T, xSurfacej) = β × GEx,Bulki (T, xSurfacej) | (12) |
| σiAi = (1 − βpure)ΔHi | (13) |
A i is the molar surface area of one monolayer of pure i and can be obtained from:
| Ai = 1.091N01/3Vi2/3 | (14) |
3. First-principles calculations
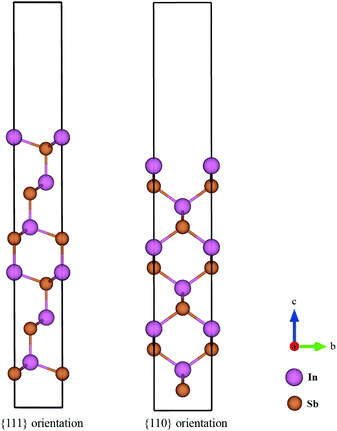
The surface energies of facets of the compound InSb were calculated from first-principles using the slab model. The total energy of a six-layer slab in either the {111} or the {110} orientation (see Fig. 1 and Appendix B) was calculated using the Abinit package29 within the local density approximation (LDA).30 The projector-augmented-wave (PAW) method was used to describe the interaction of the electrons with the ionic cores.31 The slabs were periodic in the direction parallel to the interface. In the direction perpendicular to the interface, vacuum layers corresponding to 3 InSb layers (about 11 Å) and 4 InSb layers (about 13 Å) were considered for {111} and {110}, respectively. The first Brillouin zone integration was performed over an 8 × 8 × 1 k-point mesh. The wave functions were expanded in a plane-wave basis set with the cut-off energy of 544 eV. Since bulk InSb is metallic in the LDA, a broadening factor of 0.27 eV was used to facilitate the convergence of the total energies.The total energy of the six-layer slab in the 〈111〉 direction converged with the error of about 0.06 eV per number of layers. The maximum force on atoms after relaxation was 7.13 × 10⁻⁴ eV Å−1. The maximum stress in a and b directions of the cell was 2.28 × 10⁻² GPa and in c direction it was 6.03 × 10⁻³ GPa. The error in the total energy of the six-layer slab in 〈110〉 direction was about 0.1 eV per layer. This ensured the maximum force on the relaxed atoms to be 5.44 × 10⁻⁴ eV Å−1 and the maximum stress 1.27 × 10⁻¹, 5.33 × 10⁻¹ and 2.51 × 10⁻³ GPa in the a, b and c cell axes.
The total energy of the fully relaxed slabs, Etotal, was calculated using the above set of converged parameters. The surface energy of the slabs in the {111} and the {110} orientation was determined from the total energies of the relaxed slabs as follows:
 | (15) |
The {110} slab is nonpolar and consists of two equivalent stoichiometric surfaces. Therefore, the surface energy of this facet is simply the average of the energy of the top and the bottom surfaces. However, the polar {111} surface has two inequivalent terminations; In-terminated and Sb-terminated surfaces. The surface energy of the {111} face is estimated to be the average of the top and bottom surface energies. This approach has been chosen following the discussions by Moll et al.32 and by Holec and Mayrhofer.33 In the former work, it is stated that different terminations of non-reconstructed and relaxed {111} surfaces of GaAs are energetically similar. In the latter study, the surface energy of different allotropes of AlN have been calculated and it has been discussed that since the Al- and N- terminated {111} surfaces have slightly different surface energies, it is reasonable to use the average energy of the top and the bottom surfaces.
It is worth mentioning that for determining the interaction parameters (see eqn (9)) of the (Sb) solid solution phase which dissolves some amount of In, the molar volume of In in the Rhombohedral structure is needed. This property was also computed from first-principles using the same parameters as for slab calculations, except for the k-mesh which was 8 × 8 × 8 in this case.
4. Results
4.1. Size-dependent melting point of indium
The correction factor, C, of pure indium is determined by fitting the calculated melting points to measured values. The melting points are obtained from the intersection of Gibbs energy curves of liquid and solid phases. The Gibbs energy of a spherical nanoparticle and a nanowire are the sum of the Gibbs energy of the element in the bulk (G0,Bulki) and the surface energy contribution as in eqn (5) and (6), respectively. The correction factor for the liquid phase is assumed to be unity.12 The melting point of indium nanoparticles as a function of size has been measured by several authors.38–40 Since in Zhang et al.,40 the melting point of In nanoparticles were obtained by direct calorimetric measurements, a fit to their experimental data (considering the experimental standard deviation) was used to determine the correction factor C = 0.975 as shown in Fig. 2a. In a recent study, the size-dependent melting points of In nanowires have been measured by Xu et al.41 which we reproduced by the correction factor C = 1 as shown in Fig. 2b.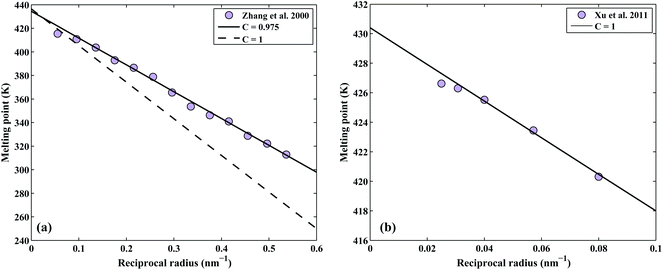 | ||
| Fig. 2 Determination of the correction factor, C, for the pure In (a) nanoparticles and (b) nanowires. | ||
4.2. Surface energy contribution to the Gibbs energy
In order to construct the size-dependent phase diagram of the In–Sb system, the Gibbs energy of all constituting elements and all phases should include the surface energy term. This requires the knowledge of the surface energy and of the molar volume of pure i, σi and Vi, respectively (Table 1). In the case of pure elements, the additional surface term is as in eqn (5) for a spherical nanoparticle and eqn (6) for a nanowire. They will be added to the Gibbs energy terms of bulk pure elements which are taken from the SGTE database.42| Properties | Equations | Ref. |
|---|---|---|
| Surface energy (N m−1) | σ L In = 0.556 − 0.9 × 10⁻⁴ (T − 429.75) | 34 |
| σ S In = 0.69 − 1.2 × 10⁻⁴T | 35 | |
| σ L Sb = 0.367 − 0.5 × 10⁻⁴ (T − 903.8) | 34 | |
| σ S Sb = 0.68 − 1.0 × 10⁻⁴T | 35 | |
| σ S InSb{111} = 0.87 − 1.1 × 10⁻⁴T | This work | |
| σ S InSb{110} = 1.18 − 1.1 × 10⁻⁴T | This work | |
| Molar volume (m3 mol−1) | V L In = 1.63 × 10 − 5 × (1 + 9.7 × 10⁻⁵ × (T − 429.75)) | 34 |
| V S In,tetra = 1.5707 × 10⁻⁵ | 36 | |
| V L Sb = 1.88 × 10−5 × (1 + 1.3 × 10⁻⁴ × (T − 903.8)) | 34 | |
| V S Sb,Rhombo = 1.819 × 10⁻⁵ | 36 | |
| V S In,Rhombo = 1.7967 × 10⁻⁵ | This work | |
| V S InSb = 2.04782 × 10⁻⁵ | 37 |
There are two solution phases in the In–Sb binary system, liquid and (Sb), and one intermetallic phase, InSb. To the best of our knowledge, there is no experimental data on the surface energy of In–Sb liquid and solid alloys and the InSb intermetallic compound.
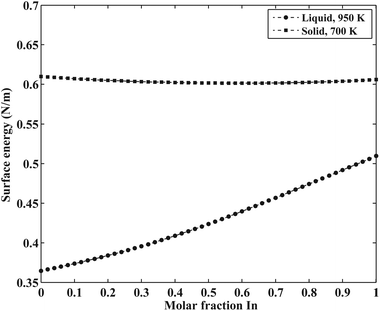
The surface energy of the liquid phase was estimated using the Butler equation (eqn (11)). The excess bulk partial Gibbs energies of the In–Sb system are taken from the work by Ansara et al.43 The calculated surface energy of In–Sb liquid alloys as a function of bulk composition is illustrated in Fig. 3.
As is also discussed by Sim and Lee,19 the surface energy of solid solution phases can be estimated using the Butler equation in a similar way as for the liquid phase. Antimony is stable in the Rhombohedral structure. Therefore, in order to calculate the surface energy of the (Sb) phase, the pure elemental In should also be considered in the same structure. Because In is not stable in the Rhomobohedral phase, the molar volume of In in the Rhombohedral structure (VSIn,Rhombo) was calculated using DFT to be 1.7967 × 10⁻⁵ m3 mol−1. The surface energy of the solid Rhombohedral phase (shown in Fig. 3) reveals a small composition dependency.
The excess Gibbs energy of the liquid and (Sb) solid solution phases were determined by adjusting the coefficients a′, b′ and c′ in eqn (9). To do this, an overdetermied system of equations as in eqn (16) was solved using the least-square fitting.
 | (16) |
The surface energy of the InSb intermetallic phase was obtained from DFT. The calculated energy of the {111} and {110} surfaces are 0.87 and 1.18 N m−1, respectively. We calculate the In–Sb size-dependent phase diagram for these two cases based on the following justifications. According to studies on the morphology of InSb nanostructures, the {111} InSb facets have the lowest surface energy. Zhou et al.6 showed that upon the deposition of InSb nanoparticles at room temperature, they crystallize in triangular shapes indicative of forming {111} facets with the lowest surface energy. However, they discussed that if the kinetics take over, the {110} facets with the slower growth rates would also appear and eventually, hexagonal nanostructures with {111} top facet and {110} side facets would form.
Lin et al.7 studied the selective area growth of InSb nanocrystals on a patterned InAs substrate using metal–organic vapor phase epitaxy. They observed that the selective area growth of InSb would result in nanocrystals with {111} side facets. However, by tuning the growth conditions, the growth switched to In-seeded growth resulting in nanowires with {110} side facets. A similar morphology of InSb nanorods and nanowires is also shown by Zhou et al.6 and Caroff et al.8 Therefore, we assume that the relevant surface energy for InSb nanoparticles is the energy of the {111} surface and that of InSb nanowires is the energy of the {110} surface. However, for comparison, we will calculate the phase diagrams of nanoparticles and nanowire using both {111} and {110} surface energies.
Last but not least, the temperature dependence of the surface energy of InSb was assumed to be the average of the temperature dependence of the surface energies of pure In and Sb.
4.3. Size-dependent phase diagram of the In–Sb system
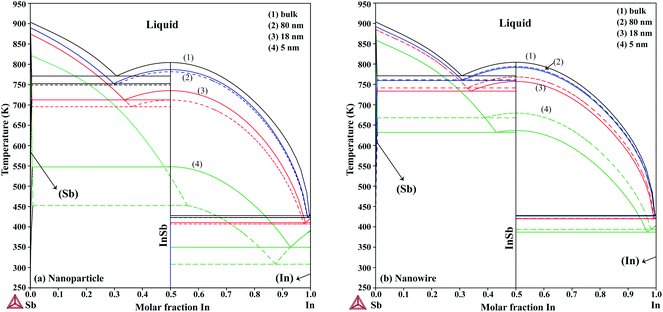
The re-assessed Gibbs energies of pure elements and the interaction parameters of the liquid and solid phases (eqn (5)) are listed in Table 4 in Appendix C (only for nanoparticles).The phase diagrams of nanoparticles and nanowires, calculated with the Thermo-Calc software17 using the re-assessed Gibbs energies and interaction parameters for varying radii, are presented in Fig. 4a and b, respectively. The phase diagram of the bulk is also shown. In both cases, the phase diagrams are calculated for InSb{111} and InSb{110} surface energies. The solid lines are the phase diagrams for the relevant surface energy, that is the surface energy of the {111} face for spherical nanoparticles and that of the {110} face for nanowires. The dashed lines in Fig. 4a are the phase diagram for nanoparticles with {110} surface energy. In Fig. 4b, the dashed lines are the phase diagrams of nanowires with {111} surface energy of the InSb phase.
5. Discussion
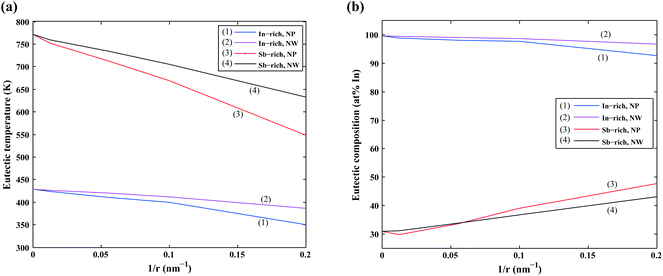
We first focus on the size effect of the In–Sb phase diagram. In Table 2, the shifts in the melting point of InSb and eutectic temperatures and compositions for different sizes of nanoparticles and nanowires are listed. The melting point of InSb nanoparticles decreases by about 17.4, 69.3 and 256.5 K with respect to the bulk melting point for particles with radius 80, 18 and 5 nm (see also Fig. 4a). Both the In- and the Sb-rich eutectic temperatures also decrease as a function of size, for the assumed relevant surface energy of InSb (see also Fig. 5). The calculated phase diagram of nanoparticles for InSb{110} surface energy shows a larger decrease of the liquidus and phase transition temperatures with the largest deviation for 5 nm particles comparing to the one calculated using the InSb{111} surface energy. In this case, the InSb phase no longer melts congruently. Instead it decomposes through a peritectic reaction at 452 K. Fig. 5 and the phase diagrams in Fig. 4a and also show a change in the eutectic composition on both In- and Sb-rich sides. The In-rich eutectic composition shifts towards higher In content. The Sb-rich eutectic composition follows the same trend except for 80 nm particles where Sb solves about 1.00 at% less In compared to the bulk.| Radius (nm) | Melting point of InSb | In-rich eutectic | Sb-rich eutectic | |||
|---|---|---|---|---|---|---|
| T (K) | In at% | T (K) | In at% | T (K) | ||
| Bulk | 804.5 | 99.6 | 428.1 | 30.8 | 771.2 | |
| Nanoparticles | 80 | 787.1 | 99.0 | 423.3 | 29.8 | 752.6 |
| 18 | 735.2 | 98.2 | 410.8 | 33.6 | 712.5 | |
| 5 | 548.0 | 92.8 | 349.8 | 47.8 | 547.6 | |
| Nanowires | 80 | 791.8 | 99.5 | 426.7 | 31.1 | 759.7 |
| 18 | 757.3 | 99.2 | 419.9 | 33.8 | 733.6 | |
| 5 | 636.7 | 96.8 | 386.9 | 43.0 | 632.3 | |
As can be inferred from eqn (5) and (6), the surface energy contribution of nanowires to the Gibbs energy is half of the contribution of nanoparticles. Therefore, a less prominent decrease in liquidus and eutectic temperatures with decreasing size is expected for nanowires. The phase diagram of nanowires with their relevant InSb surface energy, i.e. InSb{110}, shows that the melting point of InSb phase decreases to 791.8, 757.3 and 636.7 K for nanowires with radii of 80, 18 and 5 nm, respectively, comparing to the bulk melting point of 804.5 K (Fig. 4). The eutectic temperatures also decrease as a function of size. The solubility of In (Sb) in Sb (In) at eutectic temperature increases with decreasing of the radius.
Recently, there has been a few attempts to grow InSb nanowires without using foreign seed particles (usually Au particles). It has been shown that self-seeded InSb nanowires can be grown using either In7,9,10,44 or Sb seed particles,10 by keeping In- and Sb-rich conditions during the growth, respectively. Pendyala et al.10 discussed that if the growth conditions operate close to the In-rich eutectic in the In–Sb phase diagram, In-seeded InSb nanowires can be grown. Operating close to the Sb-rich eutectic would result, instead, in growing Sb-seeded InSb nanowires. We believe that the size-dependent In–Sb phase diagram can be useful in understanding the growth mechanism of self-seeded InSb nanowires as well as the thermodynamics of InSb nanoparticles.
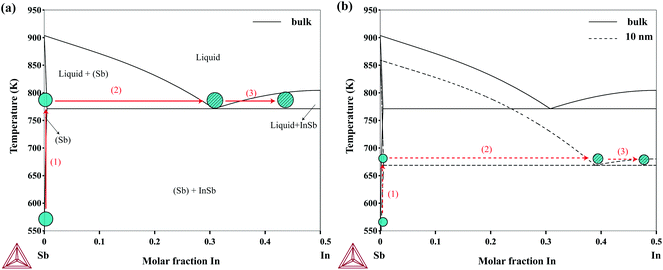
The most common nanowire growth mechanism is the Vapor–Liquid–Solid (VLS) growth.45 In this mechanism, the gas-phase nanowire materials (usually metal–organic sources) dissolve into the solid seed particles and form a liquid alloy according to the phase diagram. Once the particles are supersaturated, solid nanowires begin to crystallize from the particles. As an example of the application of the size-dependent In–Sb phase diagram, the nucleation process of Sb-seeded InSb nanowires in connection to the phase diagram is illustrated in Fig. 6. The growth of InSb nanowires using the Sb particles has been demonstrated by Pendyala et al.10 The nucleation from two particles, a large particle which resembles the bulk and a particle with 10 nm in radius, are compared in the figure. As the size decreases, the Sb-rich eutectic point decreases while the solubility of In in Sb increases. This would eventually lead to a delayed nucleation if the temperature is high enough for decomposition of the metal–organic sources.
As presented here, the size-dependent phase diagrams can be calculated by adding the surface energy terms to a thermodynamic databases. However, there are a few considerations that should be taken into account with this regard. One important point to consider is that to determine the correction factor, C, there should be reliable experimental data on the melting point of pure elements (or stoichiometric compounds) as a function of size. In the current assessment, there was no experimental data on the melting point depression of pure Sb nanoparticles/nanowires, therefore one cannot be sure that the reproduced melting points of Sb are in accordance with measured temperatures. On the other hand, there are a few studies on measuring the melting point depression of pure In.38–40 However, the measured temperatures can be reproduced with different correction factors. For instance, the experimental melting points of In nanoparticles by Coombes38 can be reproduced by C = 1 whereas, as it was shown in Section 4.1, the measured temperatures by Zhang et al.40 were reproduced by C = 0.975. We have used the data by Zhang et al. because the melting points were measured through direct calorimetry measurements, whereas Coombes38 and Skripov et al.39 have used diffraction techniques for the experiments.
Another point that should be taken into account is the fact that the calculations are also sensitive to the choice of surface energies of pure elements and other phases. For example, there are different expressions for the surface energy of pure components in liquid phase according to different references.34,36,46,47 The calculated surface energy using each expression through the Butler equation would result in slightly different composition-dependent surface energies of the liquid alloys. Thus, one should not fully trust the calculated surface energies of the alloys when there is no experimental data to compare with. Our intention in the current work was to use the surface energy expressions of pure In and Sb in liquid and solid phases from the same reference, hence those reported in ref. 34 and 35 were used respectively.
In summary, we have calculated the phase diagram of In–Sb nanoparticles/nanowire for varying radii using the CALPHAD method. The surface energy of the solution phases, liquid and (Sb), were estimated using the Butler equation. The surface energy of the InSb intermetallic phase was calculated using DFT. There is a shift in the liquidus and eutectic temperatures towards lower temperatures for both nanoparticle and nanowire phase diagrams, the latter being less prominent. The eutectic solubilities of In in Sb and Sb in In increase with a decrease in size of the nanoparticle/nanowire.
Appendix A. Thermodynamic equations
The Gibbs energy, G, of a bulk system is expressed in terms of independent variables, temperature (T), pressure (P) and number of moles (n):| G = G(T, P, ni) | (17) |
The differential form is:
 | (18) |
 | (19) |
| A = 4πr2 | (20) |
 | (21) |
The surface and volume change are given by:
| dA = 8πrdr | (22) |
| dV = 4πr2dr | (23) |
Combining eqn (22) and (23), we have:
 | (24) |
Assuming that the excess volume is negligible, eqn (24) becomes:
 | (25) |
Inserting eqn (24) into eqn (19), we obtain:
 | (26) |
Correspondingly, the chemical potential of the spherical nanoparticle is:
 | (27) |
The surface area and the volume of a nanowire can be written as:
| A = 2πr2 + 2πrl | (28) |
| V = πr2l | (29) |
| dA = 2πldr | (30) |
| dV = 2πrldr | (31) |
The chemical potential of a nanowire can then be expressed by:
 | (32) |
Appendix B. DFT calculations
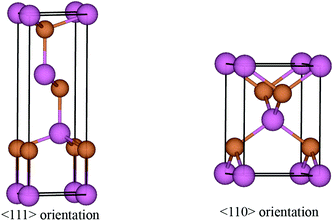
The primitive unit cells of InSb in 〈111〉 and 〈110〉 directions are shown in Fig. 7. The corresponding unit cell vectors and fractional coordinates of atoms are listed in Table 3.Appendix C. Thermodynamic database
Acknowledgements
We gratefully acknowledge financial support from the Nanometer Structure Consortium at Lund University (nmC@LU), the Swedish Research Council (VR), and the Knut and Alice Wallenberg Foundation (KAW). Zeila Zanolli acknowledges EC support under Marie-Curiefellowship (PIEF-Ga-2011-300036).References
- I. Vurgaftman, J. R. Meyer and L. R. Ram-Mohan, J. Appl. Phys., 2001, 89, 5815–5875 CrossRef CAS PubMed.
- E. Michel, J. Xu, J. D. Kim, I. Ferguson and M. Razeghi, IEEE Photonics Technol. Lett., 1996, 8, 673–675 CrossRef.
- H. Chen, X. Sun, K. W. C. Lai, M. Meyyappan and N. Xi, Nanotechnol. Mater. Devices Conf., 2009, 212–216 Search PubMed.
- K. W. C. Lai, N. Xi, C. K. M. Fung and H. Chen, Nano Optoelectronic Sensors and Devices, William Andrew Publishing, 2012 Search PubMed.
- T. Ashley, A. B. Dean, C. T. Elliott, G. J. Pryce, A. D. Johnson and H. Willis, Appl. Phys. Lett., 1995, 66, 481–483 CrossRef CAS PubMed.
- J. F. Zhou, Z. Chen, L. B. He, C. H. Xu, L. Yang, M. Han and G. H. Wang, Eur. Phys. J. D, 2007, 43, 283–286 CrossRef CAS PubMed.
- A. Lin, J. N. Shapiro, H. Eisele and D. L. Huffaker, Adv. Funct. Mater., 2014, 24, 4311–4316 CrossRef CAS PubMed.
- P. Caroff, M. E. Messing, B. M. Borg, K. A. Dick, K. Deppert and W. L-E, Nanotechnology, 2009, 20, 495606 CrossRef PubMed.
- S. Vaddiraju, M. K. Sunkara, A. H. Chin, C. Z. Ning, G. R. Dholakia and M. Meyyappan, J. Phys. Chem. C, 2007, 111, 7339–7347 CAS.
- C. Pendyala, S. Vaddiraju, J. H. Kim, J. Jacinski, H. Chen and M. K. Sunkara, Semicond. Sci. Technol., 2010, 25, 024014 CrossRef.
- L. Kaufman and H. Bernstein, Computer Calculations of Phase Diagrams, Academic Press, New York, 1970 Search PubMed.
- J. Lee, T. Tanaka, J. Lee and H. Mori, CALPHAD, 2007, 31, 105–111 CrossRef CAS PubMed.
- T. Tanaka and H. Shigeta, Z. Metallkd., 2001, 92, 467–472 CAS.
- T. Tanaka, K. Hack and S. Hara, MRS Bull., 1999, 24, 45–51 CAS.
- T. Tanaka and H. Shigeta, Z. Metallkd., 2001, 92, 1236–1241 CAS.
- J. Park and J. Lee, CALPHAD., 2008, 32, 135–141 CrossRef CAS PubMed.
- J. O. Andersson, T. Helander, L. Höglund, P. Shi and B. Sundman, CALPHAD, 2002, 26, 273–312 CrossRef CAS.
- J. Lee and K. J. Sim, CALPHAD, 2014, 44, 129–132 CrossRef CAS PubMed.
- A. Kroupa, T. Káňa, J. Bursik, A. Zemanová and M. Sob, Phys. Chem. Chem. Phys., 2015 10.1039/C5CP00281H.
- S. Bajaj, M. G. Haverty, R. Arróyave, W. A. Goddard III FRSC and S. Shankar, Nanoscale, 2015, 7, 9868–9877 RSC.
- K. Sim and J. Lee, J. Alloys Compd., 2014, 590, 140–146 CrossRef CAS PubMed.
- T. T. Bao, Y. Kim, J. Lee and J.-G. Lee, Mater. Trans., 2010, 51, 2145–2149 CrossRef CAS.
- J. Sopousek, J. Vrestal, J. Pinkas, P. Broz, J. Bursik, A. Styskalik, D. Skoda, O. Zobac and J. Lee, CALPHAD, 2014, 45, 33–39 CrossRef CAS PubMed.
- A. Roshanghias, J. Vrestal, A. Yakymovych, K. W. Richter and H. Ipser, CALPHAD, 2015, 49, 101–109 CrossRef CAS PubMed.
- J. A. V. Butler, Proc. R. Soc. A, 1932, 135, 348–375 CrossRef CAS.
- G. K. Goswami and K. K. Nanda, J. Phys. Chem. C, 2010, 114, 14327–14331 CAS.
- K. S. Yeum, R. Speiser and D. R. Poirier, Metall. Trans. B, 1989, 20, 693–703 CrossRef.
- R. Picha, J. Vreštál and A. Kroupa, CALPHAD, 2004, 28, 141–146 CrossRef CAS PubMed.
- X. Gonze, B. Amadon, P. M. Anglade, J. M. Beuken, F. Bottin, P. Boulanger, F. Bruneval, D. Caliste, R. Caracas, M. Côté, T. Deutsch, L. Genovese, P. Ghosez, M. Giantomassi, S. Goedecker, D. R. Hamann, P. Hermet, F. Jollet, G. Jomard, S. Leroux, M. Mancini, S. Mazevet, M. J. T. Oliveira, G. Onida, Y. Pouillon, T. Rangel, G.-M. Rignanese, D. Sangalli, R. Shaltaf, M. Torrent, M. J. Verstraete, G. Zerah and J. W. Zwanziger, Comput. Phys. Commun., 2009, 180, 2582–2615 CrossRef CAS PubMed.
- J. P. Perdew and A. Zunger, Phys. Rev. B: Condens. Matter Mater. Phys., 1981, 23, 5048–5079 CrossRef CAS.
- M. Torrent, F. Jollet, F. Bottin, G. Zerah and X. Gonze, Comput. Mater. Sci., 2008, 42, 337–351 CrossRef CAS PubMed.
- N. Moll, A. Kley, E. Pehlke and M. Scheffler, Phys. Rev. B: Condens. Matter Mater. Phys., 1996, 54, 8844–8855 CrossRef CAS.
- D. Holec and P. H. Mayrhofer, Scr. Mater., 2012, 67, 760–762 CrossRef CAS PubMed.
- T. Iida and R. I. L. Guthrie, The physical properties of liquid metals, Clarendon Press, 1988 Search PubMed.
- J. A. Alonso and N. H. March, Electrons in Metals and Alloys, Academic Press, 1989 Search PubMed.
- Handbook of Chemistry and Physics, ed. D. R. Lide, CRC Press, 2004 Search PubMed.
- A. Declemy and P. O. Renault, Phys. Status Solidi A, 2007, 204, 1041–1046 CrossRef CAS PubMed.
- C. J. Coombes, J. Phys. F: Met. Phys., 1972, 2, 441 CrossRef CAS PubMed.
- V. P. Skripov, V. P. Koverda and V. N. Skokov, Phys. Status Solidi A, 1981, 66, 109–118 CrossRef CAS PubMed.
- M. Zhang, M. Y. Efremov, F. Schiettekatte, E. A. Olson, A. T. Kwan, S. L. Lai, T. Wisleder, J. E. Greene and L. H. Allen, Phys. Rev. B: Condens. Matter Mater. Phys., 2000, 62, 10548 CrossRef CAS.
- S. H. Xu, G. T. Fei, Y. Zhang, X. F. Li, Z. Jin and L. D. Zhang, Phys. Lett. A, 2011, 375, 1746–1750 CrossRef CAS PubMed.
- Updated from: A. T. Dinsdale, CALPHAD, 1991, 15, 317 CrossRef CAS.
- I. Ansara, C. Chatillon, H. L. Lukas, T. Nishizawa, H. Ohtani, K. Ishida, M. Hillert, B. Sundman, B. B. Argent, A. Watson, T. G. Chart and T. Anderson, CALPHAD, 1994, 18, 177–222 CrossRef.
- B. Mandl, K. A. Dick, D. Kriegner, M. Keplinger, G. Bauer, J. Stangl and K. Deppert, Nanotechnology, 2011, 22, 145603 CrossRef PubMed.
- R. S. Wagner and W. C. Ellis, Appl. Phys. Lett., 1964, 4, 89–90 CrossRef CAS PubMed.
- T. Tanaka, M. Nakamoto, R. Oguni, J. Lee and S. Hara, Z. Metallkd., 2004, 95, 818–822 CrossRef CAS.
- B. B. Alchagirov, R. K. Dadashev, F. F. Dyshekova and D. Z. Elimkhanov, Russ. J. Phys. Chem. A, 2013, 87, 890–894 CrossRef CAS.
Footnotes |
| † The bulk phase is the bulk of a material far from the surface. |
| ‡ The surface is assumed as a hypothetical phase with a Gibbs energy expression similar to the bulk. Therefore, the total Gibbs energy of a phase with finite boundaries, GTotal,nano, is the sum of the Gibbs energy of the bulk material, GBulk, and the Gibbs energy of the surface phase, GSurface. |
| This journal is © The Royal Society of Chemistry 2015 |


