
 Open Access Article
 This Open Access Article is licensed under a Creative Commons Attribution-Non Commercial 3.0 Unported Licence
Quenching of the upconversion luminescence of NaYF4:Yb3+,Er3+ and NaYF4:Yb3+,Tm3+ nanophosphors by water: the role of the sensitizer Yb3+ in non-radiative relaxation†
Riikka
Arppe
*a,
Iko
Hyppänen
b,
Niina
Perälä
a,
Riikka
Peltomaa
a,
Martin
Kaiser
c,
Christian
Würth
c,
Simon
Christ
ad,
Ute
Resch-Genger
c,
Michael
Schäferling
ac and
Tero
Soukka
a
aUniversity of Turku, Department of Biotechnology, 20014 Turun yliopisto, Turku, Finland. E-mail: riikka.arppe@utu.fi
bUniversity of Turku, Department of Chemistry, Laboratory of Materials Chemistry and Chemical Analysis, Vatselankatu 2, 20014 Turun yliopisto, Turku, Finland
cBAM Federal Institute of Materials Research and Testing, Division 1.10 Biophotonics, Richard-Willstätter-Str. 11, 12489 Berlin, Germany
dUniversity of Regensburg, Institute of Analytical Chemistry, Chemo- and Biosensors, 93040 Regensburg, Germany
First published on 16th June 2015
Abstract
We have studied the mechanisms of water-based quenching of the upconversion photoluminescence of upconverting nanophosphors (UCNPs) via luminescence decay measurements for a better understanding of the non-radiative deactivation pathways responsible for the relatively low upconversion luminescence efficiency in aqueous solutions. This included both upconversion luminescence measurements and the direct excitation of emissive energy states of Er3+ and Yb3+ dopants in NaYF4:Yb3+,Er3+ UCNPs by measuring the decays at 550 and 655 nm upon 380 nm excitation and at 980 nm upon 930 nm excitation, respectively. The luminescence intensities and decays were measured from both bare and silanized NaYF4:Yb3+,Er3+ and NaYF4:Yb3+,Tm3+ UCNPs in H2O and D2O. The measurements revealed up to 99.9% quenching of the upconversion photoluminescence intensity of both Er3+ and Tm3+ doped bare nanophosphors by water. Instead of the multiphonon relaxation of excited energy levels of the activators, the main mechanism of quenching was found to be the multiphonon deactivation of the Yb3+ sensitizer ion caused by OH-vibrations on the surface of the nanophosphor. Due to the nonlinear nature of upconversion, the quenching of Yb3+ has a higher order effect on the upconversion emission intensity with the efficient Yb–Yb energy migration in the ∼35 nm nanocrystals making the whole nanophosphor volume susceptible to surface quenching effects. The study underlines the need of efficient surface passivation for the use of UCNPs as labels in bioanalytical applications performed in aqueous solutions.
1. Introduction
Upconverting nanophosphors (UCNPs) have increasingly gathered interest in numerous applications. Decreasing the size of UCNPs to sub-10 nm levels while maintaining the strong luminescence intensity is a subject of intensive research for e.g. imaging purposes.1,2 However, the upconversion (UC) luminescence efficiency is known to be size-dependent due to decreasing number of emitting ions and increasing surface-to-volume ratio leading to more strongly emerging surface quenching effects.3–6 To overcome these limitations, the non-radiative deactivation channels and surface effects must be understood better. There has been discussion about whether the size-dependent luminescence originates from phonon-mediated energy transfer processes,4,7 surface effects related to high energy vibrations of ligands, surfactants3 and surrounding solvents5 containing OH- and CH-groups, or from increased surface defect density,5 or from a combination of these effects.For the use of UCNPs as reporters in bioanalytical assays and biological environments they must be rendered water dispersible. It is well known that water quenches the luminescence of lanthanides and also lanthanide doped nanocrystals.8,9 This is commonly ascribed to high energy vibrational modes of OH-groups (3200–3600 cm−1) which result in an increased non-radiative relaxation of the excited states.8 In Er3+ doped UCNPs, the OH-groups quench the luminescence of Er3+ ions by facilitating multiphonon relaxation of the 4I11/2 → 4I13/2 and 2H11/2/4S3/2 → 4F9/2 transitions (Fig. 1). Both relaxation pathways favor the population of the 4F9/2 state from which the red luminescence occurs at the expense of the green luminescence.8,10 The quenching mechanism of water has not yet been studied in detail for Tm3+ doped nanophosphors.6,11 Also Yb3+ has been reported to be quenched by water in molecular complexes and chelates.12,13
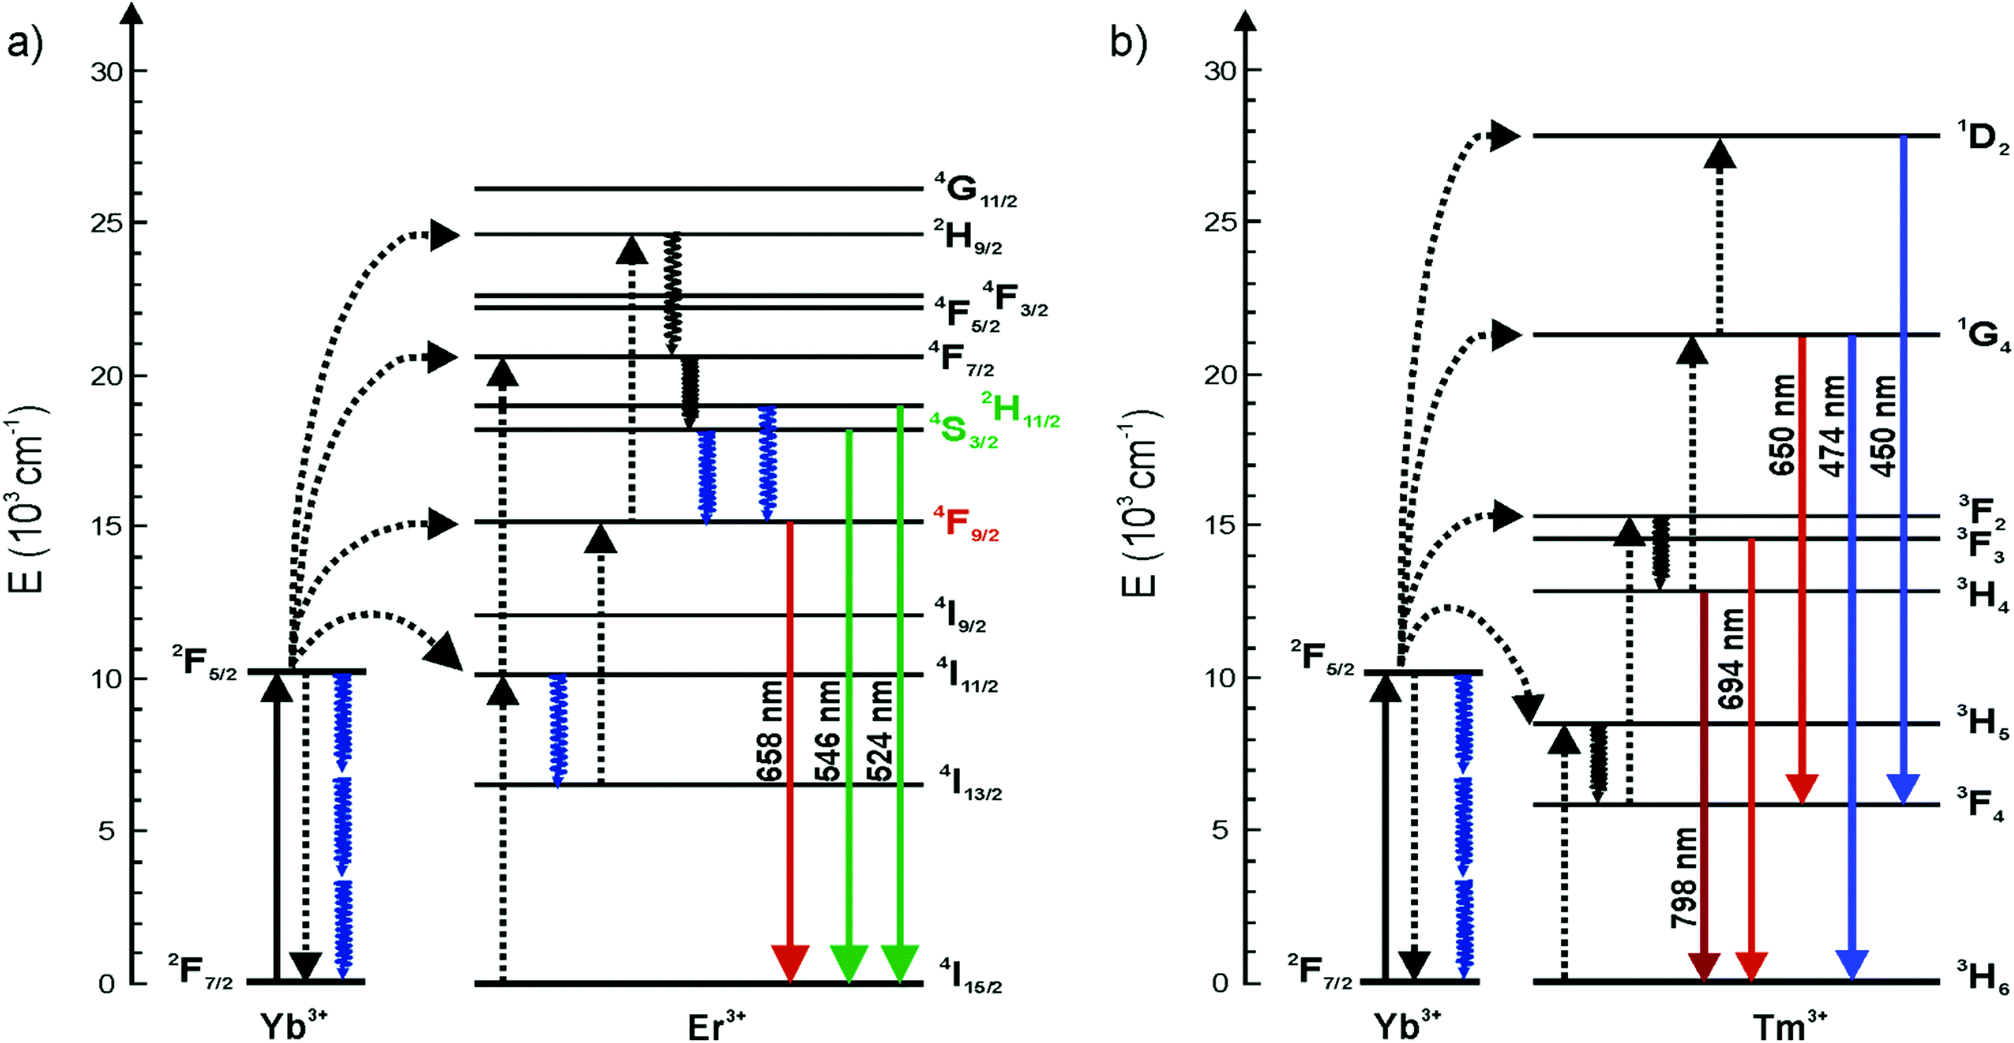 | ||
| Fig. 1 Energy level diagrams of (a) NaYF4:Yb3+,Er3+ and (b) NaYF4:Yb3+,Tm3+. Solid, dotted and wavy arrows represent photon absorption or emission, energy transfer and relaxation processes, respectively. The blue wavy arrows denote the increased multiphonon relaxations caused by OH-vibrations. | ||
Wang et al. (2010) showed that by covering the NaGdF4:Yb3+,Tm3+ core with a thin inactive NaGdF4 shell, the quenching effect of 20 vol% water decreased from 80% to 35% compared with the core material only.6 Also, an inactive NaYF4 shell has been reported to protect the luminescence of the core from surface-related quenching effects.14,15 Therefore, water molecules on the surface of the nanophosphor affect only the luminescent lanthanide dopants and the ions comprising the inactive shell or the host crystal are unaffected. The lanthanide ions inside the “core only” nanophosphors and those on the surface should show different emission intensities because the surface dopants are more prone to surface quenching effects.5,6 In theory, however, the excitation energy can travel via Yb–Yb energy migration from the core regions of an UCNP to the surface dopants where the energy is coupled with the vibrational modes of the environment.2,16,17 Gargas et al. suggested that the entire volume of their 8 nm nanophosphor was energetically coupled to the surface.2 Also Er–Er and Tm–Tm energy transfer may occur but is less probable, due to the very low concentration of the activators and thus a larger distance between two individual ions.
In addition, the absorption of 980 nm excitation light by water has been suggested to be involved in the decrease of upconversion luminescence intensity.18 The absorptivity of water at 980 nm is 0.485 cm−1.18,19 Thus, the transmission of light in a path length of 1 cm in water is 61.6%. Therefore, the energy of the excitation light is gradually attenuated which further affects the resulting upconversion emission intensity.
The rational design of bright UCNPs for bioanalytical applications performed in aqueous solutions encouraged us to systematically study the influence of water on the upconversion luminescence intensity and decay of NaYF4:Yb3+,Er3+ and NaYF4:Yb3+,Tm3+ nanophosphors. Furthermore, the effect of water on the intensity and decay of the directly excited (at 380 nm) luminescence of the Er3+ emission and on the luminescence decay at 980 nm upon 930 nm excitation originating from the sensitizer Yb3+ were studied. Also, comparative luminescence studies were performed in D2O to identify the luminescence deactivation pathways. In addition, because surface functionalization is required for biomolecule coupling, we studied the effect of a thick silica shell on the luminescence quenching by water.
2. Experimental
Materials
NaYF4:Yb3+,Er3+ (xYb = 0.17, xEr = 0.03) and NaYF4:Yb3+,Tm3+ (xYb = 0.20, xTm = 0.005) nanophosphors were synthesized in octadecene/oleic acid.20 Their size distribution was measured with transmission electron microscopy (TEM) and the crystal structure was studied with X-ray powder diffraction (XPD). The oleic acid (OA) capping was removed using a modified method of Bogdan et al.10: 20 mg of OA-capped UCNPs in toluene were recovered by centrifuging for 30 min, 16![[thin space (1/6-em)]](https://www.rsc.org/images/entities/char_2009.gif) 837g (Eppendorf Centrifuge 5418, Hamburg, Germany) and by removing the supernatant carefully by pipetting. The UCNP-pellet was redispersed into 1 ml of 0.1 M HCl (pH 1) by ultrasonication (Finnsonic m03, Finnsonic Oy, Lahti, Finland) and the acid wash was left to perform in rotation overnight. During the acid wash the OA-molecules coordinated to the lanthanides were protonated and thus disengaged from the surface of the UCNP. The UCNPs were precipitated by adding 500 μl of methanol and 150 μl of isopropanol and centrifuged as before. The UCNPs were washed once with 1 ml of toluene to remove the residue OA and then the bare UCNPs were dispersed to 100 μl of ethanol.
837g (Eppendorf Centrifuge 5418, Hamburg, Germany) and by removing the supernatant carefully by pipetting. The UCNP-pellet was redispersed into 1 ml of 0.1 M HCl (pH 1) by ultrasonication (Finnsonic m03, Finnsonic Oy, Lahti, Finland) and the acid wash was left to perform in rotation overnight. During the acid wash the OA-molecules coordinated to the lanthanides were protonated and thus disengaged from the surface of the UCNP. The UCNPs were precipitated by adding 500 μl of methanol and 150 μl of isopropanol and centrifuged as before. The UCNPs were washed once with 1 ml of toluene to remove the residue OA and then the bare UCNPs were dispersed to 100 μl of ethanol.
Both Er3+- and Tm3+-doped UCNPs were also surface-modified by a silanization with 60 μl of tetraethylorthosilicate (TEOS) using a reverse-microemulsion technique by Wilhelm et al.21 after which the UCNPs with silica shell were dispersed into 200 μl of ethanol. No functional groups were added to the silica.
Both bare and silanized UCNP-dispersions were divided into two and the ethanol was evaporated with MiVac centrifugal concentrator (Genevac Ltd Suffolk, UK). Then, the pellets were heated to 80 °C for overnight to remove all coordinated water and thereafter, dispersed into 500 μl of either ultrapure mQ-H2O or D2O (99.9% purity, Sigma-Aldrich, St. Louis, MO) and stored in rotation at room temperature. The absence of OA in the bare UCNPs was evaluated with FT-IR (Vertex 70, Bruker Optics, Billerica, MA). As a reference, the IR-spectrum of OA-capped UCNP was measured.
Luminescence lifetime measurements in the time domain
Luminescence lifetimes in the time domain were measured using three instruments: a modular luminometer with pulsed excitation (method 1), a modified multimode microtiter plate reader (method 2), and a commercial fluorometer equipped with a pulsed μ-flash xenon lamp and a phosphorescence accessory (method 3).In method 1, an analog-to-digital converter NI USB-6251 (National Instruments, Austin, TX) was used to generate square-wave excitation pulse profile for the laser driver WDL3343 (Wavelength Electronics, Inc., Bozeman, MT). The excitation source was a NIR laser diode L9418-04 (Hamamatsu Photonics, Hamamatsu City, Japan) providing max. 1.2 W at 976 nm. The optical part of the luminometer consisted of tubular excitation and emission chambers (Thorlabs, Inc., Newton, NJ) in a right-angle configuration. The sample chamber was an aluminum cube equipped with a Peltier element for thermoelectric cooling/heating and a 5 mm quartz NMR tube for liquid samples. In the excitation light path, a RG850 long-pass filter with a cutoff at 850 nm (Edmund Optics, Barrington, NJ) was used to ensure a pure NIR excitation. In the emission light path, an extended hot mirror filter (Edmund Optics) with a good transmission at visible wavelengths was used to exclude the scattered excitation radiation. A long-pass filter with a cutoff at 750 nm (Newport Spectra-Physics GmbH, Germany) was used to select the 800 nm emission of thulium. Other emissions wavelengths were selected with interference filters with a suitable band-pass, 544/10 nm, 650/10 nm (Thorlabs), 470/20 nm (Chroma Technology Corp., Bellows Falls, VT). The detector at the end of emission chamber was a head-on R1464 photomultiplier (Hamamatsu). The photomultiplier signal was amplified in a high-speed current amplifier DHPCA-100 (Femto Messtechnik GmbH, Germany). The amplified signal was recorded with the NI USB-6251 A/D converter, which was connected to a computer via USB and controlled with a computer program written in LabVIEW 8.5 (National Instruments). The pulse profile consisted of a 20 ms excitation pulse (1.2 W) followed by a 30 ms delay period. During a single measurement the pulse profile was cycled 10000 times resulting a measurement time of 8.5 minutes. Same settings and measurement times were used for all samples, and thus, there was no need for normalization.
In method 2, a modified Plate Chameleon fluorometer (Hidex Oy, Turku, Finland) equipped with a 980 nm laser diode as excitation source was used.22 The sample in 100 μl volume in clear Greiner polypropylene microtiter plate (Sigma-Aldrich) was repeatedly exposed to 2 ms excitation light pulses. The upconversion emission wavelengths were selected by optical band-pass filters 535/40 nm, 665/70 nm, 470/20 nm (Chroma Technology Corp.) or 795/5 nm (Edmund Optics). Neutral density filters were used to damp the obtained signals, when necessary. Same settings and measurement times were used for all samples, and thus, there was no need for normalization.
In method 3, the luminescence decay measurements were carried out with a commercial Edinburgh Instruments spectrofluorometer FSP-920 equipped with a μ-flash lamp 920H (pulse width 3 μs) and a red extended PMT (R2658P) from Hamamatsu. The Yb3+ luminescence band 2F5/2 → 2F7/2 was excited with 930 nm excitation and detected at 980 nm (slit width was set to 20 nm optical band width for both excitation and detection). The green 4S3/2 → 4I15/2 and red 4F9/2 → 4I15/2 Er3+ luminescence bands were excited at 378 nm and detected at 550/655 nm (slit width was set to 4 nm and 8 nm optical band width for excitation and detection, respectively), and a 400 nm long-pass was used to avoid detection of scattered excitation light. The decays of the directly excited luminescence of Er3+ dopants were normalized in respect to the highest obtained signal. The decays of directly excited luminescence of Yb3+ dopants were normalized to correspond a measurement time of 60 min.
For the method 1, an UCNP-concentration of 1 mg mL−1 was used. For the method 2, the concentration was 40–50 μg mL−1 and for the method 3, 40 mg mL−1 UCNP-concentration was used due to the low signal levels of the directly excited luminescence. The luminescence profiles were analyzed with the exponential decay fitting with Origin 8.0 (Originlab Corboration, Northampton, MA). Fittings of the decay profiles of the upconversion luminescence were started 50–200 μs after the excitation pulse was turned off.
Luminescence intensity and spectral measurements
The modified Plate Chameleon fluorometer was also used for measurement of upconversion photoluminescence intensity. The measurements were done at UCNP-concentration of 40 μg mL−1 or 2.2 μg mL−1 in 100 μl volume from clear polypropylene 96-well microtiter plates. A 2 s excitation pulse was used and the emission was measured simultaneously. A standard Plate Chameleon fluorometer with Xenon flash lamp as UV-light source (Hidex Oy) was used to measure the directly excited (at 380 nm) luminescence emission intensities of the NaYF4:Yb3+,Er3+ nanophosphors at 660 nm using 665/45 nm (Chroma Technology Corp.) and 365/50 nm (bk Interferenzoptik Elektronik GmbH, Nabburg, Germany) optical filters, respectively, with a 80 μs delay and a 420 μs measurement window.Upconversion emission spectra were measured at a UCNP-concentration of 1 mg ml−1 with a PC2000-CCD optical fiber spectrometer (Ocean Optics, Inc., Dunedin, FL). A laser diode driver 5060 (Newport, Irvine, CA) was used to control a fiber-coupled NIR laser diode IFC-975-008 (Optical Fiber Systems, Inc., Chelmsford, MA) providing 6 W at 973 nm. The optical part of the system was the same tubular chamber setup used in the lifetime measurement method 1, but without interference filters in the emission site. At the end of the emission chamber was an optical fiber connected to the PC2000 spectrometer. The OOIIrrad software was used to record the upconversion emission spectra. The spectral response of the system was calibrated with a tungsten halogen light source LS-1-CAL (Ocean Optics Inc.). The laser beam diameter was estimated to be ∼3 mm when focused on samples.
3. Results and discussion
The UCNPs were characterized with TEM, XPD and FT-IR. The NaYF4:Yb3+,Er3+ were rod-shaped with dimensions of 31–38 nm, and the NaYF4:Yb3+,Tm3+ nanophosphors were sphere-shaped and 29–32 nm in diameter (Fig. S1 in the ESI†). Their crystal structure was pure hexagonal according to the XPD-analysis (Fig. S2a in the ESI†). The FT-IR spectra were measured from oleic acid-capped and bare UCNPs to investigate the surface modification (Fig. S2b in the ESI†). The OA-capped UCNPs exhibited similar stretches reported by Cao et al.23 for OA-capped UCNPs: a multipeak band at ∼2925 and 2852 cm−1, which were assigned to the asymmetric and symmetric stretching vibrations of methylene (CH2) in the long alkyne chain of OA, and stretches at 1558, 1446 and 1421 cm−1, which were assigned to the asymmetric and symmetric stretching vibrations of the carboxylic group of the bound OA ligand. These vibrations were absent in the bare UCNPs, indicating the total removal of OA from the UCNP surface. The 7–10 nm silica shell was visualized with TEM (Fig. S1 in the ESI†). The bare and silanized UCNPs were used for the study of quenching mechanism of water.It has been reported that OH-groups quench the luminescence of NaYF4:Yb3+,Er3+ UCNPs by facilitating multiphonon relaxation of 2H11/2/4S3/2 → 4F9/2 and 4I11/2 → 4I13/2 transitions of Er3+-ions. Both of these relaxation pathways favor the population of the 4F9/2 state (either directly or via4I13/2 → 4F9/2 transition, respectively), from which the red luminescence occurs at the expense of green luminescence.8,10 Thus, the red-to-green luminescence ratio increases in the presence of water. This effect of the OH-vibrations was also confirmed here by measurement of upconversion luminescence spectra of both bare, i.e. without any ligand capping which was removed by acid washing,10 and silanized NaYF4:Yb3+,Er3+ nanophosphors in both D2O and H2O (Fig. 2). The red-to-green ratio increased from 1.6 in D2O to 2.4 in H2O with bare particles, and from 1.8 to 2.2 with silanized particles, respectively. The quenching efficiency of water, calculated using eqn (1), for the green upconversion emission of bare and silanized Er3+-doped particles by water was 86% and 85%, respectively.
 | (1) |
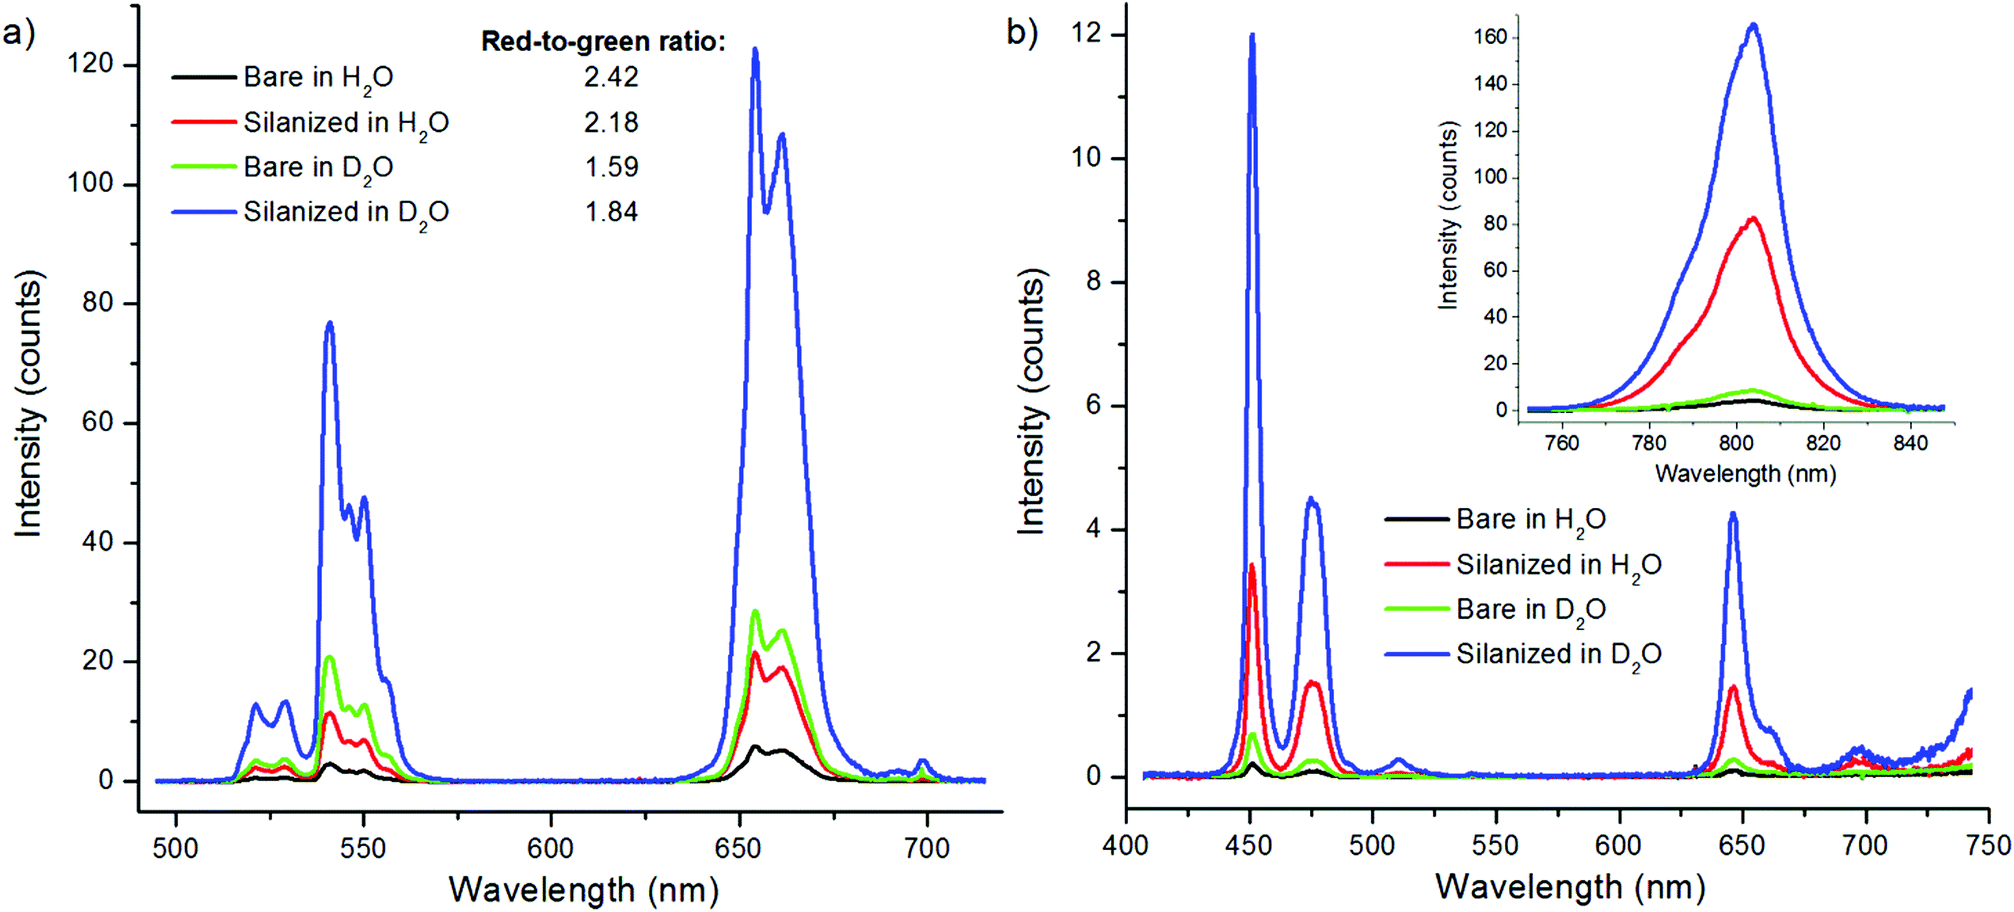 | ||
| Fig. 2 Upconversion luminescence spectra of both bare and silanized (a) NaYF4:Yb3+,Er3+ and (b) NaYF4:Yb3+,Tm3+ nanophosphors in H2O and D2O. | ||
The upconversion photoluminescence decays of both bare and silanized Er3+-doped nanophosphors in D2O and H2O were studied using method 1 (see Experimental). The resulting decay curves are illustrated in Fig. 3 and the lifetimes with amplitude fractions are listed in Table 1. The repetitiveness of the lifetime measurements was confirmed by measuring the upconversion luminescence decay of the same sample twice using method 1 (Fig. S3 in the ESI†). Similar intensity quenching to the spectral measurements is observed also in the intensity levels of the decay curves in water when compared with the intensity in D2O. The reduction in the luminescence intensity is reflected by the decay behavior, i.e., major changes in the lifetimes of the different emission peaks as well as in the respective decay amplitudes were observed when the two solvents were compared. In the presence of water the amplitude fraction of the shorter decay was reduced from that in D2O and the lifetime τ1 of green emission was shortened by 54%. The τ1 of the red emission was shortened by only 11%. Thus, the luminescence with the shorter decay probably originates from the surface of the nanophosphors which is most affected by the water molecules. However, also the longer lifetime τ2 at 544 nm was shortened by 25% by water, and a reduction of up to 41% was observed at 650 nm. Thus, it seems that most of the particle volume can be affected by surface quenchers.
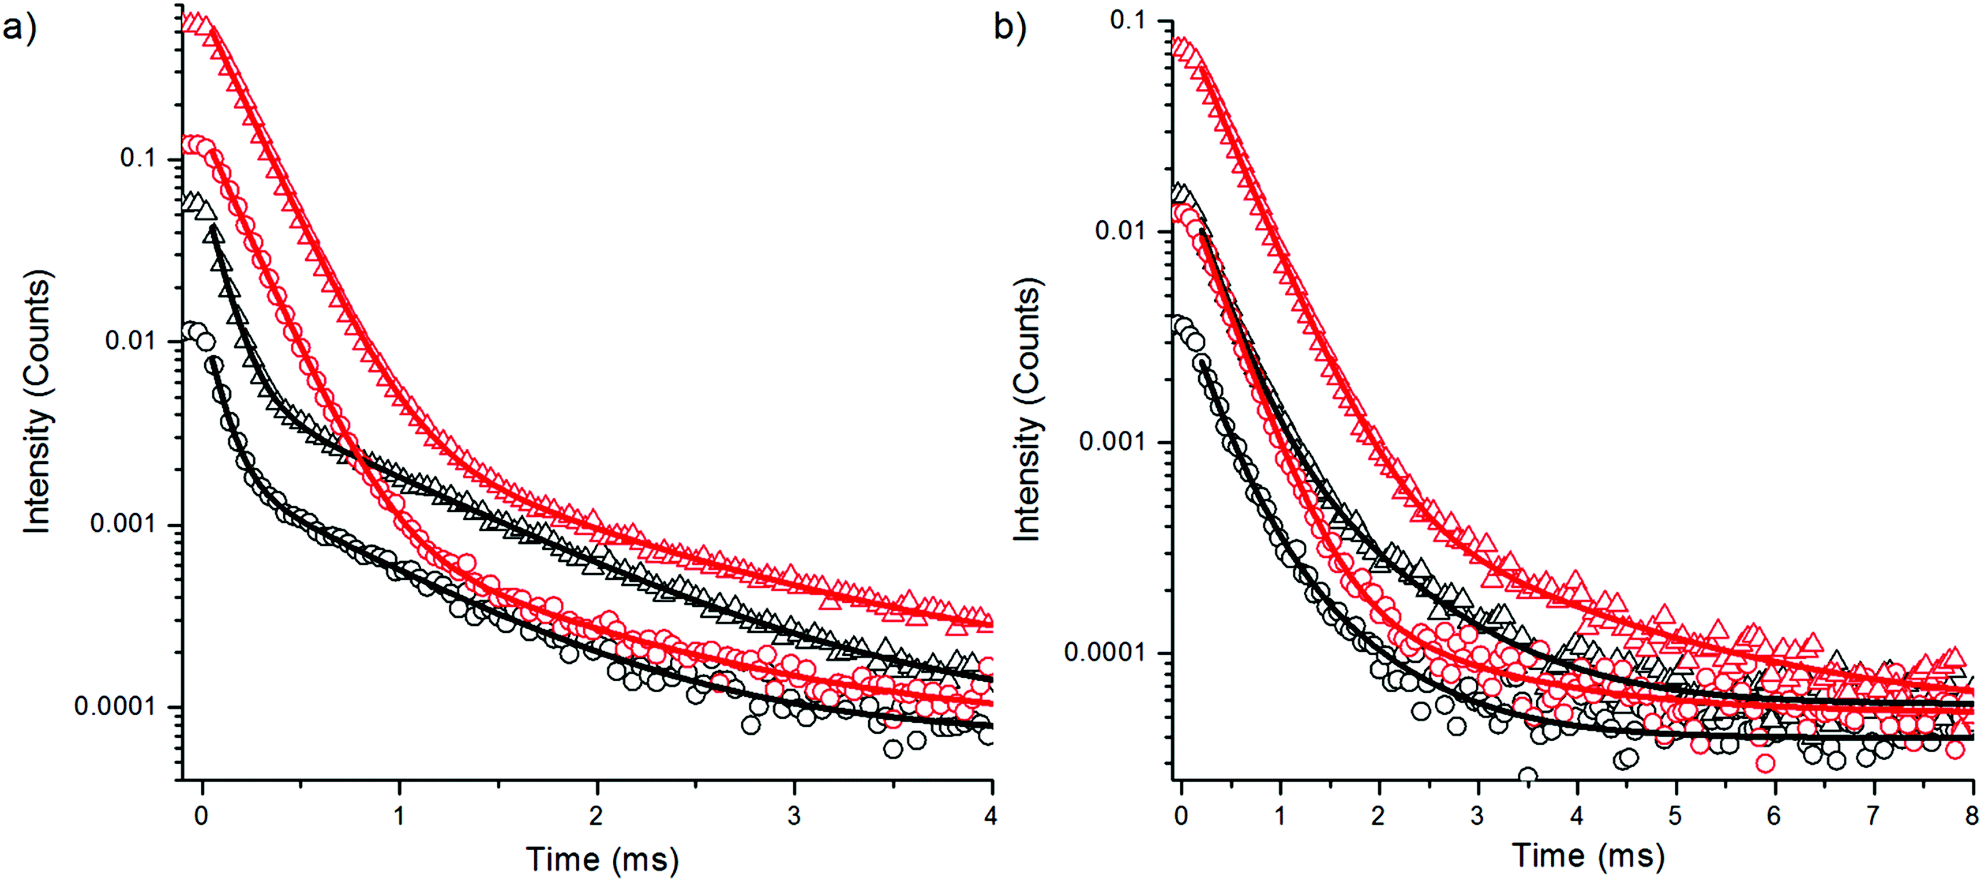 | ||
| Fig. 3 Decay curves of upconversion emission of bare (circles) and silanized (triangles) NaYF4:Yb3+,Er3+ in H2O (black) and D2O (red) (a) at 544 nm and (b) at 650 nm upon 980 nm excitation with 20 ms pulse width. | ||
| Bare in H2O | Bare in D2O | Silanized in H2O | Silanized in D2O | |
|---|---|---|---|---|
| 4S3/2 → 4I15/2 (green emission) | ||||
| τ 1 (μs) | 81 ± 1.5 (86.2%) | 177 ± 0.5 (99.1%) | 92 ± 0.5 (91.8%) | 185 ± 0.4 (99.2%) |
| τ 2 (μs) | 755 ± 10.8 (13.8%) | 1003 ± 55.0 (0.9%) | 843 ± 5.6 (8.2%) | 1070 ± 55 (0.8%) |
| 4F9/2 → 4I15/2 (red emission) | ||||
| τ 1 (μs) | 296 ± 10.8 (85.4%) | 334 ± 2.5 (98.4%) | 300 ± 3.8 (90.7%) | 383 ± 0.9 (99.0%) |
| τ 2 (μs) | 849 ± 47.3 (14.6%) | 1440 ± 129.3 (1.6%) | 966 ± 24.4 (9.3%) | 1862 ± 72.3 (1.0%) |
The upconversion decay time of the green emitting state 4S3/2 → 4I15/2 was shortened more by water than that of the red emitting state 4F9/2 → 4I15/2, which can be explained by the increased multiphonon relaxation 4S3/2 → 4F9/2. When an intermediate energy level is deactivated via OH-vibration, the emissive states become less populated, which leads to intensity quenching of upconversion emission. However, this should not affect the decay of the populated emissive states. Thus, the 54% decrease in the green luminescence lifetime originates only from the increased multiphonon relaxation 4S3/2 → 4F9/2 and the deactivation of 4I11/2 → 4I13/2 has no effect on the lifetime of the green emission. The decay time of red emitting state 4F9/2 → 4I15/2 was less affected by water and thus cannot explain the major intensity quenching of the red upconversion luminescence. The pH of the solvent had no effect on the upconversion photoluminescence intensities or lifetimes of bare NaYF4:Yb3+,Er3+ nanophosphors in the range of 3–7 (data not shown).
Surface modification of the nanophosphors via silanization provided little protection against the water. The lifetime reduction of the luminescence of silanized nanophosphors in H2O was similar to the bare particles when compared to the luminescence decays of silanized nanophosphors in D2O. The amplitude fraction of the main decay component increased in silanized nanophosphors in H2O, when compared to the corresponding fraction of bare particles. Thus, silica offered partial shielding against OH-vibrations but not enough to prevent the intensity quenching completely. The silica shell might be somewhat porous allowing the water molecules to reach the UCNP surface.
To further study the effect of OH-vibrations on the non-radiative relaxation of the excited states of bare NaYF4:Yb3+,Er3+ nanophosphors, we measured the luminescence decays of both 4S3/2 → 4I15/2 and 4F9/2 → 4I15/2 transitions by direct excitation with 380 nm radiation using method 3. Excitation populates the higher energy state 4G11/2 of Er3+ and the subsequent relaxations the emissive states. Thus, the measurement excluded all effects of lower-lying energy level relaxations. The decay curves revealed that the 4S3/2 state is indeed quenched by water via increased multiphonon relaxation 4S3/2 → 4F9/2 resulting in attenuated green emission, but the red emission state is not significantly affected by water (Fig. 4, Table 2). Thus, there is no direct deactivation of the 4F9/2 state due to OH-vibration. The lifetime of the red luminescence in H2O was longer than in D2O, which is probably caused by the increased multiphonon relaxation of 4S3/2 → 4F9/2 transition in the presence of high energy OH-vibrations, which favors the population of the 4F9/2 state in water. The amplitude fraction of the main decay component of green luminescence did not change in the two solvents. Interestingly, the red luminescence contained two lifetimes with about equal amplitude fractions.
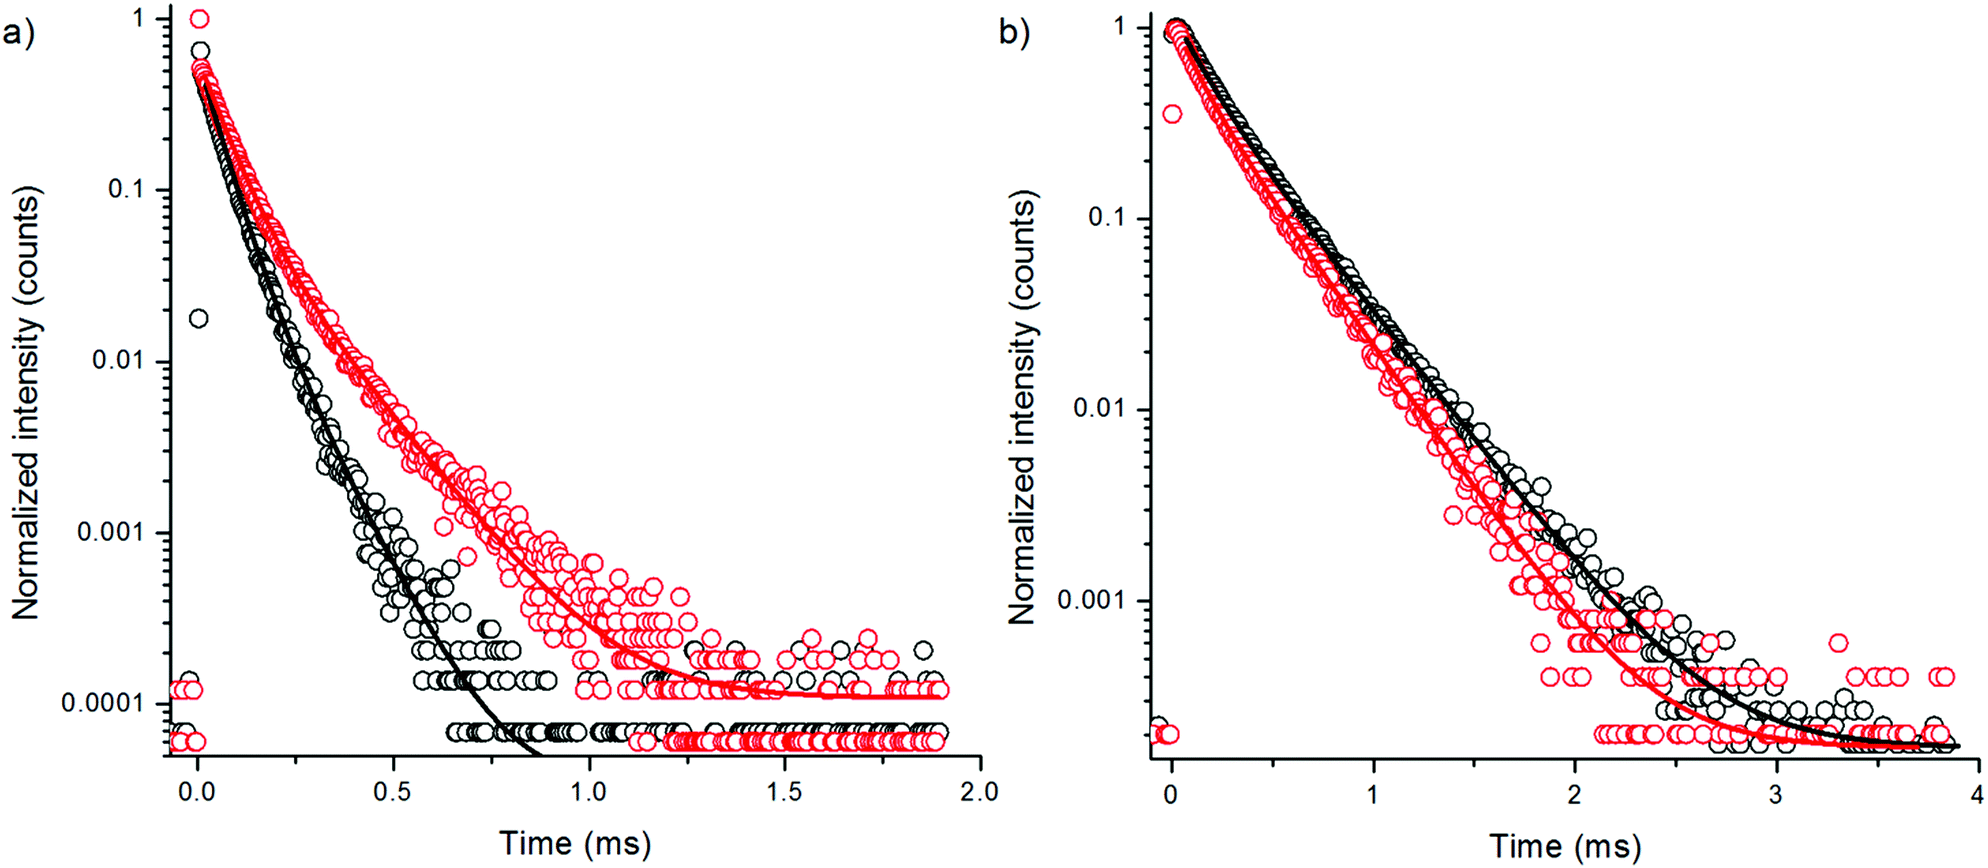 | ||
| Fig. 4 Decay curves of 380 nm excited emission of bare NaYF4:Yb3+,Er3+ (a) at 550 nm and (b) at 655 nm in H2O (black) and in D2O (red) using 3 μs excitation pulse width. | ||
| Bare in H2O | Bare in D2O | |
|---|---|---|
| 4S3/2 → 4I15/2 (green emission) | ||
| τ 1 (μs) | 51 ± 1.1 (86.3%) | 63 ± 0.7 (80.4%) |
| τ 2 (μs) | 102 ± 9.1 (13.7%) | 155 ± 3.9 (19.6%) |
| 4F9/2 → 4I15/2 (red emission) | ||
| τ 1 (μs) | 145 ± 2.6 (50.8%) | 114 ± 4.2 (51.8%) |
| τ 2 (μs) | 324 ± 2.2 (49.2%) | 288 ± 3.1 (48.2%) |
The quenching of Tm3+-doped nanophosphors by water has been studied less than the quenching of Er3+-doped nanophosphors. In the energy level diagram of NaYF4:Yb3+,Tm3+ (Fig. 1b), the vibrational relaxations occur only in intermediate energy levels and the energy difference of these levels are too small to be caused by OH-vibrations. However, the intensity of the upconversion luminescence is quenched as much as that of Er3+-doped particles (Fig. 2b). The quenching efficiency, calculated from the spectra, of 470 nm upconversion emission of bare and silanized Tm3+-doped particles by water was 61% and 66%, respectively. The red emission at 650 nm was quenched 57% and 66%, respectively, and the near infrared (NIR) emission was quenched 50% in both bare and silanized nanophosphors. Interestingly, silanization seemed to protect the luminescence from quenching more efficiently than in Er3+-doped nanophosphors.
The upconversion luminescence decays of NaYF4:Yb3+,Tm3+ nanophosphors were measured at 470 nm, 650 nm and 800 nm with method 1 (Fig. 5, Table 3). The luminescence decay times of the bare nanophosphors did not differ significantly from the decay times of silanized UCNPs even though the intensity reduction was as large in the decay measurements as in spectral measurement (Fig. 2b). Only 5–25% decrease in lifetimes was found in water compared to D2O. This suggests that no direct relaxations occur from the emissive states 1G4 and 3H4 by the influence of OH-vibration. The 470 nm and 650 nm emissions occur from the same energy level 1G4 which can also be seen in the similar decays obtained.
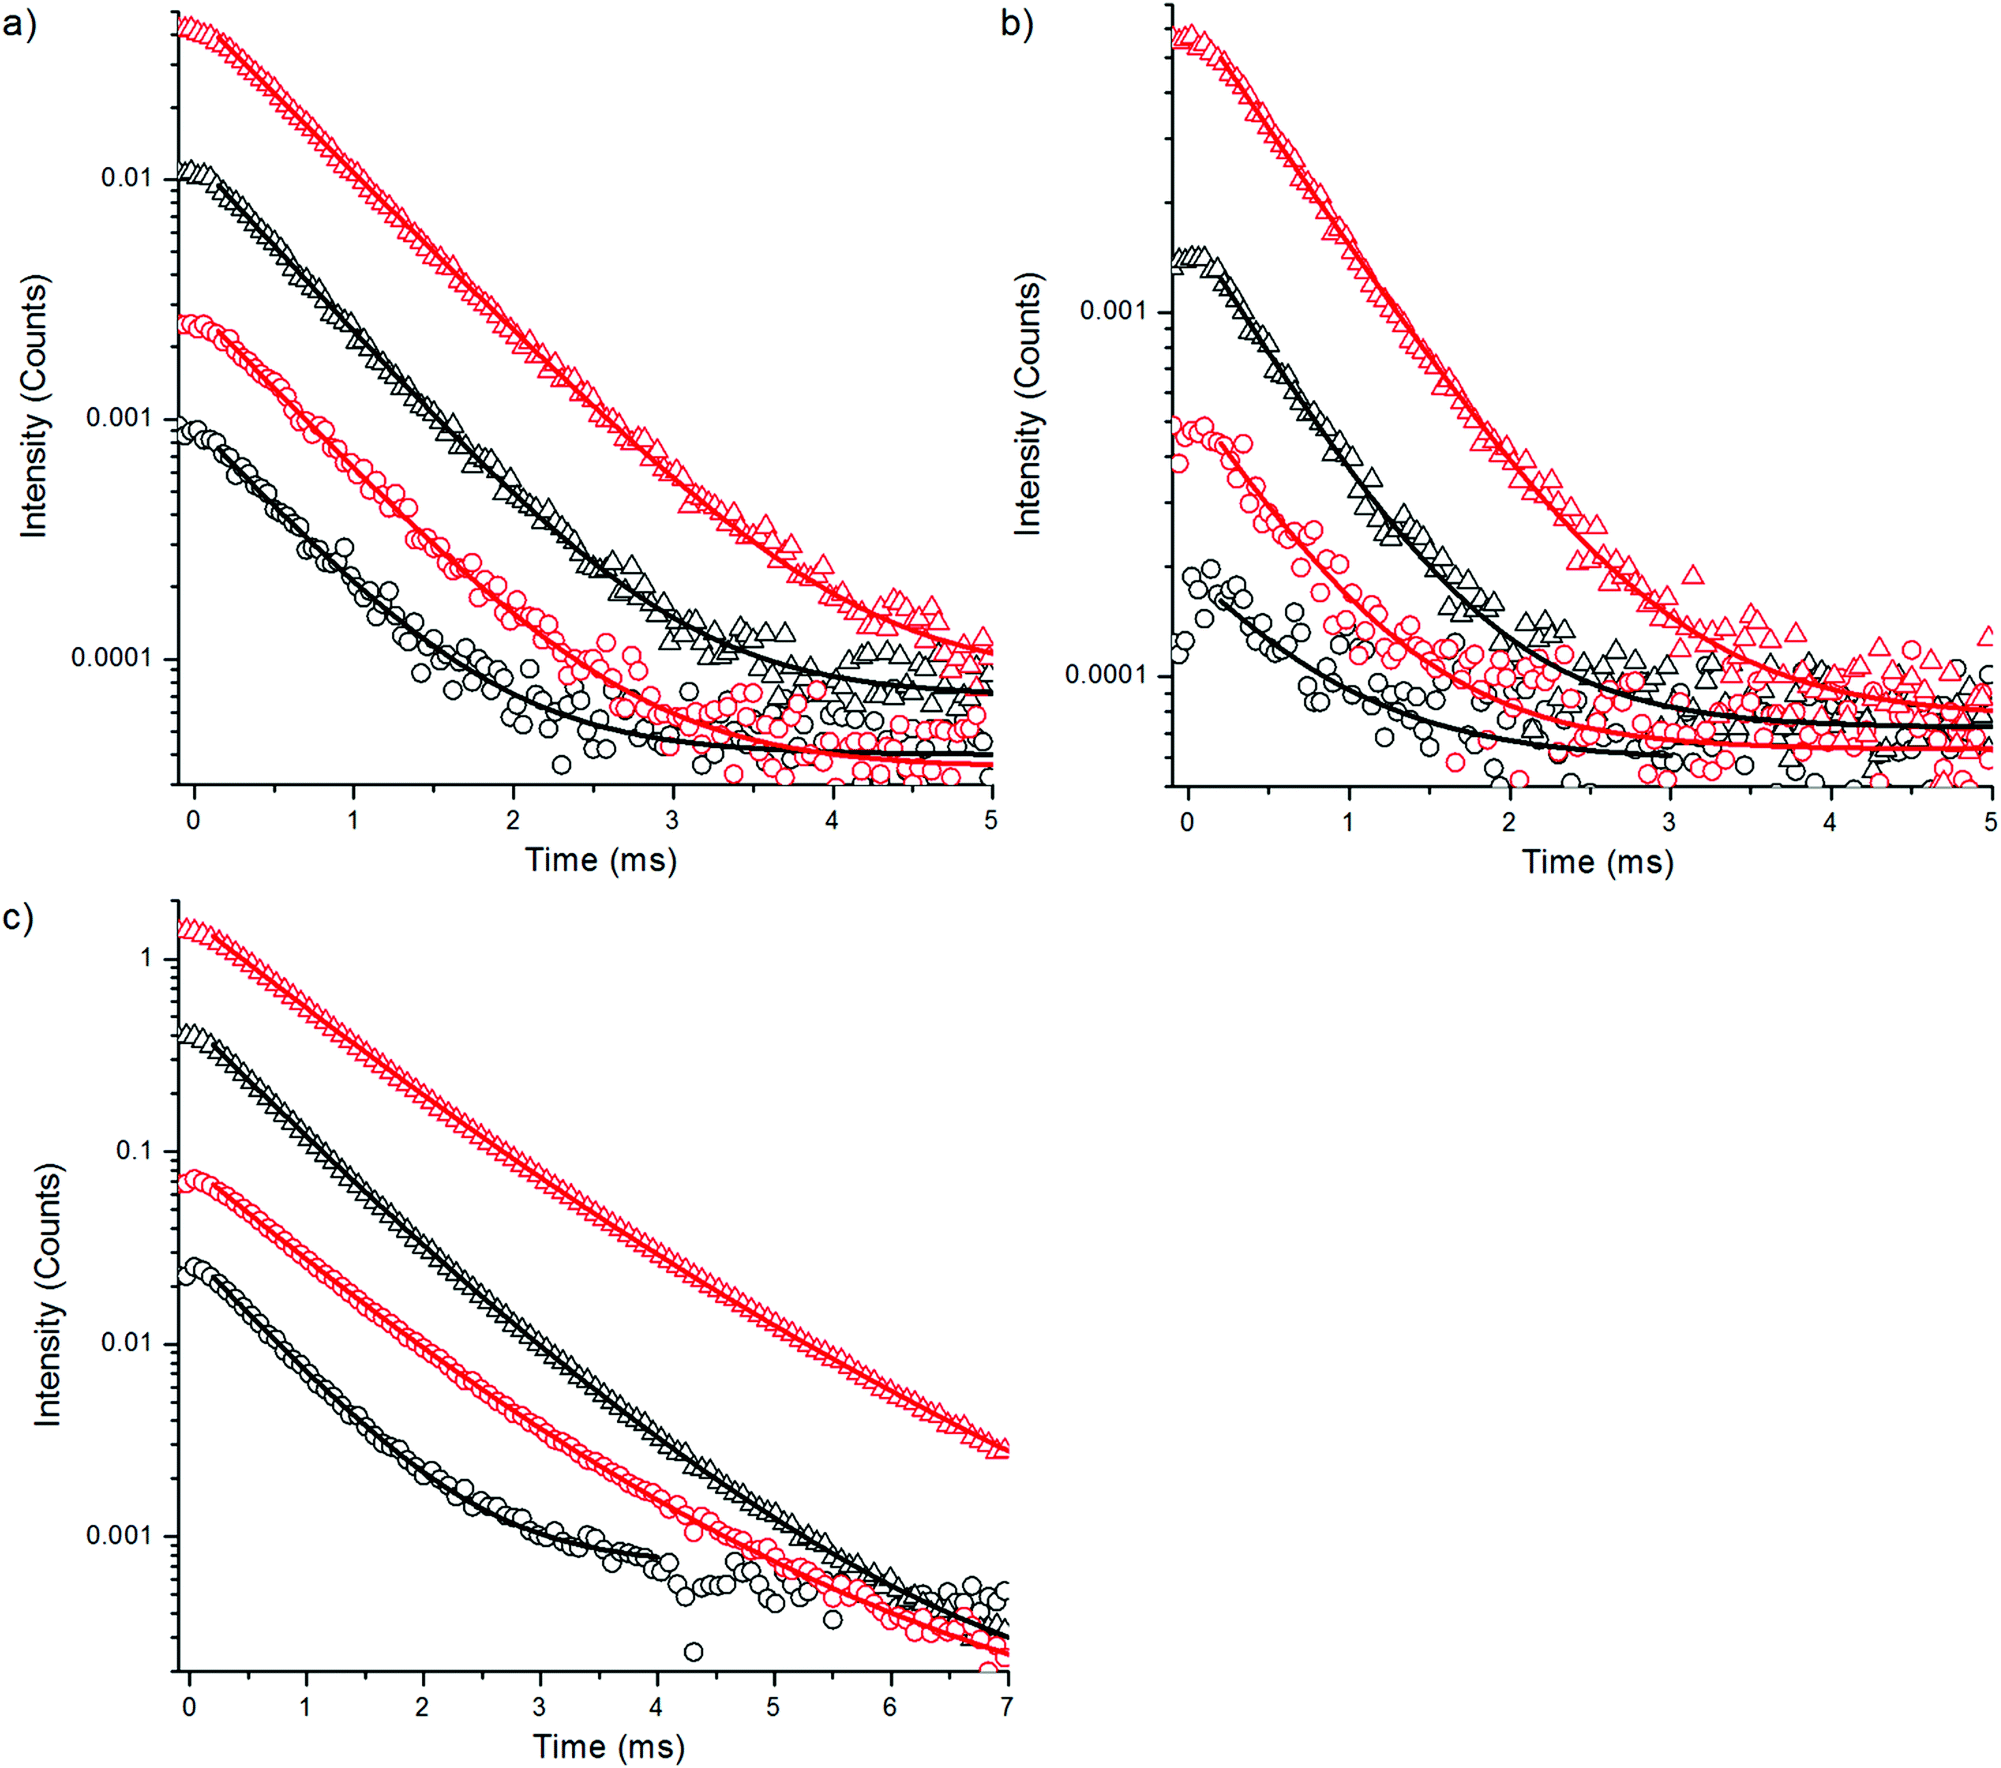 | ||
| Fig. 5 Decay curves of upconversion emission of bare (circles) and silanized (triangles) NaYF4:Yb3+,Tm3+ in H2O (black) and D2O (red) at (a) 470 nm, (b) at 650 nm and (c) at 800 nm using 20 ms excitation pulse width. | ||
| Bare in H2O | Bare in D2O | Silanized in H2O | Silanized in D2O | |
|---|---|---|---|---|
| 1G4 → 3H6 (blue emission) | ||||
| τ 1 (μs) | 593 ± 10.9 (100%) | 625 ± 3.9 (100%) | 596 ± 1.9 (100%) | 650 ± 1.0 (100%) |
| 1G4 → 3F4 (red emission) | ||||
| τ 1 (μs) | 708 ± 79.4 (100%) | 618 ± 18.0 (100%) | 590 ± 7.0 (100%) | 656 ± 2.7 (100%) |
| 3H4 → 3H6 (NIR emission) | ||||
| τ 1 (μs) | 666 ± 2.5 (100%) | 808 ± 18.6 (86.2%) | 668 ± 4.7 (84.8%) | 859 ± 4.5 (86.9%) |
| τ 2 (μs) | 1592 ± 137.0 (13.8%) | 1139 ± 22.4 (15.2%) | 1526 ± 26.3 (13.1%) | |
The upconversion photoluminescence intensities of both bare and silanized UCNPs were measured at increasing proportion of H2O in D2O and compared to the intensity measured at 100 vol% D2O. Fig. 6 illustrates the quenching efficiency of water on upconversion luminescence intensity of NaYF4:Yb3+,Er3+ at both 535 nm and 665 nm. The luminescence of bare particles at both green and red emission wavelengths was quenched up to 99.9%. At 80 vol% H2O the luminescence intensities were already below 1% when compared to the intensity in D2O. Similar results have been obtained by Zhang et al.24 With silanized particles, the water quenching was reduced to 65% for the green upconversion emission and 55% for the red emission. Therefore, the silica shell provides some protection against the water quenching but it does not offer complete passivation of the UCNP surface. Similar results were obtained also with NaYF4:Yb3+,Tm3+ particles and at both 470 and 800 nm emission wavelengths (Fig. 7). The luminescence of bare Tm-doped nanophosphors was also quenched by up to 99.9% in water. When 380 nm light was used to excite the NaYF4:Yb3+,Er3+ nanophosphors directly, the emission intensity at 665 nm remained constant independent of the proportion of H2O in D2O (Fig. 6).
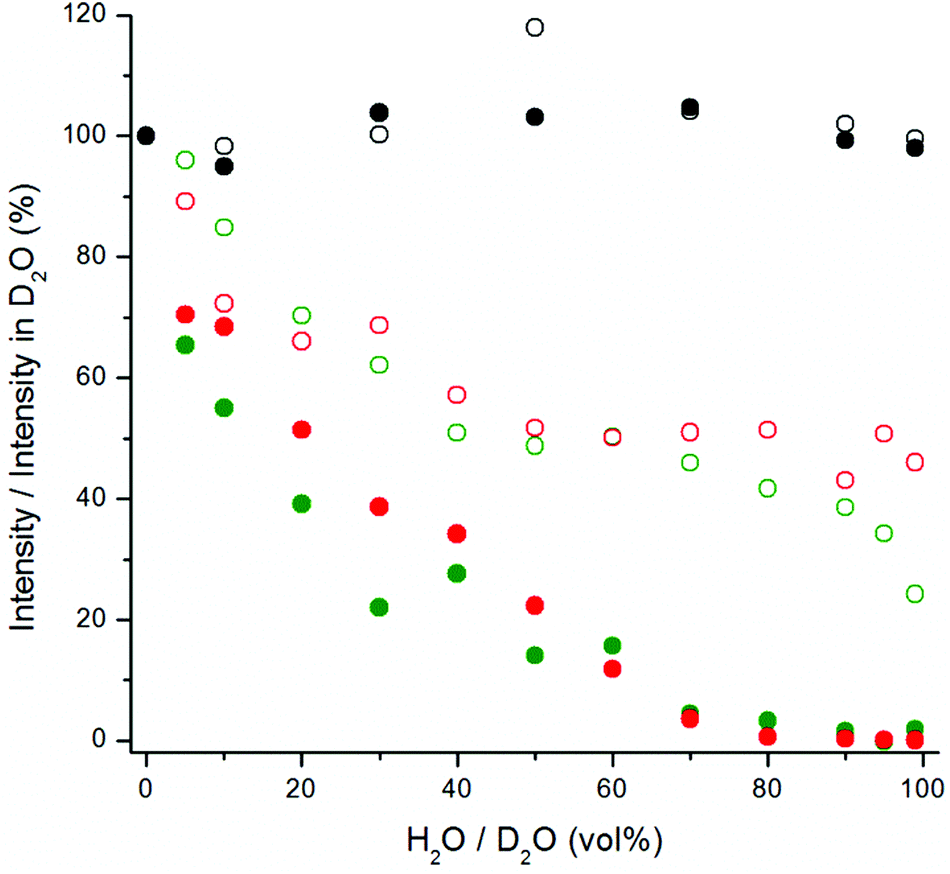 | ||
| Fig. 6 The quenching effect of increasing proportion of water in D2O on upconversion emission at 535 nm (green) and at 665 nm (red), and on 380 nm excited luminescence at 665 nm (black), of bare (filled symbols) and silanized (open symbols) NaYF4:Yb3+,Er3+ nanophosphors. | ||
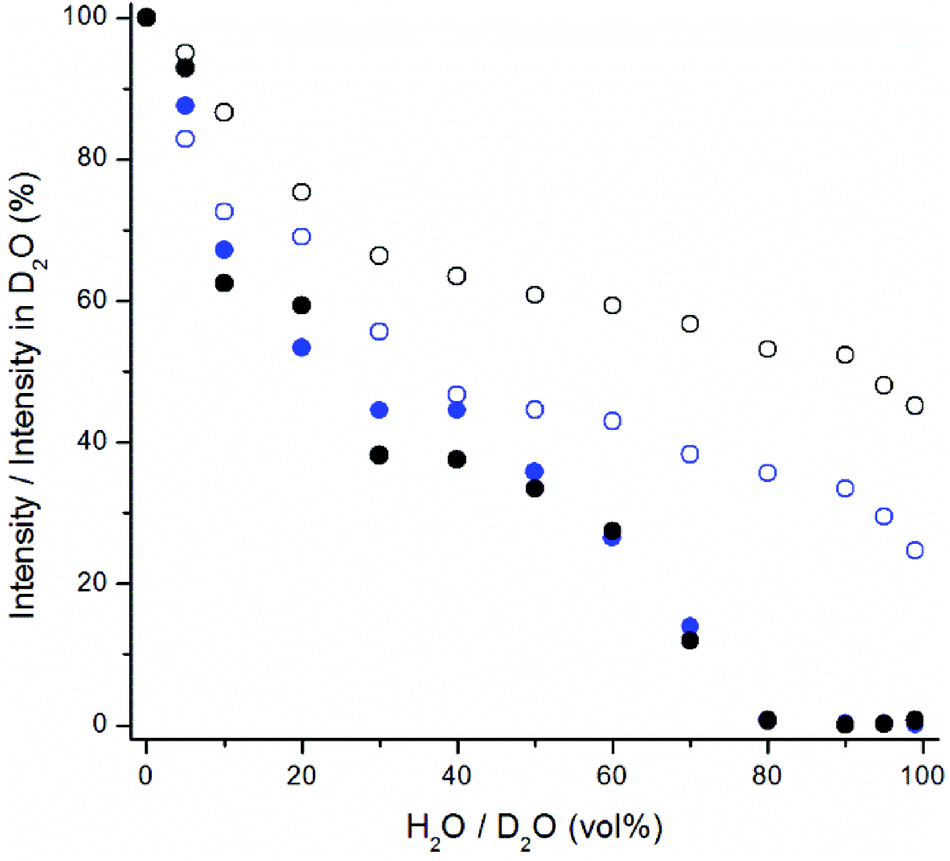 | ||
| Fig. 7 The quenching effect of increasing proportion of water in D2O on upconversion emission at 470 nm (blue) and at 800 nm (black) of bare (filled symbols) and silanized (open symbols) NaYF4:Yb3+,Tm3+ nanophosphors. | ||
The quenching efficiency of water in this experimental setup was much higher than in the spectral measurements above. The differences between the measurement setup using the plate Chameleon and the spectrometer are UCNP-concentration (40 μg mL−1vs. 1 mg mL−1, respectively), measurement time (2 seconds per well in microtiter plate assay vs. 10 s–2 min in spectral measurement) and excitation power density (>40 mW cm−2 and 85 W cm−2, respectively). The path lengths of the excitation light in the two setups were approximately the same (4.2–4.6 mm). The effects of these parameters on the quenching efficiency were further studied.
The water quenching long-time kinetics was studied using different UCNP concentrations and proportions of water in D2O (Fig. 8). The bare NaYF4:Yb3+,Er3+ nanophosphors in D2O were diluted to different vol% of H2O in D2O and their upconversion luminescence at 535 nm was measured in 1 min intervals using the plate Chameleon. The luminescence intensities were compared with the intensities obtained from samples in D2O at each time point. In 99 vol% H2O, the initial quenching efficiency of water was 75%, which, however, slowly increased to 98.4%. In 75 vol% H2O the quenching efficiency increased from 71% to 88% during the 40 minutes. The decrease in luminescence intensities can partly be caused by the adsorption of the nanophosphors onto the walls of the microtiter plate, but this should be the same in water and in D2O and thus cannot explain the faster signal drop in water. Therefore, it seems that the D2O molecules coordinated on the surface of the nanophosphors are slowly exchanged by H2O molecules. In addition, a UCNP-concentration dependence on the quenching rate of water was found (Fig. 8b). When UCNP-concentration was decreased from 40 μg mL−1 to 2.2 μg mL−1, the quenching efficiency in 99 vol% water increased from the initial efficiency of 78% to 99.96% after 40 minutes. I.e., as the UCNP-concentration decreased 18-fold, the luminescence intensity at 40 min time point decreased 321-fold. Therefore, the UCNP-concentration dependence can account for the differences in quenching efficiencies of water found in the two experimental setups. The concentration dependence in the quenching efficiency of water is most likely due to nanophosphor aggregation. Ultrasonication of the bare UCNPs in 99 vol% water led to an increase in the quenching efficiency in comparison to the unsonicated sample due to the increase in surface-to-volume ratio by disruption of the aggregates. Nanophosphor aggregation, which reduces the surface-to-volume ratio, is enhanced in higher UCNP-concentrations.
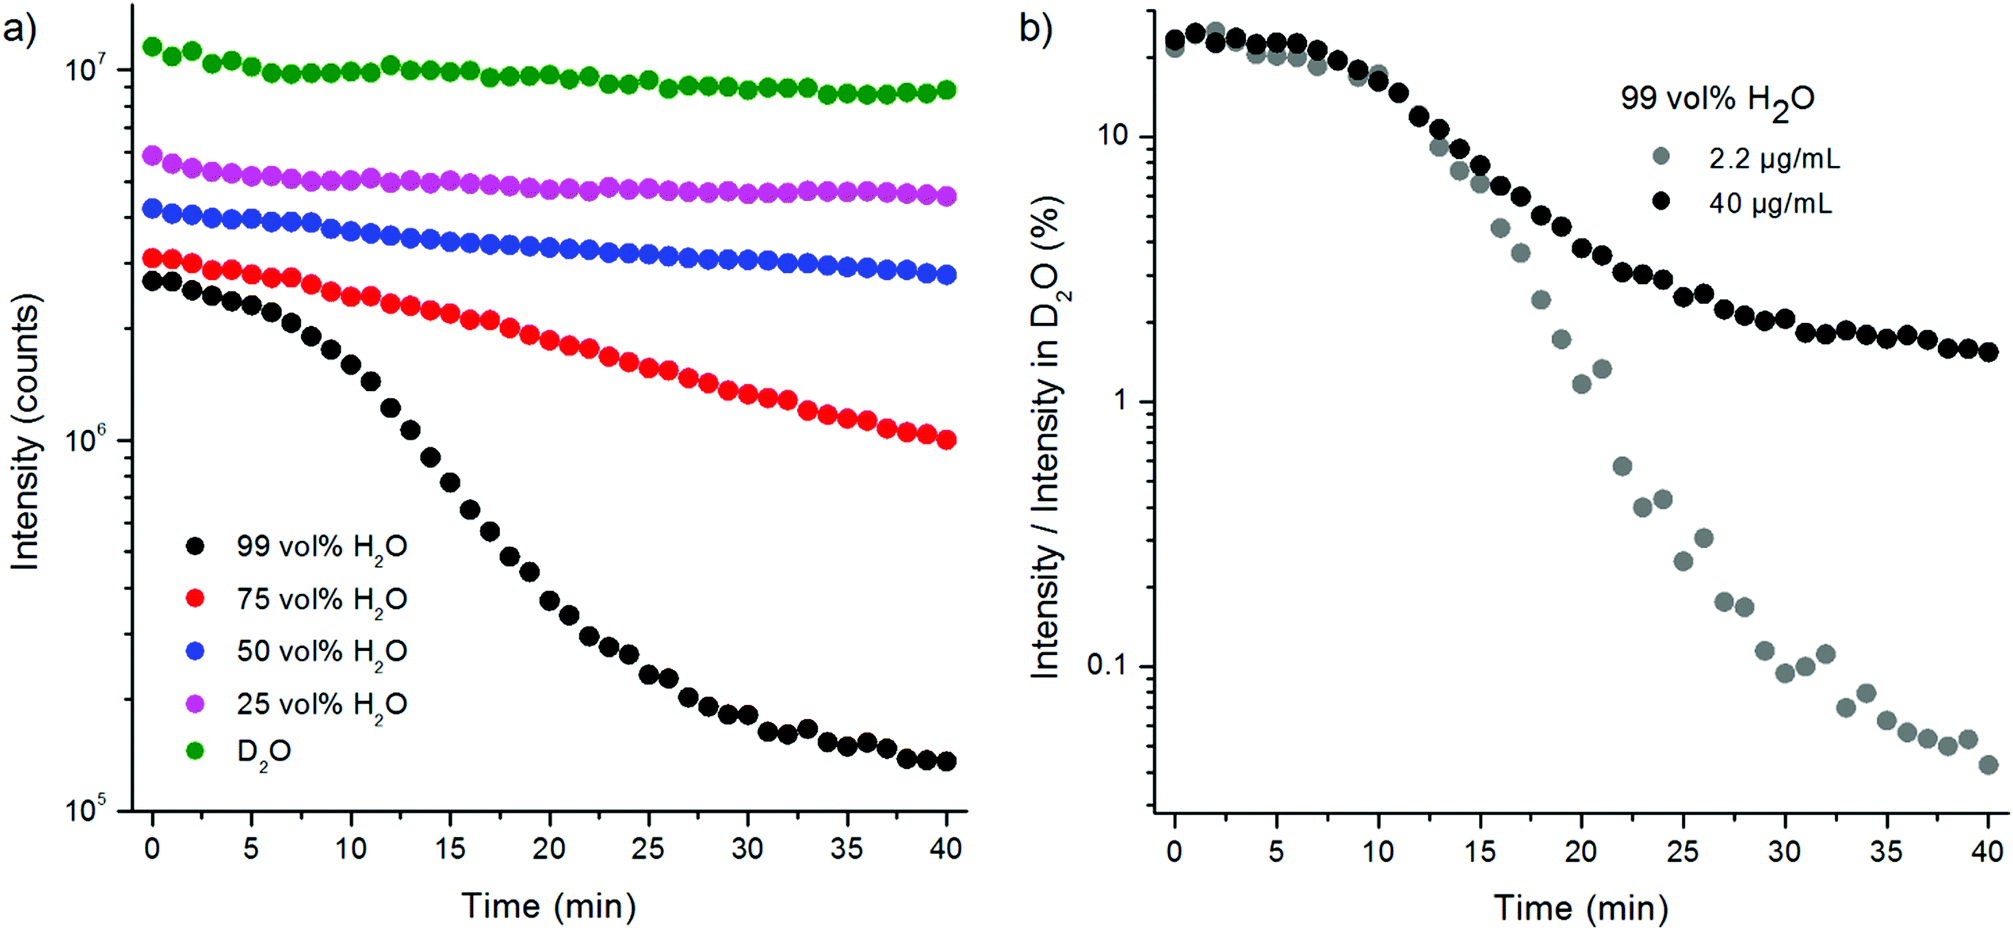 | ||
| Fig. 8 (a) Kinetics of water quenching of upconversion photoluminescence of bare NaYF4:Yb3+,Er3+ nanophosphors at 535 nm after diluting the UCNPs in D2O to increasing proportions of water (UCNP-concentration 40 μg mL−1). (b) Concentration dependence of the kinetics of water quenching of upconversion photoluminescence of bare NaYF4:Yb3+,Er3+ nanophosphors at 535 nm after diluting to 99 vol% H2O medium at two UCNP-concentrations. | ||
The slow decrease in upconversion luminescence was confirmed to have been caused by quenching instead of e.g. slow adsorption of the upconverting nanophosphors onto the walls of the microtiter plate wells by measuring the luminescence decays at different time points after preparing fresh samples. The decays were measured from samples in 99 and 75 vol% H2O in D2O and in 100 vol% D2O at time points 1–6 min, 10–16 min and 25–31 min (one measurement lasted for 5 minutes) using method 2 (Fig. S4, Table S1 in the ESI†). In D2O, the lifetimes remained constant at the three time points. In 99 vol% H2O, however, there was a 29% decrease in the main decay component measured at 25–31 min when compared to the decay measured at 1–6 min. In 75 vol% H2O, the corresponding decrease was 20%. Also, the intensity decrease could be observed from the decay curves in H2O samples whereas in D2O, the intensity levels remained the same.
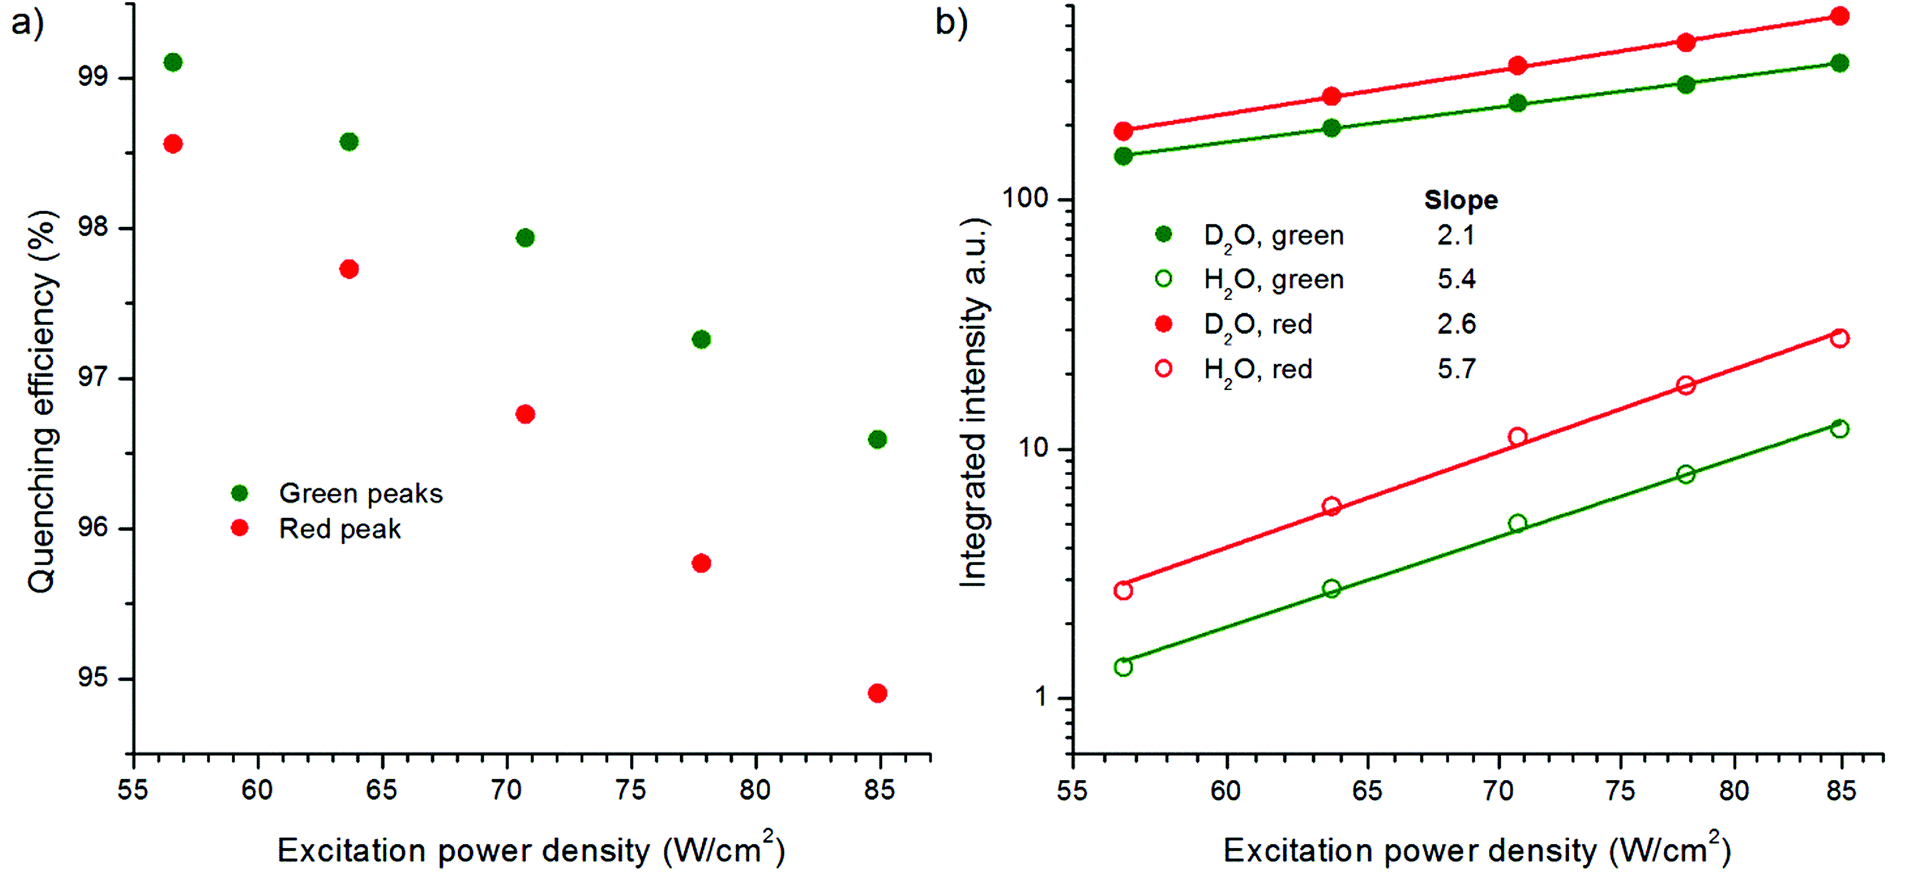
The effect of excitation power density on the quenching efficiency of water was studied by measuring the upconversion luminescence spectrum of bare NaYF4:Yb3+,Er3+ in both water and D2O using different excitation powers from 57 to 85 W cm−2 (Fig. 9, Fig. S5 in the ESI†). Surprisingly, the quenching efficiency of water increased in decreasing power density, i.e., a larger proportion of the luminescence was quenched in water compared to the luminescence in D2O when lower power densities were used. An enhanced dependence on excitation power density was found for the quenching of the red emission compared to the green. However, the relative quenching of the green emission peaks was stronger. The results suggest that at higher excitation power densities the surface dopants are probably quenched as much as at lower densities, but the core of the UCNP is able to produce more emission rather than deactivate through relaxations. At higher power densities, a larger population of Yb3+ ions is excited and thus there are probably fewer unexcited Yb3+ ions for the energy migration to occur, leading to the decreased overall quenching. This study shows that the quenching effect of water on upconversion photoluminescence is inversely dependent on the excitation power density, and the dependency is linear at the power range studied here. In the future, the power density range should be increased to study the luminescence behavior also at higher powers.
 | ||
| Fig. 9 (a) The quenching efficiency of upconversion photoluminescence of bare NaYF4:Yb3+,Er3+ nanophosphors by water at different excitation power densities, and (b) intensities of the red (636–684 nm) and green (510–565 nm) upconversion emission peaks in D2O or in H2O plotted together with the excitation power density in a log–log curve. | ||
The integrated intensities of spectra in Fig. S5 (in the ESI†) were plotted against the excitation power densities in a log–log curve (Fig. 9b). The slopes of the power density dependency curves in D2O for the green emission transitions 2H11/2/4S3/2 → 4I15/2 and the red emitting state 4F9/2 → 4I15/2 were 2.1 and 2.6, respectively, which are similar with those reported in the literature.14 However, in the presence of the high energy OH-vibrations in water, the slopes increased to 5.4 and 5.7, respectively. To our knowledge, this is the first time that the power dependency of upconversion photoluminescence has been measured in water. Usually, the power density dependencies are studied from a dry UCNP powder or the sample environment is not even mentioned.14,25,26
The absorptivity of water at 980 nm, which is 0.485 cm−1,18,19 has been suggested to be one of the quenching mechanisms of upconversion photoluminescence.18 In the experimental setups with 4.2–4.6 mm path length, ∼20% of the excitation light was absorbed. The absorption of the excitation light by water should have a similar effect on the upconversion luminescence intensity as the decrease of excitation power density. Because the excitation power dependence of red upconversion luminescence intensity is slightly higher than that of the green luminescence,14 the absorption of the excitation light by water should affect the red emission peak more. The opposite was observed in water, i.e., the green peak was quenched more in relation to the red peak (Fig. 2a and 9, Fig. S5 in the ESI†). Therefore, the absorption of NIR light by water cannot be the main mechanism in quenching of the upconversion photoluminescence.
To find an additional explanation for the strong quenching efficiency of water we studied the luminescence decay kinetics of the Yb3+ sensitizer emission at 980 nm upon 930 nm excitation for both bare NaYF4:Yb3+,Er3+ and NaYF4:Yb3+,Tm3+ nanophosphors and corresponding UCNPs with a silica shell in H2O and D2O using method 3 (Fig. 10, Table 4). The luminescence lifetime of bare NaYF4:Yb3+,Er3+ was shortened by 73% and the lifetime of bare NaYF4:Yb3+,Tm3+ nanophosphors was shortened by 54% in water when compared to D2O. This major quenching in Yb3+ emission lifetime implicates that neither the increased non-radiative relaxation of the intermediate or emissive states of Er3+, nor the water absorption of excitation light at 980 nm, are the source of large quenching observed in upconversion luminescence intensities, but it is the 2F5/2 state of Yb3+ which is deactivated in water. The third vibrational overtone of OH-stretching can bridge the gap of 2F5/2 → 2F7/2 transition (∼10200 cm−1) causing relaxation to ground state. The silica shell did not help much to prevent the quenching as revealed by the similar reduction in luminescence lifetime found for silica encapsulated UCNPs in water and that found for bare particles. In D2O, also the intensity of the Yb3+ emission is enhanced.
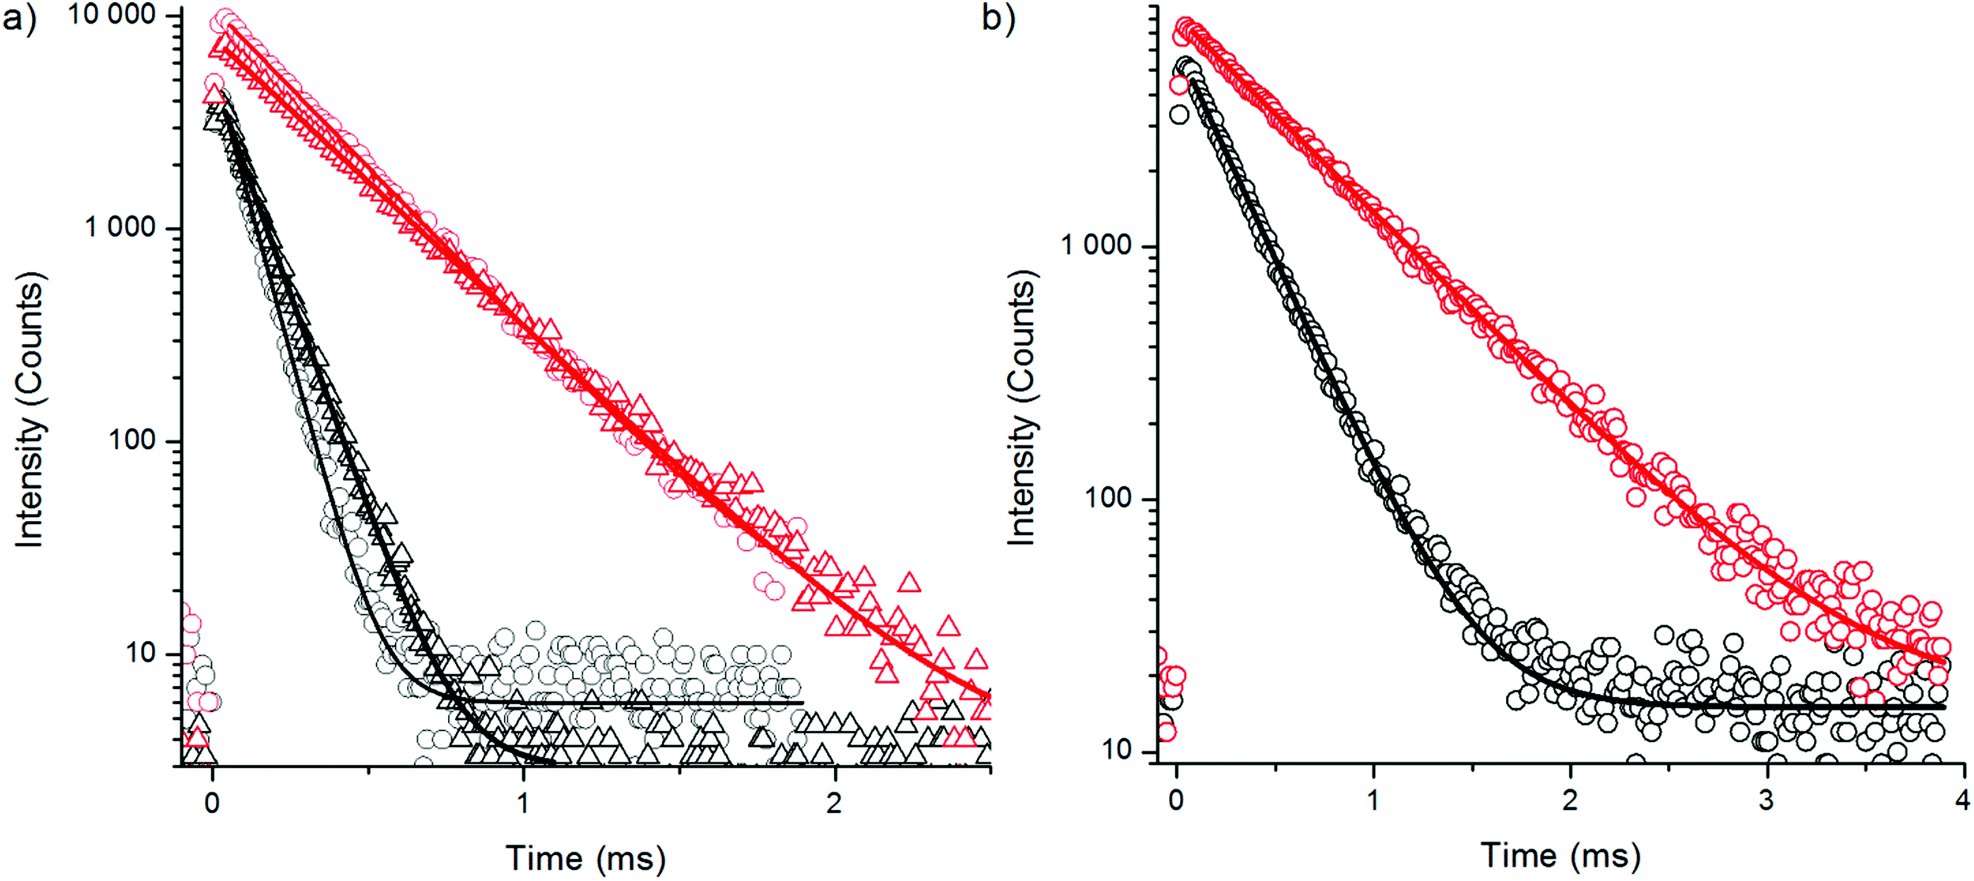 | ||
| Fig. 10 Decay curves of 930 nm excited ytterbium emission at 980 nm in H2O (black) and D2O (red) of (a) bare (circles) and silanized (triangles) NaYF4:Yb3+,Er3+ and (b) bare NaYF4:Yb3+,Tm3+ using 3 μs excitation pulse width. | ||
| Bare in H2O | Bare in D2O | Silanized in H2O | Silanized in D2O | |
|---|---|---|---|---|
| NaYF4:Yb3+,Er3+ | ||||
| τ 1 (μs) | 79 ± 0.3 (100%) | 288 ± 0.5 (100%) | 106 ± 0.3 (100%) | 319 ± 0.5 (100%) |
| NaYF4:Yb3+,Tm3+ | ||||
| τ 1 (μs) | 256 ± 0.7 (100%) | 556 ± 1.0 (100%) | ||
The quenching effect of water by relaxation of the excited state of Yb3+ ion in UCNPs explains why the upconversion photoluminescence intensity of both Er3+ and Tm3+-doped nanophosphors is quenched so efficiently (Fig. 6 and 7). Because upconversion is a multiphoton process, the quenching of the sensitizer ion Yb3+ has a higher order effect on the upconversion luminescence. This was observed also as an increase in the slope of the power density dependency curve in water in comparison with the slope in D2O (Fig. 9b). Further, due to the larger amount and short distances between individual Yb3+ ions, there seems to be an efficient energy migration between Yb3+ ions in the nanocrystal, which leads to the whole volume of the nanoparticle being susceptible to non-radiative deactivation via surface OH-vibrations. Even the silica shell does not prevent the quenching of the excited state of Yb3+. A steep dependence on the excitation power density was found for the quenching efficiency of upconversion photoluminescence by water. The exchange of D2O molecules to H2O molecules was fairly slow and also the UCNP-concentration affected the quenching efficiency.
4. Conclusions
Our results underline the strong influence of the surrounding water molecules on the intensity and decay behavior of the upconversion photoluminescence of nanometer-sized upconverting nanophosphors. The increased non-radiative relaxation of energy states of Er3+-dopants by high energy vibrational modes of OH-groups is, however, only partly responsible for the strong quenching observed in the upconversion luminescence intensity. As a major source of non-radiative deactivation, we identified the increased relaxation of the Yb3+ sensitizer ion, reflected by the considerably shortened luminescence lifetimes of its directly (at 930 nm) excited emission at 980 nm in water. Because upconversion photoluminescence is a multiphoton process, the quenching of the sensitizer can be expected to have a higher order effect on the luminescence intensity. Furthermore, it seems that Yb–Yb energy migration is very efficient in these nanocrystals, which makes the whole ∼35 nm nanophosphors very susceptible to surface quenching effects. This clearly explains why up to 99.9% of the upconversion photoluminescence intensity can be quenched by water. A steep dependency on excitation power density was also found. In addition, the UCNP-concentration had an effect on the quenching efficiency and the exchange of D2O molecules to H2O molecules was fairly slow.Silica shell provided only little protection against the quenching effect of water. To improve the UCNP-labels for bioanalytical applications, which are performed in aqueous solutions, better surface passivation is required to prevent this quenching and enhance the upconversion luminescence. Our findings about the role of Yb3+ quenching are of high importance for the rational design of new core–shell nanophosphors as a prerequisite for upconversion nanoparticles with improved brightness as most likely all photon upconverting materials containing Yb3+ dopants at or near the nanophosphor surface can be quenched by water. The surface passivation must prevent Yb–Yb energy migrations from reaching the nanophosphor surface, which is in contact with water and thus most vulnerable to quenching. Possible options reach from inactive NaYF4 shells to layers of amphiphilic or hydrophobic polymers without high energy vibrational modes. An interesting option for a surface passivation through surface coating with amphiphilic polymers is the ligand attraction method, in which a bilayer with both hydrophobic and hydrophilic sections is formed.27
Acknowledgements
This study was supported by Tekes, the Finnish Funding Agency for Technology and Innovation, the National Doctoral Programme of Advanced Diagnostic Technologies and Applications (DIA-NET). We gratefully acknowledge financial support from the Federal Ministry for Economic Affairs and Energy (MNPQ program BMWI 11/12), DFG (Deutsche Forschungsgemeinschaft) for a Heisenberg research fellowship (SCHA 1009/10-1), and the Erasmus Student Network. The authors would like to acknowledge the COST Action CM1403 funded by the European Union. The authors would also like to thank Emilia Palo and Vishal Kale for synthesizing the UCNPs, Joni Juvonen for TEM-image analysis, and Milla Suominen and Antti Viinikanoja for helping with the FT-IR analysis.Notes and references
- A. D. Ostrowski, E. M. Chan, D. J. Gargas, E. M. Katz, G. Han, P. J. Schuck, D. J. Milliron and B. E. Cohen, ACS Nano, 2012, 6, 2686 CrossRef CAS PubMed
.
- D. J. Gargas, E. M. Chan, A. D. Ostrowski, S. Aloni, M. V. P. Altoe, E. S. Barnard, B. Sanii, J. J. Urban, D. J. Milliron, B. E. Cohen and P. J. Schuck, Nat. Nanotechnol., 2014, 9, 300 CrossRef CAS PubMed
- J. Shan, M. Uddi, N. Yao and Y. Ju, Adv. Funct. Mater., 2010, 20, 3530 CrossRef CAS PubMed
- S. Schietinger, L. d. S. Menezes, B. Lauritzen and O. Benson, Nano Lett., 2009, 9, 2477 CrossRef CAS PubMed
- J. Zhao, Z. Lu, Y. Yin, C. McRae, J. A. Piper, J. M. Dawes, D. Jin and E. M. Goldys, Nanoscale, 2013, 5, 944 RSC
- F. Wang, J. Wang and X. Liu, Angew. Chem., Int. Ed., 2010, 49, 7456 CrossRef CAS PubMed
- G. Liu, Chem. Soc. Rev., 2015, 44, 1635 RSC
- J.-C. Boyer, M.-P. Manseau, J. I. Murray and F. C. J. M. van Veggel, Langmuir, 2009, 26, 1157 CrossRef PubMed
- S. V. Eliseeva and J. C. Bunzli, Chem. Soc. Rev., 2010, 39, 189 RSC
- N. Bogdan, F. Vetrone, G. A. Ozin and J. A. Capobianco, Nano Lett., 2011, 11, 835 CrossRef CAS PubMed
- M. Pedroni, F. Piccinelli, T. Passuello, S. Polizzi, J. Ueda, P. Haro-González, L. Martinez Maestro, D. Jaque, J. García-Solé, M. Bettinelli and A. Speghini, Cryst. Growth Des., 2013, 13, 4906 CAS
- E. G. Moore, M. Seitz and K. N. Raymond, Inorg. Chem., 2008, 47, 8571 CrossRef CAS PubMed
- A. Beeby, I. M. Clarkson, R. S. Dickins, S. Faulkner, D. Parker, L. Royle, A. S. de Sousa, J. A. G. Williams and M. Woods, J. Chem. Soc., Perkin Trans. 2, 1999, 493 RSC
- Y. Wang, L. Tu, J. Zhao, Y. Sun, X. Kong and H. Zhang, J. Phys. Chem. C, 2009, 113, 7164 CAS
- G. S. Yi and G. M. Chow, Adv. Funct. Mater., 2006, 16, 2324 CrossRef CAS PubMed
- L. Tu, X. Liu, F. Wu and H. Zhang, Chem. Soc. Rev., 2015, 44, 1331 RSC
- Q. Su, S. Han, X. Xie, H. Zhu, H. Chen, C.-K. Chen, R.-S. Liu, X. Chen, F. Wang and X. Liu, J. Am. Chem. Soc., 2012, 134, 20849 CrossRef CAS PubMed
- Q. Zhan, J. Qian, H. Liang, G. Somesfalean, D. Wang, S. He, Z. Zhang and S. Andersson-Engels, ACS Nano, 2011, 5, 3744 CrossRef CAS PubMed
- K. Ahrar, A. Gowda, S. Javadi, A. Borne, M. Fox, R. McNichols, J. U. Ahrar, C. Stephens and R. J. Stafford, J. Vasc. Interv. Radiol., 2010, 21, 555 CrossRef PubMed
- M. Ylihärsilä, E. Harju, R. Arppe, L. Hattara, J. Hölsä, P. Saviranta, T. Soukka and M. Waris, Clin. Microbiol. Infect., 2012, 19, 551 CrossRef PubMed
- S. Wilhelm, T. Hirsch, W. M. Patterson, E. Scheucher, T. Mayr and O. S. Wolfbeis, Theranostics, 2013, 3, 239 CrossRef CAS PubMed
- T. Soukka, K. Kuningas, T. Rantanen, V. Haaslahti and T. Lövgren, J. Fluoresc., 2005, 15, 513 CrossRef CAS PubMed
- T. Cao, Y. Yang, Y. Gao, J. Zhou, Z. Li and F. Li, Biomaterial, 2011, 32, 2959 CrossRef CAS PubMed
- F. Zhang, R. Che, X. Li, C. Yao, J. Yang, D. Shen, P. Hu, W. Li and D. Zhao, Nano Lett., 2012, 12, 2852 CrossRef CAS PubMed
- J. Shan, M. Uddi, R. Wei, N. Yao and Y. Ju, J. Phys. Chem. C, 2010, 114, 2452 CAS
- J. F. Suyver, A. Aebischer, S. García-Revilla, P. Gerner and H. U. Güdel, Phys. Rev. B: Condens. Matter, 2005, 71, 125123 CrossRef
- S. Jiang, K. Y. Win, S. Liu, C. P. Teng, Y. Zheng and M.-Y. Han, Nanoscale, 2013, 5, 3127 RSC
Footnote |
| † Electronic supplementary information (ESI) available: Transmission electron micrographs of the bare and silanized UCNPs, X-ray powder diffraction spectra of the NaYF4:Yb3+,Er3+ and NaYF4:Yb3+,Tm3+ nanophosphors, FT-IR spectra of oleic acid capped and bare UCNPs, the repetitiveness study of luminescence lifetime measurement, decay curves and table of lifetimes of upconversion emission of bare NaYF4:Yb3+,Er3+ in different proportions of water in H2O and time points at 550 nm, and upconversion luminescence spectra of bare NaYF4:Yb3+,Er3+ in both D2O and H2O at different excitation power densities. See DOI: 10.1039/c5nr02100f |
| This journal is © The Royal Society of Chemistry 2015 |