 Open Access Article
Understanding the origin of phase segregation of nano-crystalline in a BexZn1−xO random alloy: a novel phase of Be1/3Zn2/3O
Dingyu
Yong
a,
Haiyan
He
a,
Longxing
Su
b,
Yuan
Zhu
b,
Zikang
Tang
cb,
Xiao Cheng
Zeng
*de and
Bicai
Pan
*ad
aKey Laboratory of Strongly-Coupled Quantum Matter Physics, Department of Physics, University of Science and Technology of China, Hefei 230026, Anhui, P.R. China. E-mail: bcpan@ustc.edu.cn
bState Key Laboratory of Optoelectronic Materials and Technologies, School of Physics and Engineering, Sun Yat-sen University, Guangzhou 510275, China
cDepartment of Physics, Hong Kong University of Science and Technology, Hong Kong, China
dHefei National Laboratory for Physical Sciences at Microscale, University of Science and Technology of China, Hefei 230026, Anhui, P.R. China
eDepartment of Chemistry and Nebraska Center for Materials and Nanoscience, University of Nebraska, Lincoln, Nebraska 68588, USA. E-mail: xzeng1@unl.edu
First published on 27th April 2015
Abstract
The usage of a BexZn1−xO alloy in ultraviolet (UV)-region optoelectronic devices is largely hindered by its intricate phase segregation of crystallites of different sizes. To understand the physical origin of this phase segregation phenomenon on the atomistic scale, we have undertaken an extensive study of the structural evolution of the segregation phases in the BexZn1−xO alloy at finite temperatures by using first-principles calculations combined with the cluster expansion approach. We find that a random alloy of BexZn1−xO tends to segregate into a mix-ordered phase below a critical temperature, by the growth of prototype and nano-sized structures. The segregated phases in BexZn1−xO entail not only ZnO or BeO crystallites, but also two as yet unreported phases with beryllium concentration of 1/3 and 2/3. Both new phases of BexZn1−xO are direct wide-gap semiconductors with band gap values of 4.88 eV and 6.78 eV respectively. We envisioned that the novel Be1/3Zn2/3O crystal is highly promising for solar-blind device applications.
Introduction
Zinc oxide (ZnO) is a semiconductor with a direct band gap of 3.37 eV and high exciton binding energy (60 meV) at room temperature.1 These desirable electronic and optical properties render it a promising material for applications in ultraviolet (UV) optoelectronic devices,2 such as light emitting diodes (LEDs) and UV detectors.3,4 The latter are typically operated in the solar-blind region from 4.4 eV (280 nm) to 5.6 eV (220 nm). Clearly, the band gap of pristine ZnO does not match with this region, and thus it is necessary to tune the band gap of ZnO to the desired UV region. For this purpose, alloying ZnO with other II–VI oxide semiconductors such as MgO, BeO, etc. has been explored. Among these ZnO-based alloys, the MgxZn1−xO alloy has been widely investigated,5–13 since its band gap can be tuned from 3.37 eV (for wurtzite ZnO) to 7.8 eV (for rocksalt MgO). However, due to unmatched crystal structures between ZnO and MgO, the MgxZn1−xO alloy transforms from the wurtzite phase to the rocksalt phase when the Mg content x > 0.36. This structure transition limits the band gap of the wurtzite MgxZn1−xO alloy to less than 3.99 eV, which falls short of the solar-blind region.5More recently, recognizing the wurtzite hexagonal structure of BeO that has a wide bandgap (10.8 eV), BexZn1−xO was proposed by Ryu et al. as a candidate for the solar-blind devices.14 However, due to the large difference in ionic radii between Be2+ (0.27 Å) and Zn2+ (0.60 Å), the quality of the BexZn1−xO crystal grown using various methods15–18 was found to deteriorate with the increasing Be content. This is probably due to the phase separation and compositional fluctuation of Be in the BexZn1–xO alloy.19 Particularly, annealing the system at high temperatures, the Be content in the synthesized BexZn1–xO with intermediate x values is not distributed uniformly but segregated into regions with either low or high Be contents.20–22 More recently, the recrystallization of the BexZn1−xO alloy under thermal treatment has been found to significantly influence the electronic and optical properties of the BeZnO based devices.23,24 To understand this uneven distribution of the Be content in the BexZn1−xO alloy, a few theoretical studies have been reported over the past few years.25–27 Based on a search for the atomistic configurations with a supercell containing 32 atoms, Fan et al. found that the BexZn1−xO alloy favoured local phase segregation, where three kinds of crystallites with Be concentration values of x = 1/4, 1/2 and 3/4 arise.25 Dong et al. also noticed that BexZn1−xO alloys might possess a novel crystalline structure different from the end components ZnO and BeO.27 In the previous studies, however, sizes of supercells were quite small such that the x values are limited to the multiples of 1/16 and 1/8, respectively. In other words, these previous theoretical searches of the compound structures were taken only within a narrow configuration space, and thus, the lowest-energy structure of the compound is still unknown. More importantly, how the phase segregation couples with the annealing temperature and with the Be content in the BexZn1−xO alloy remains open to questions. Hence, it is of both fundamental and technological importance to understand the physical origin of the phase segregation in the BexZn1−xO alloy and identify structures of the segregated phases, thereby providing insightful guidance to experimental fabrication of high-quality BexZn1−xO alloys.
Here, by combining first-principles calculations with the cluster expansion (CE) approach, we have systematically studied structural evolution of the BexZn1−xO alloy at different temperatures. We find that the phase segregation occurs in BexZn1−xO when the annealing temperature is below a critical value. Moreover, the critical temperature (CT) is tightly correlated with the Be content in the system. The segregated crystallites include not only the common end components ZnO and BeO, but also two novel BexZn1−xO phases with Be concentration x = 1/3 and 2/3 respectively. Both new BexZn1−xO crystal phases are predicted to be semiconductors with direct band gaps of 4.88 eV and 6.78 eV respectively.
Computational details
To study the structural evolution of the segregation phase in the BexZn1−xO alloy at finite temperatures, a huge supercell containing tens of thousands of atoms is needed for theoretical treatment. Thus far, the first-principles calculation cannot handle such a large size system. We therefore employed the well-established state-of-the-art CE approach to study the structural and thermodynamic properties of the alloy.28–32 In the CE approach, the alloy Hamiltonian is mapped onto a generalized Ising Hamiltonian, and thus, a function E(σ) with configuration σ can be represented by selecting effective cluster interactions Jα for the alloy considered.33Specifically, we treated the BexZn1−xO solid solution as a pseudobinary alloy with beryllium and zinc atoms substituting the cation lattice sites. The total energies of the BexZn1−xO alloys are represented with CE. The Alloy-Theoretic Automated Toolkit (ATAT) package is used to carry out the cluster expansion constructions.33–38 The parameters in CE are determined by fitting E(σ) to the total energies of many typical small-sized configurations, which are computed using density functional theory (DFT) methods as implemented in the Vienna ab-initio simulation package (VASP),39 where the interaction between ions and valence electrons is described with the projector augmented wave (PAW) potentials, and the exchange–correlation between electrons is treated by using the generalized gradient approximation (GGA) in the Perdew–Burke–Ernzerhof (PBE) form.40 We expand the one-electron wave functions in a plane-wave basis with an energy cutoff of 600 eV. In addition, the gamma centered Monkhorst–Pack mesh is used to sample the Brillouin zone for all the structures, ensuring approximately the same k-point density among different-sized supercells. All the small-sized structures are fully relaxed until the force on each atom is less than 0.02 eV Å−1.
Combining the CE approach with the Monte Carlo (MC) method,41–43 the evolution of the structure in each concerned BexZn1−xO alloy is simulated. In our simulations, the supercell contains 23![[thin space (1/6-em)]](https://www.rsc.org/images/entities/char_2009.gif) 040 cation–anion pairs. For each case with a given content of Be, the initial distribution of Be in the alloy is random. Such a system is annealed from 2000 K to 0 K, with a temperature step of 100 K. At a given temperature, it takes 30
040 cation–anion pairs. For each case with a given content of Be, the initial distribution of Be in the alloy is random. Such a system is annealed from 2000 K to 0 K, with a temperature step of 100 K. At a given temperature, it takes 30![[thin space (1/6-em)]](https://www.rsc.org/images/entities/char_2009.gif) 000
000![[thin space (1/6-em)]](https://www.rsc.org/images/entities/char_2009.gif) 000 exchange attempts to equilibrate this system. We obtain the averaged energy of the system from additional 30
000 exchange attempts to equilibrate this system. We obtain the averaged energy of the system from additional 30![[thin space (1/6-em)]](https://www.rsc.org/images/entities/char_2009.gif) 000
000![[thin space (1/6-em)]](https://www.rsc.org/images/entities/char_2009.gif) 000 MC steps for each temperature.
000 MC steps for each temperature.
Results and discussion
First, we studied cation distribution behavior in a representative pseudobinary Be0.01ZnO0.99O alloy which has a very low beryllium concentration. Our MC simulations provide the averaged energy E(BexZn1–xO,T) for the Be0.01ZnO0.99O alloy at different temperatures, ranging from 2000 K to 0 K. From this energy and the energies of bulk BeO and bulk ZnO, E(BeO) and E(ZnO), the formation energy of BexZn1−xO (x = 0.01) at a given temperature is evaluated by using the definition | (1) |
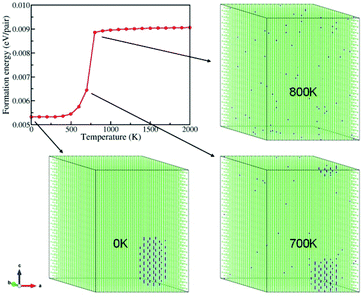
Fig. 1 plots the formation energy as a function of the temperature. It shows that the formation energy of the system decreases slightly from 2000 K to 800 K, and then abruptly drops from 800 K to 500 K. Below 500 K, again the formation energy decreases smoothly with the temperature. Notably, there is an inflection point at T = 700 K in the energy curve. Normally, a sharp change in energy near an inflection point correlates with a change in the structure of the system. A closer examination of the structure of the system at each temperature indicates that the Be ions distribute uniformly in the system for T ≥ 800 K (see Fig. 1). However, at 700 K, most Be ions accumulate to form an “ordered structure” (see below). As the temperature is further lowered, more and more Be ions converge into the nano-sized “ordered structure”, and eventually all Be ions gather together in the form of the “ordered structure” at 0 K. So, from 700 K to 0 K, both the “ordered structures” of Be and ZnO coexist in the system. Thus, the phase segregation occurs below 700 K. Relating this phenomenon below 700 K with the inflection point at 700 K in the formation energy curve indicates their close correlation. Further MC simulations show that the phase segregation shown in Fig. 1 occurs in many other configurations of the Be0.01ZnO0.99O alloy with different initial Be distributions. Hence, the phase segregation in the Be0.01ZnO0.99O alloy is a generic phenomenon at low temperature.
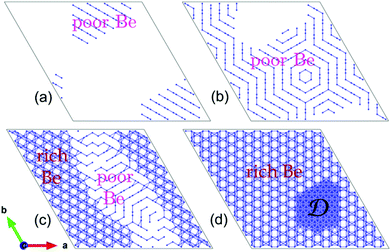
Next, we extended our MC simulations to systems with different beryllium contents, e.g., Be0.05Zn0.95O, Be0.25Zn0.75O, Be0.5Zn0.5O and Be0.7Zn0.3O. In each system, the phase segregation is observed during the MC simulations. Fig. 2 shows the segregated “ordered phases” for these systems at low temperatures. As depicted in Fig. 2(a), when x = 0.05, the segregated phase relevant to Be exhibits parallel stripes in the local structure, as in Be0.01Zn0.99O. For x = 0.25, the Be stripes in the segregated phase form hexagonal rings (Fig. 2(b)). These hexagonal rings are seemingly assembled from the stripes oriented in different directions, and thus, there exist grain boundaries between the segregated phases. A common feature in Fig. 2(a) and (b) is that the entire system is composed of the Be-stripe region and the Be free region. For x = 0.5, Be distributes over the entire system. However, the segregated structure of Be0.5Zn0.5O at low temperatures can still be seen. It displays a Be-rich region and a Be-poor region, as shown in Fig. 2(c). Here, the structural pattern in the Be-poor region is also stripe-like, as in Be0.01ZnO0.99O, Be0.05Zn0.95O and Be0.25Zn0.75O. As the x value further increases, the stripe-like regions gradually shrink and eventually disappear while the Be-rich regions expand. When the beryllium ions are over dosed, like Be0.7Zn0.3O, the whole system consists of both the Be-rich region and the BeO domains marked with D (Fig. 2(d)) at low temperatures.
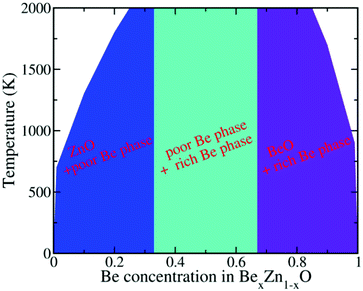
To describe the detailed segregation behavior of BexZn1−xO solid solution, we investigated numerous cases with different x values (step sets as 0.01 for 0.0 < x < 0.1 range and 0.9 < x < 1.0 range, 0.05 for the other ranges). The whole phase diagram of BexZn1−xO versus Be content x and temperature is shown in Fig. 3. As shown in Fig. 3, the CT for the phase separation is strongly dependent on the x value. Typically, for x < 0.33, the CT increases with increasing x. However, when x > 0.66, the CT decreases with increasing x. More interestingly, for x < 0.33, the BexZn1−xO alloy favours the mixed ZnO and Be-poor phase. For 0.33 < x < 0.66, the alloys are composed of both the Be-poor and the Be-rich phases and for x > 0.66, the alloys favour the phase separation of BeO and Be-rich phases. For 0.25 < x < 0.85, the low-energy alloy configurations obtained from CE convert to the segregation phases as shown in Fig. 3, by annealing even at 2000 K. Overall, regardless of the x value, phase segregation occurs below a critical temperature. This leads to the fact that the random alloy of BexZn1−xO is unstable after annealing, consistent with the observation that the random BeZnO alloy is rarely visible in experiments.20–22
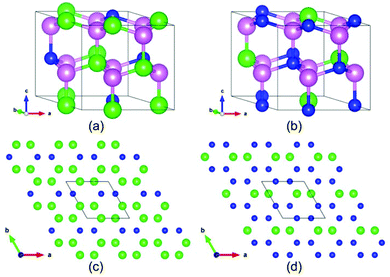
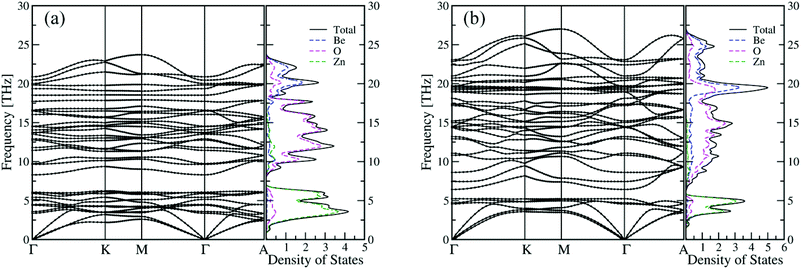
Our simulations suggest that the segregated crystallites not only include the common end components ZnO and BeO but also contain two novel BexZn1−xO phases. Their appearance indicates two novel BexZn1−xO phases with stable ordered structures. Closer examinations reveal that the Be content of the poor-Be phase and the rich-Be phase is 1/3 and 2/3, respectively. For convenience, the structure of the poor-Be phase is named as Be1/3Zn2/3O and the rich Be phase as Be2/3Zn1/3O. Both two new phases have the same space group of Cmc21, and their primitive cells are shown in Fig. 4 (a) and (b). In both new phases, the beryllium atoms fully occupy the cation sites in (010) atomic layers. The detailed structural information of the conventional cells for both Be1/3Zn2/3O and Be2/3Zn1/3O is listed in Table 1. It is worth noting that, with the same space group of Cmc21, the segregated phases are not hexagonal, but orthorhombic structures. Further, we examined the stability of both new crystals. The formation energies of Be1/3Zn2/3O and Be2/3Zn1/3O are predicted to be 54 meV per pair and 55 meV per pair, respectively, slightly higher than those of bulk BeO and bulk ZnO. This implies that the stabilities of both new crystals are less than either bulk BeO or bulk ZnO. Furthermore, their phonon dispersion44,45 and their vibrational density of states are computed. As shown in Fig. 5, no imaginary mode is found in the phonon dispersion, indicating that both Be1/3Zn2/3O and Be2/3Zn1/3O are dynamically stable. We have also examined thermal stability of both crystals at an elevated temperature. To this end, the first-principles molecular dynamics (FP-MD) simulations in canonical ensembles are performed using the 2 × 2 × 2 supercells. The temperature of the concerned systems is controlled at 1000 K. For each system, our FP-MD simulations run over 10 ps. It is found that the structure of both crystals remains intact, except for small displacement of atoms away from their lattice-site positions.
| Phase | Be1/3Zn2/3O | Be2/3Zn1/3O | ||||||
|---|---|---|---|---|---|---|---|---|
| a The letters in each label column are Wyckoff labels and the number before each letter is the corresponding multiplicity. | ||||||||
| Space group | Cmc21 (no. 36) | Cmc21 (no. 36) | ||||||
| Cell parameters | a (Å) | b (Å) | c (Å) | a (Å) | b (Å) | c (Å) | ||
| 9.304 | 5.364 | 4.929 | 8.730 | 5.019 | 4.639 | |||
| α (°) | β (°) | γ (°) | α (°) | β (°) | γ (°) | |||
| 90.0 | 90.0 | 90.0 | 90.0 | 90.0 | 90.0 | |||
| Atomic coordinates | ||||||||
| Atom | Labela | x | y | z | Labela | x | y | z |
| Be | 4a | 0.000 | 0.655 | 0.000 | 8b | 0.674 | 0.160 | 0.002 |
| O | 4a | 0.000 | 0.621 | 0.341 | 8b | 0.693 | 0.144 | 0.362 |
| O | 8b | 0.146 | 0.188 | 0.406 | 4a | 0.000 | 0.217 | 0.428 |
| Zn | 8b | 0.160 | 0.175 | −0.002 | 4a | 0.000 | 0.180 | −0.007 |
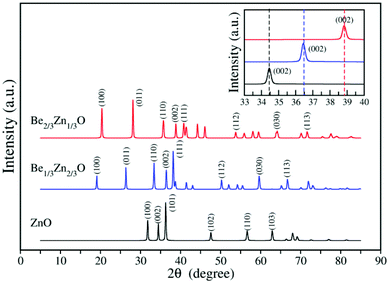
To gain more knowledge on both crystalline structures, we computed the X-ray diffraction (XRD) spectra for both Be1/3Zn2/3O and Be2/3Zn1/3O. As plotted in Fig. 6, compared to the bulk ZnO, more peaks arise in the XRD spectra of both new crystals. Notably, as displayed in the inset of Fig. 6, the (002) peaks at 2θ = 34.5, 36.5 and 38.9 belong to ZnO, Be1/3Zn2/3O and Be2/3Zn1/3O, respectively. This feature can be used to identify the new phases from the BeZnO mixed phases in experiments in the future.
Electronic structures of both new crystals are computed at the level of the hybrid functional (HSE06), where the portion of the exact exchange is 0.375.46 As shown in Fig. 7, both Be1/3Zn2/3O and Be2/3Zn1/3O are predicted to be direct wide-gap semiconductors, with band gap values of 4.88 eV and 6.78 eV respectively. The computed band gaps are just between computed band gaps 3.40 eV for BeO and 10.69 eV for ZnO. Importantly, the band gap (4.88 eV) of Be1/3Zn2/3O just falls in the solar-blind spectrum range (4.4–5.6 eV). Hence, the Be1/3Zn2/3O crystal can be a promising candidate for solar-blind detectors.
 | ||
| Fig. 7 Computed electronic band structures and density of states of (a) Be1/3Zn2/3O and (b) Be2/3Zn1/3O. Fermi levels are at 0.0 eV, which are marked with red dashed lines. | ||
As mentioned above, Fan et al.25 predicted that BexZn1−xO alloys favour local decomposition into three different compounds with x = 1/4, 2/4 and 3/4, respectively. In their calculations, a small-sized supercell with 32 atoms was used. As such, the x value in the considered structures was restricted as multiples of 1/16 only, thereby representing a limited search over possible configurations of compounds. Here, our calculations indicate that the formation energies of the three compounds of BexZn1−xO (x = 1/4, 2/4 and 3/4) are about 79 meV per pair, 132 meV per pair and 157 meV per pair, respectively, slightly higher than those of Be1/3Zn2/3O and Be2/3Zn1/3O. Hence, the crystals of Be1/3Zn2/3O and Be2/3Zn1/3O are expected to be more stable than those reported previously.
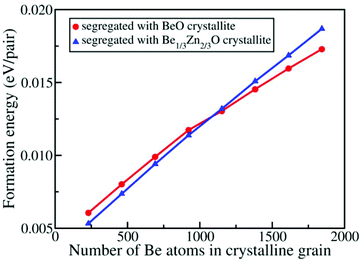
Because the formation energies of Be1/3Zn2/3O and Be2/3Zn1/3O are positive, from the energetic view, BexZn1−xO would favour phase segregation into BeO and ZnO rather than into Be1/3Zn2/3O and Be2/3Zn1/3O. This view would be inconsistent with our simulation in which either Be1/3Zn2/3O or Be2/3Zn1/3O crystallite is observed. This apparent inconsistency is due to the fact that the relative stabilities between ZnO, BeO, Be1/3Zn2/3O and Be2/3Zn1/3O are entirely based on the energies of their bulk states. In our simulation, the observed Be1/3Zn2/3O and Be2/3Zn1/3O are domains with finite sizes, and their stabilities can be quite different from those of the bulk crystals. To examine relative stabilities of the crystallites of both Be1/3Zn2/3O and Be2/3Zn1/3O with different sizes, we computed the size-dependent formation energies. As shown in Fig. 8, the formation energies of BeO grains embedded in the matrix of ZnO and the Be1/3Zn2/3O grains embedded in the matrix of ZnO increase with increasing the size of either BeO or Be1/3Zn2/3O grains. Interestingly, when the number of Be atoms in the system is less than about 1100 (corresponding to the sizes of 54 Å for a Be1/3Zn2/3O grain or 38 Å for a BeO grain), the embedded BeO grain is less stable than the embedded Be1/3Zn2/3O grain. Otherwise, their relative stabilities are reverse. This clearly demonstrates that the formation of nano-sized Be1/3Zn2/3O grains is energetically more favorable than the formation of nano-sized BeO grains, in the ZnO matrix.
Lastly, we stress that since the relative stabilities between BeO and BeZnO at a finite size are comparable, as shown in Fig. 8, a typical BeZnO sample may be a heavy mixture of several ordered phases, including the two new structures and BeO, among others. Therefore, it would be very difficult to determine the properties (e.g. the XRD spectra) of the pure ordered BeZnO structures from the mixed phases in the experiment. We hope that these new structures can be detected in future experiments, and that every pure ordered structure can be synthesized.
Conclusions
In conclusion, we showed simulation evidence that the phase segregation exists universally in the BexZn1−xO alloy below a certain temperature. In the mixed phases, two new crystals of Be1/3Zn2/3O and Be2/3Zn1/3O are predicted to form favourably. We also demonstrated that the formation of nano-sized Be1/3Zn2/3O grains is energetically more favorable than the formation of nano-sized BeO grains in the ZnO matrix. These nano-sized Be1/3Zn2/3O grains can serve as a nucleation center for bigger crystallites. Hence, during the realistic phase segregation, there is less chance for the growth of BeO grains in the BeZnO alloy during the annealing process. Indeed, there exists no BeO grain in our systems except for the system with an over dosed Be content. We thus expect that both new BeZnO crystals can be experimentally synthesized via annealing a random alloy. Finally, we predicted that both Be1/3Zn2/3O and Be2/3Zn1/3O crystals are direct wide-gap semiconductors with band gap values of 4.88 eV and 6.78 eV, respectively. The band gap (4.88 eV) of Be1/3Zn2/3O is within the solar-blind spectrum range (4.4–5.6 eV). Hence, the Be1/3Zn2/3O crystal may find application in solar-blind UV devices.Acknowledgements
This work was financially supported by the National Natural Science Foundation of China (no. 51232009). XCZ is supported by a grant from USTC for Qianren-B (1000 Talents Plan B) summer research. The computational center of USTC is acknowledged for computational support.Notes and references
- Ü. Özgür, Y. I. Alivov, C. Liu, A. Teke, M. A. Reshchikov, S. Doğan, V. Avrutin, S.-J. Cho and H. Morkoç, J. Appl. Phys., 2005, 98, 044301 CrossRef PubMed.
- R. F. Service, Science, 1997, 276, 5314 Search PubMed.
- D. M. Bagnall, Y. F. Chen, Z. Zhu, T. Yao, S. Koyama, M. Y. Shen and T. Goto, Appl. Phys. Lett., 1997, 70, 2230–2232 CrossRef CAS PubMed.
- Z. K. Tang, G. K. L. Wong, P. Yu, M. Kawasaki, A. Ohtomo, H. Koinuma and Y. Segawa, Appl. Phys. Lett., 1998, 72, 3270 CrossRef CAS PubMed.
- A. Ohtomo, M. Kawasaki, T. Koida, K. Masubuchi, H. Koinuma, Y. Sakurai, Y. Yoshida, T. Yasuda and Y. Segawa, Appl. Phys. Lett., 1998, 72, 2466 CrossRef CAS PubMed.
- M. Sanati, G. L. Hart and A. Zunger, Phys. Rev. B: Condens. Matter, 2003, 68, 155210 CrossRef.
- A. Seko, F. Oba, A. Kuwabara and I. Tanaka, Phys. Rev. B: Condens. Matter, 2005, 72, 024107 CrossRef.
- X. F. Fan, H. D. Sun, Z. X. Shen, J. L. Kuo and Y. M. Lu, J. Phys.: Condens. Matter, 2008, 20, 235221 CrossRef CAS PubMed.
- H. L. Shi and Y. Duan, Eur. Phys. J. B, 2008, 66, 439–444 CrossRef CAS.
- I. V. Maznichenko, A. Ernst, M. Bouhassoune, J. Henk, M. Däne, M. Lüders, P. Bruno, W. Hergert, I. Mertig, Z. Szotek and W. M. Temmerman, Phys. Rev. B: Condens. Matter, 2009, 80, 144101 CrossRef.
- Y. G. Zhang, H. Y. He and B. C. Pan, Eur. Phys. J. B, 2011, 80, 395–400 CrossRef CAS.
- Y. G. Zhang, H. Y. He and B. C. Pan, J. Appl. Phys., 2011, 110, 124315 CrossRef PubMed.
- L. X. Su, Y. Zhu, Q. L. Zhang, M. M. Chen, X. Ji, T. Z. Wu, X. C. Gui, B. C. Pan, R. Xiang and Z. K. Tang, J. Phys. D: Appl. Phys., 2013, 46, 245103 CrossRef.
- Y. R. Ryu, T. S. Lee, J. A. Lubguban, A. B. Corman, H. W. White, J. H. Leem, M. S. Han, Y. S. Park, C. J. Youn and W. J. Kim, Appl. Phys. Lett., 2006, 88, 052103 CrossRef PubMed.
- W. J. Kim, J. H. Leem, M. S. Han, I.-W. Park, Y. R. Ryu and T. S. Lee, J. Appl. Phys., 2006, 99(9), 096104 CrossRef PubMed.
- J. M. Khoshman, D. C. Ingram and M. E. Kordesch, Appl. Phys. Lett., 2008, 92(9), 091902 CrossRef PubMed.
- C. Yang, X. M. Li, Y. F. Gu, W. D. Yu, X. D. Gao and Y. W. Zhang, Appl. Phys. Lett., 2008, 93(11), 112114 CrossRef PubMed.
- M. S. Han, J. H. Kim, T. S. Jeong, J. M. Park, C. J. Youn, J. H. Leem and Y. R. Ryu, J. Cryst. Growth, 2007, 303(2), 506–509 CrossRef CAS PubMed.
- D.-S. Park, J. J. Mudd, M. Walker, A. Krupski, D. Seghier, N. F. Saniee, C.-J. Choi, C.-J. Youn, S. R. C. McMitchell and C. F. McConville, CrystEngComm, 2014, 16(11), 2136–2143 RSC.
- M. Chen, Y. Zhu, L. Su, Q. Zhang, A. Chen, X. Ji, R. Xiang, X. Gui, T. Wu, B. Pan and Z. Tang, Appl. Phys. Lett., 2013, 102, 202103 CrossRef PubMed.
- L. Su, Y. Zhu, M. Chen, Q. Zhang, Y. Su, X. Ji, T. Wu, X. Gui, R. Xiang and Z. Tang, Appl. Phys. Lett., 2013, 103, 072104 CrossRef PubMed.
- D.-S. Park, A. Krupski, A. M. Sanchez, C.-J. Choi, M.-S. Yi, H.-H. Lee, S. R. C. McMitchell and C. F. McConville, Appl. Phys. Lett., 2014, 104, 141902 CrossRef PubMed.
- D.-S. Park, S. K. Vasheghani Farahani, M. Walker, J. J. Mudd, H. Wang, A. Krupski, E. B. Thorsteinsson, D. Seghier, C.-J. Choi, C.-J. Youn and C. F. McConville, ACS Appl. Mater. Interfaces, 2014, 6(21), 18758–18768 CAS.
- Y. Zhu, M. Chen, L. Su, Y. Su, X. Ji, X. Gui and Z. Tang, J. Alloys Compd., 2014, 616(0), 505–509 CrossRef CAS PubMed.
- X. F. Fan, Z. Zhu, Y.-S. Ong, Y. M. Lu, Z. X. Shen and J.-L. Kuo, Appl. Phys. Lett., 2007, 91, 121121 CrossRef PubMed.
- C. K. Gan, X. F. Fan and J.-L. Kuo, Comput. Mater. Sci., 2010, 49, S29–S31 CrossRef CAS PubMed.
- L. Dong and S. P. Alpay, Phys. Rev. B: Condens. Matter, 2011, 84, 035315 CrossRef.
- J. M. Sanchez, F. Ducastelle and D. Gratias, Physica A, 1984, 128, 334–350 CrossRef.
- M. Asta, C. Wolverton, D. de Fontaine and H. Dreyssé, Phys. Rev. B: Condens. Matter, 1991, 44, 4907–4913 CrossRef CAS.
- C. Wolverton, M. Asta, H. Dreyssé and D. de Fontaine, Phys. Rev. B: Condens. Matter, 1991, 44, 4914–4924 CrossRef CAS.
- J. Sanchez, Phys. Rev. B: Condens. Matter, 1993, 48, 14013–14015 CrossRef CAS.
- J. M. Sanchez, Phys. Rev. B: Condens. Matter, 2010, 81, 224202 CrossRef.
- A. van de Walle and G. Ceder, J. Phase Equilib. Diffus., 2002, 23, 348–359 CrossRef CAS.
- A. van de Walle and M. Asta, Modell. Simul. Mater. Sci. Eng., 2002, 10, 521–538 CrossRef CAS.
- A. van de Walle, M. Asta and G. Ceder, CALPHAD, 2002, 26, 539–553 CrossRef CAS.
- A. van de Walle, CALPHAD, 2009, 33, 266–278 CrossRef CAS PubMed.
- G. Hart and R. Forcade, Phys. Rev. B: Condens. Matter, 2008, 77, 224115 CrossRef.
- A. van de Walle, The Alloy Theoretic Automated Toolkit (ATAT), 2001, http://alum.mit.edu/www/avdw/atat/ Search PubMed.
- G. Kresse and J. Furthmuller, Phys. Rev. B: Condens. Matter, 1996, 54, 11169–11186 CrossRef CAS.
- J. P. Perdew, K. Burke and M. Ernzerhof, Phys. Rev. Lett., 1996, 77, 3865–3868 CrossRef CAS.
- M. Y. Lavrentiev, R. Drautz, D. Nguyen-Manh, T. P. C. Klaver and S. L. Dudarev, Phys. Rev. B: Condens. Matter, 2007, 75, 014208 CrossRef.
- K. Kawasaki, C. d. Domb and M. Green, Phase Transitions and Critical Phenomena, Academic, New York, 1972 Search PubMed.
- K. Binder and D. Heermann, Monte Carlo simulation in statistical physics: an introduction, Springer, 2010 Search PubMed.
- A. Togo, F. Oba and I. Tanaka, Phys. Rev. B: Condens. Matter, 2008, 78, 134106 CrossRef.
- A. Togo, phonopy, http://sourceforge.net/projects/phonopy.
- F. Oba, A. Togo and I. Tanaka, Phys. Rev. B: Condens. Matter, 2008, 77, 245202 CrossRef.
| This journal is © The Royal Society of Chemistry 2015 |

