 Open Access Article
Creative Commons Attribution 3.0 Unported Licence
Iron oxide nanorods as high-performance magnetic resonance imaging contrast agents†
Jeotikanta
Mohapatra
a,
Arijit
Mitra
b,
Himanshu
Tyagi
b,
D.
Bahadur
*ac and
M.
Aslam‡
*ab
aCentre for Research in Nanotechnology and Science (CRNTS), Indian Institute of Technology Bombay, Powai, Mumbai-400076, India. E-mail: dhirenb@iitb.ac.in; m.aslam@iitb.ac.in; Tel: +91-22-2576 7585, +91-22-2576 7632
bDepartment of Physics, Indian Institute of Technology Bombay, Powai, Mumbai-400076, India
cDepartment of Metallurgical Engineering and Materials Science, Indian Institute of Technology Bombay, Powai, Mumbai-400076, India
First published on 27th February 2015
Abstract
An efficient magnetic resonance imaging (MRI) contrast agent with a high R2 relaxivity value is achieved by controlling the shape of iron oxide to rod like morphology with a length of 30–70 nm and diameter of 4–12 nm. Fe3O4 nanorods of 70 nm length, encapsulated with polyethyleneimine show a very high R2 relaxivity value of 608 mM−1 s−1. The enhanced MRI contrast of nanorods is attributed to their higher surface area and anisotropic morphology. The higher surface area induces a stronger magnetic field perturbation over a larger volume more effectively for the outer sphere protons. The shape anisotropy contribution is understood by calculating the local magnetic field of nanorods and spherical nanoparticles under an applied magnetic field (3 Tesla). As compared to spherical geometry, the induced magnetic field of a rod is stronger and hence the stronger magnetic field over a large volume leads to a higher R2 relaxivity of nanorods.
1. Introduction
Magnetic nanoparticles (MNPs) have been established for use in various promising biomedical applications, such as contrast agents in magnetic resonance imaging (MRI),1–6 vectors in drug delivery7–9 and mediators to convert electromagnetic energy to heat.9–11 The MNP based MRI contrast agent can improve diagnosis in several pathologies.12,13 Iron oxide NPs (Fe3O4) of several formulations such as Resovist, Combidex and Feridex have been used as T2 weighted contrast agents to accelerate the R2 relaxivity of protons.13 However, these commercial contrast agents have relatively low R2 relaxivity, as they are synthesized in aqueous medium and consequently have poor crystallinity, large size dispersion (standard deviation: σ > 20%) and a compromised magnetic moment.14 The R2 relaxivity enhancement is mainly proportional to the saturation magnetization (MS) value and surface area of MNP. To achieve high performance i.e. darker contrast or shorter T2, several attempts have been made to improve the magnetic moment through control of the size, dopant and surface properties of MNPs.3,15–17 The size of iron oxide NPs is varied precisely (4–14 nm) by controlled crystallization through thermolysis of iron salt in organic surfactants. The magnetization of iron oxide NPs is also tailored by doping various transition metals such as Zn, Ni, Co, and Mn. Since both the surface area and MS increase with an increase of the NP size, a linear relationship is observed between R2 relaxivity vs. nanoparticle size.3 For example, Cheon et al. found that the R2 value of iron oxide NPs gradually increases from 78 mM−1 s−1 to 106, 130 and to 218 mM−1 s−1 as the NP size increases from 4 nm to 6, 9 and 12 nm, respectively.18 Despite all these improvements, it is further possible to optimize the magnetic properties, surface area and accordingly the R2 relaxivity of Fe3O4 nanoparticles by controlling the shape. The shape anisotropy could induce very strong localized magnetic field inhomogeneity, as the induced magnetic field strength also actively depends on the shape of the MNP, due to the so-called demagnetization effect.19 Although the anisotropic NPs have promising advantages over the spherical shape, the use of NPs with an anisotropic configuration has not been well demonstrated in the literature because their preparation is a challenging task as the surface energy favors the formation of spherical nanoparticles.20,21Our group has been exploring new materials with enhanced MR contrast properties over the last few years.22–26 To study the effect of shape on MRI contrast enhancement, we have synthesized spherical and faceted irregular (FI) CoFe2O4 nanostructures via a high temperature solution phase method.22 Similar sized FI structures with lower MS values than the spherical CoFe2O4 nanostructures show a higher R2 value. The enhanced contrast properties are attributed to the differences in surface area between spherical and FI nanostructures, which is higher in the case of FI nanostructures. Recently, Zhao et al. demonstrated that octapod Fe3O4 NPs of an edge length of 30 nm exhibit an ultra-high R2 relaxivity value (679.3 ± 30 mM−1 s−1) as compared to their spherical counterpart of similar material volume.27 The high R2 relaxivity of the octapod shaped NPs is believed to be due to their anisotropic shape, which renders a higher surface area than the spherical shape of their counterpart with a similar material volume. The increased surface area allows a greater number of hydrogen nuclei of water in proximity. Therefore, a greater number of neighboring nuclei are disturbed by the dipolar field of the NPs, resulting in faster relaxation. There are also few reports on the MRI contrast characteristics of nanorods (NRs) of paramagnetic compounds such as Dy(OH)3, Gd(OH)3 and β-FeOOH.28–30 Even though these paramagnetic compounds possess low magnetic moment (<10 emu g−1), due to higher surface area, their R2 relaxivity is found to be comparable to the commercial Fe3O4 NP contrast agents. Furthermore, as compared to spherical NPs, NRs offer longer blood circulation times, stronger interaction with tumors, enhanced retention at tumor sites and improved targeting efficiency, making them excellent candidates as targeting carriers or MRI contrast agents.31 To the best of our knowledge, there is no report on the MR contrast properties of Fe3O4 NRs.
Herein, we demonstrate a simple two step reaction strategy for the synthesis of uniform ‘colloidal’ magnetite nanorods (30–70 nm in length) with very high R2 relaxivity values. We found that the relaxation coefficient (R2) gradually increases from 312 to 608 mM−1 s−1 with an increase in the length of NRs; this increase is a consequence of magnetization enhancement as well as a sharp increase in the surface area due to anisotropic morphology. Although the spherical NPs exhibit higher magnetization than the NRs of the same material volume, a high relaxivity is realized for NRs. The enhanced MR contrast characteristics of NRs correspond to the larger surface area rendered due to the anisotropic morphology.
2. Experimental section
a. Preparation of β-FeOOH nanorods
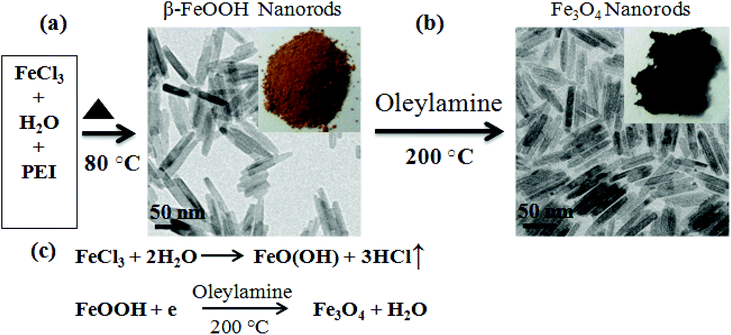
The rod-shaped FeOOH nanostructure was prepared by hydrolysis of FeCl3 aqueous solution. In a typical synthesis of 70 nm length FeOOH NRs, 20 mmol of FeCl3·6H2O was added into a round-bottom flask containing 100 ml of deionized water with 0.2 ml polyethyleneimine (PEI). The reaction mixture was heated at 80 °C under magnetic stirring for 2 h to obtain a uniform rod-shaped FeOOH nanostructure. The precipitate was separated by centrifugation and washed several times with deionized water and ethanol. The length of NRs is controlled from 25 to 70 nm by varying the PEI content to be 2, 1.5, 1, 0.5, 0.3 and 0.2 ml. Further, a decrease of PEI content to 0.1 ml and below transformed the rod-shape morphology of FeOOH to a spindle shaped structure of length above 100 nm.b. Preparation of Fe3O4 nanorods
Fe3O4 NRs were synthesized as follows: 500 mg of FeOOH nanorods and 25 mmol of oleylamine were taken in a three necked round bottom flask. Under a nitrogen atmosphere, the solution was heated to 200 °C for 4 h. The final product was subjected to magnetic separation and washed with a mixture of hexane and acetone several times to remove any uncoordinated amine molecules. The details of the synthesis approach are depicted in Scheme 1. The morphology of NRs was retained even after the reduction at 200 °C.c. Preparation of Fe3O4 nanoparticles
Uniform Fe3O4 nanoparticles (σ ≤ 15%) were prepared using our previously published protocol.32 In a typical synthesis of 6 nm Fe3O4 nanoparticles, a mixture of 5 mM of FeCl2 and 25 mM of oleylamine (amine to precursor molar ratio of 5![[thin space (1/6-em)]](https://www.rsc.org/images/entities/char_2009.gif) :
:![[thin space (1/6-em)]](https://www.rsc.org/images/entities/char_2009.gif) 1) was heated at 200 °C under an N2 atmosphere. The size was controlled with a molar ratio of the precursor to amine of 1
1) was heated at 200 °C under an N2 atmosphere. The size was controlled with a molar ratio of the precursor to amine of 1![[thin space (1/6-em)]](https://www.rsc.org/images/entities/char_2009.gif) :
:![[thin space (1/6-em)]](https://www.rsc.org/images/entities/char_2009.gif) 3 (9 nm) and 1
3 (9 nm) and 1![[thin space (1/6-em)]](https://www.rsc.org/images/entities/char_2009.gif) :
:![[thin space (1/6-em)]](https://www.rsc.org/images/entities/char_2009.gif) 7 (4 nm), respectively. To further increase the particle size above 9 nm, a seed-mediated growth model was utilized.33 For example, the smaller nanoparticles of 6 nm were first mixed (in a different quantity of 100 mg or 150 mg) with more precursor materials and the mixture was heated as per the above procedure to achieve 12 nm and 16 nm Fe3O4 nanoparticles, respectively.
7 (4 nm), respectively. To further increase the particle size above 9 nm, a seed-mediated growth model was utilized.33 For example, the smaller nanoparticles of 6 nm were first mixed (in a different quantity of 100 mg or 150 mg) with more precursor materials and the mixture was heated as per the above procedure to achieve 12 nm and 16 nm Fe3O4 nanoparticles, respectively.
d. Surface functionalization towards ‘colloidal’ suspension
To use these samples as MRI contrast agents, the as prepared Fe3O4 NRs were subjected to surface modification with polyethyleneimine (using the ligand exchange approach as depicted in Fig. S1†). 100 mg of the as prepared Fe3O4 NRs were dispersed in 10 mL of toluene and mixed with 10 ml of dimethylformamide (DMF) containing 2 ml of PEI. Under an N2 atmosphere, the mixture was then continuously stirred at 80 °C for 8 h. After the reaction, the final product was subjected to magnetic separation and washed with ethanol several times to remove uncoordinated PEI molecules. The functionalized nanorods were dispersed in deionized water and taken for phantom MRI imaging. Similarly to NRs, the aqueous suspension of the amine coated nanoparticles is also prepared by surface modification with polyethyleneimine (PEI).e. Characterization techniques
X-ray diffraction (XRD) spectra were recorded using an Xpert PANAlytic X-ray diffractometer with Cu Kα radiation (λ = 1.54 Å). FTIR spectra were recorded on a Bruker, Vertex-80 using a KBr pellet. The XPS analysis was performed with a Thermo VG Scientific MultiLab, ESCA Probe using Mg Kα (hν = 1253.6 eV) as the exciting source for identification of the elements and their oxidation states. The high-resolution transmission electron microscopy images and selected area diffraction patterns were obtained with a JEOL JEM 2100F field emission gun transmission electron microscope (FEG-TEM) at an accelerating voltage of 200 kV. Thermogravimetric analysis (TGA) of coated Fe3O4 NRs was carried out using a Perkin-Elmer Pyris instrument. TGA measurements were made from room temperature to 600 °C at a heating rate of 10 °C min−1. The ζ-potential measurements were carried out by using the Zetasizer nano series, Malvern Instruments. The magnetic properties of the samples were studied using the physical property measurement system (Quantum Design PPMS). The isothermal magnetization (M) versus the applied magnetic field (H), zero-field-cooled (ZFC), and field-cooled (FC) measurements were performed over the temperature range 10–300 K with an applied field of 40 kOe. The applied external field for ZFC and FC magnetization was 200 Oe. To measure the T2 relaxivity, the PEI protected Fe3O4 nanorods with different Fe concentrations (0.005–0.12) were diluted in DI water. The samples were scanned using a multi-echo T2-weighted fast spin echo imaging sequence (TR/TE = 3500/30, 45, 60, 75, 90 and 105 ms, slice thickness = 2 mm) by using a 3 T Philips Achieva MR scanner.3. Results and discussion
Fig. 1a shows the X-ray diffraction pattern of 70 nm FeOOH NRs produced by hydrolysis of FeCl3. All diffraction peaks of FeOOH are indexed to a tetragonal phase of β-FeOOH (ICDD 34-1266). Reduction of the β-FeOOH NRs in oleylamine at 200 °C transforms the phase to magnetite (Fe3O4) (Scheme 1). The XRD pattern in Fig. 1b confirms the transformation of β-FeOOH to Fe3O4. The calculated lattice parameter of Fe3O4 NRs is 8.39 Å, which is in agreement with the reported value (ICDD 19-629). For further confirmation of the magnetite phase formation (and not the maghemite phase), the X-ray photoelectron spectroscopy (XPS) spectrum is recorded after the reduction process (shown as Fig. 1c). The Fe3O4 nanorods show photoelectron peaks at 711.9 and 725.5 eV; the characteristic doublet (Fe2p3/2 and Fe2p1/2) of iron oxide matches very well with the magnetite i.e. Fe3O4 phase as has been reported in the literature.34,35 In the case of FeOOH nanorods, this doublet appears at 711 and 724.2 eV, respectively. In addition, a small characteristic satellite peak of the Fe2p spectrum (octahedral Fe3+) of the β-FeOOH sample appears at 720 eV. After phase transformation, this particular peak position shifts to 716 eV, a characteristic of Fe2+ presence in the octahedral site of the magnetite phase.34 This further confirms the phase conversion from β-FeOOH to Fe3O4.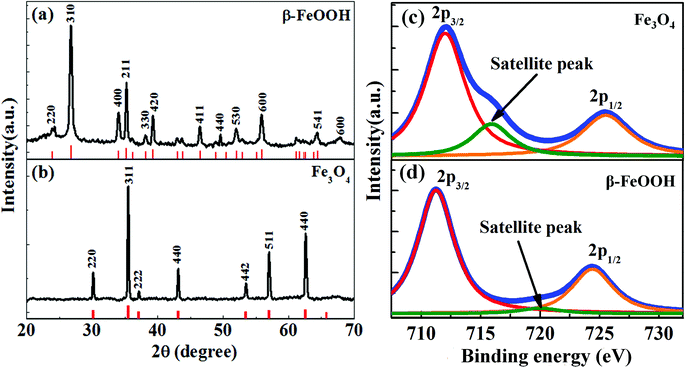 | ||
| Fig. 1 XRD patterns of (a) the as-synthesized β-FeOOH sample of length 70 nm and (b) Fe3O4 NRs produced after reduction of β-FeOOH in oleylamine. The XRD patterns of β-FeOOH and Fe3O4 are labeled with respect to standard ICDD cards (marked as red). The XPS spectra of (c) Fe3O4 and (d) β-FeOOH NRs of length 70 nm. After the phase change to Fe3O4, the characteristic satellite in the octahedral Fe3+ spectrum (β-FeOOH NRs) shifts to 716 eV which indicates the presence of Fe2+ in the octahedral site of the magnetite phase.35 | ||
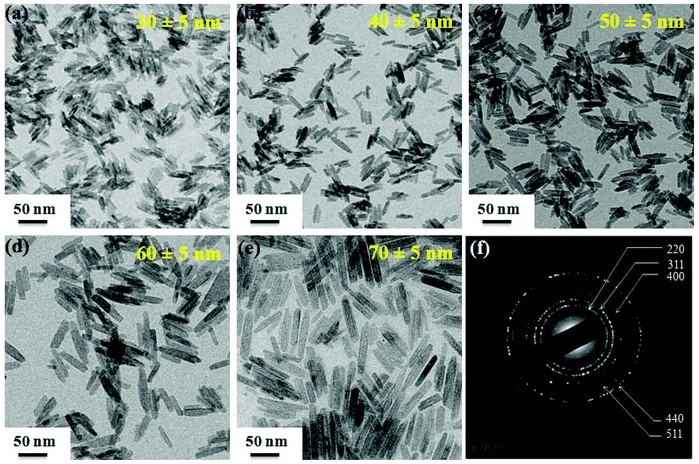
FeOOH NRs of different lengths and diameters are produced using PEI as the capping agent (Fig. S2, ESI†). It is found that in the absence of PEI, the prepared sample possesses a spindle shaped morphology with a larger length (150 nm) and diameter (35 nm). However, the addition of an appropriate amount of PEI to the reaction mixture leads to the formation of FeOOH NRs of thinner diameter. The average lengths of NRs obtained are 25, 30, 40, 50, 60 and 70 nm (standard deviation, σ ≤ 20%) for 2 ml, 1.5 ml, 1 ml, 0.5 ml, 0.3 ml and 0.2 ml of PEI, respectively. The effect of PEI amount on the shape, length and diameter of FeOOH particles is summarized in Table S1 (ESI†). We have found that by increasing the PEI concentration from 0.2 to 2 ml, the length and diameter of the FeOOH NRs can be controlled from 70 to 25 nm and 12 to 3 nm, respectively. This control over nanorods’ length and diameter with the PEI content is due to the adsorption of the protonized PEI on the lateral plane (200) of the nanorods.36,37 The NRs produced with 2 ml PEI content (25 nm in length) show poor crystallinity (Fig. S3a and b, ESI†). When FeOOH NRs are reduced to the Fe3O4 phase using oleylamine (which is multifunctional: acts as a solvent, and reducing and capping agent) at 200 °C, the shape and size of the nanorods are retained (Fig. 2a–e). The transformation of the phase (FeOOH to Fe3O4) and retention of the rod shape morphology could be due to the multifunctional properties (solvent, surfactant and reductant) of the oleylamine. In this case, oleylamine acts as an electron donor at elevated temperature (200 °C) and leads to the formation of Fe3O4 nanorods.38 However, the Fe3O4 sample produced from 25 nm length FeOOH NRs shows irregular shape and size (Fig. S3c and d, ESI†). This could be due to the amorphous nature of the initial precursor material (as confirmed from the XRD data), and the reduction process occurs through dissolution and recrystallization of FeOOH NRs.20 Selected area electron diffraction (SAED) measurements are taken to further confirm the crystalline phase of NRs (Fig. 2f). The SAED pattern of Fe3O4 NRs shows five prominent rings which could be indexed to reflections from the five crystal planes of (220), (311), (400), (511) and (440).32 This also supports the transformation of FeOOH to the Fe3O4 phase.
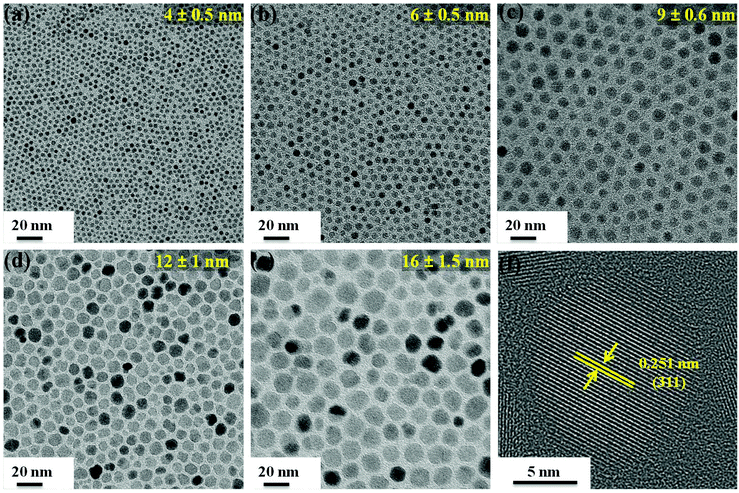
Fig. 3a–e shows the transmission electron microscopy (TEM) images of spherical Fe3O4 nanoparticles of sizes 4, 6, 9, 12 and 16 nm (standard deviation, σ ≤ 15%) prepared by thermolysis of FeCl2 in the presence of oleylamine as the multifunctional (solvent, reducing and surface functionalizing) agent. The TEM images confirm that the prepared nanoparticles are uniform in shape and size. The HRTEM image (Fig. 3f) confirms the crystallinity of the as synthesized nanoparticles with 0.251 nm d-spacing corresponding to the [311] plane. Similar to NRs, the aqueous suspensions of the amine coated nanoparticles were also prepared by surface modification with polyethyleneimine (PEI).
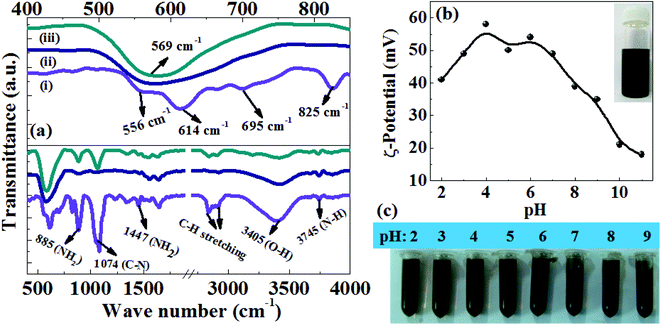
To prepare a stable colloidal suspension, the as prepared Fe3O4 NRs are subjected to surface modification with polyethyleneimine (PEI). The surface PEI molecular coating is confirmed by the Fourier transform infrared (FTIR) spectroscopy, thermogravimetric analysis (TGA) and ζ-potential measurements. Fig. 4a shows a comparative analysis of the FTIR spectra of PEI coated FeOOH (70 nm), oleylamine and PEI coated 70 nm Fe3O4 NRs. In the FeOOH sample, the low frequency bands at 556, 614, 695 and 825 cm−1 were assigned to the Fe–O vibrational modes in β-FeOOH.39 After reducing FeOOH at 200 °C in oleylamine, these bands disappear and a new peak appears at around 569 cm−1 which corresponds to the Fe–O vibrational mode (Fe3+ bond) at the octahedral and tetrahedral sites. The presence of a Fe–O vibrational mode at 569 cm−1 could be attributed to the magnetite phase of Fe3O4 since the Fe–O band for γ-Fe2O3 is usually seen at 540 cm−1.32 The strong IR peak in the range of 3745 cm−1 is assigned to the N–H stretching mode of the primary amine, while the C–N stretching, NH2 scissoring and NH2 wagging bands appear at 1074 cm−1, 1447 cm−1 and 885 cm−1, respectively.40 The bands at 2845 and 2920 cm−1 are assigned to vibrations from CH2 groups in the long chain of amine. In comparison with oleylamine–Fe3O4 NRs, the PEI–Fe3O4 samples show strong IR peaks of C–N stretching, NH2 scissoring and NH2 wagging which corroborate the presence of PEI on the surface of Fe3O4 NRs. The thermogravimetric degradation profiles (Fig. S4, ESI†) of the as-prepared and PEI-coated Fe3O4 NRs show prominent weight loss of 9% and 15% over the temperature range of 150–450 °C, which could be attributed to the decomposition of the organic molecules attached to the NRs surface. The increase of 6% weight loss after the surface modification of NRs confirms the presence of PEI on the nanorod surface. Further, the positive zeta potential values in the pH range 2–11 (Fig. 4b) also support the presence of the PEI amine groups at the NRs surface. The PEI modified Fe3O4 NRs are very stable as water colloids for about a month and no aggregation is observed (inset of Fig. 4b). There is no precipitation in water over a wide pH range (pH adjusted between 2 and 9 using HCl or NaOH) (Fig. 4c). Moreover, TEM micrographs show no change in size and shape after the ligand exchange with PEI at a temperature of 80 °C (Fig. S5, ESI†). The hydrodynamic diameters of the PEI functionalized Fe3O4 NRs are measured by dynamic light scattering (DLS: Fig. S6a–c, ESI†). The mean hydrodynamic diameters (Table S2, ESI†) are larger than the size obtained using TEM, due to the presence of associated and hydrated long chain PEI layers.41 The time dependent DLS study shows that the hydrodynamic size of the NRs does not change over a time frame of one week, indicating no aggregation of NRs.42 Such a stable PEI functionalized magnetite NR suspension is highly desirable for a wide range of biomedical applications, as the PEI coating has been found to enhance the nanoparticle uptake into cells and facilitates endosomal escape for the nucleotide delivery.43 Further, PEI also has a potential advantage in facilitating DNA and siRNA delivery.
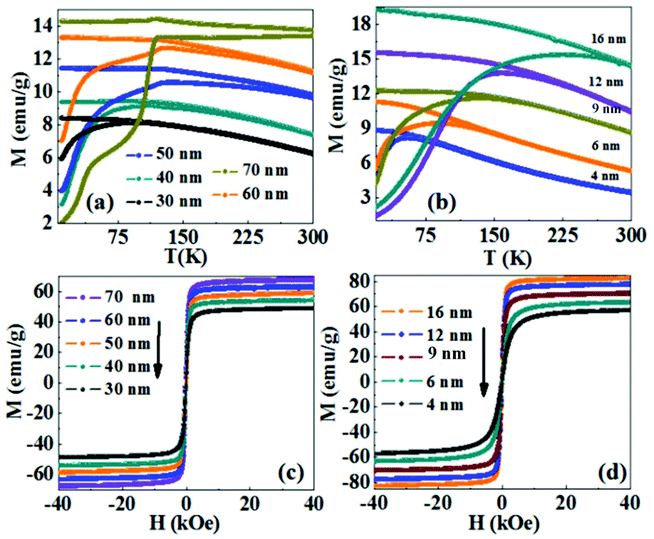
Fig. 5a shows the temperature dependence of the magnetization curve in the zero field cooled (ZFC) and field cooled (FC) protocols under an applied field of 200 Oe for the Fe3O4 NRs of different sizes. The blocking temperatures (TB) (i.e. the peak of the ZFC curve) for 30 nm and 40 nm Fe3O4 NRs are 80 K and 110 K, respectively. While for NRs of length above 40 nm, the blocking temperature is not observed and the features of the curve are interestingly dominated by Verwey transition observed at 120 K.44,45 Verwey transition is a characteristic property of Fe3O4 and is seen in perfect stoichiometry. In the case of smaller length NRs, the surface dead layer and surface oxidation makes the NRs sufficiently non-stoichiometric and thus Verwey transition is not observed. Fig. 5b shows the ZFC and FC magnetization data of the spherical nanoparticles of different sizes. With an increase in nanoparticles’ size from 4 to 16 nm, TB is observed to increase from 45 K to 240 K. The increase in TB is attributed to an increase in anisotropic energy with an increase in volume, which is consistent with the expression used to calculate the average blocking temperature <TB> = KeffV/25kB (where kB is the Boltzmann constant and Keff is the anisotropy constant).46 The room temperature hysteresis curves of the Fe3O4 NRs are shown in Fig. 5c. The coercivity and remanence values are not discernible at 300 K, indicating a superparamagnetic behavior of 30–70 nm length Fe3O4 NRs. The saturation magnetization (MS, magnetization at 40 kOe) gradually increases from 50 emu g−1 to 66 emu g−1 with an increase in the length of nanorods from 30 nm to 70 nm. The smaller magnetization values of nanorods as compared to the bulk value (92 emu g−1 for magnetite32) are believed to be due to the existence of a surface spin disorder layer, which decreases with the increase of the particle diameter. Interestingly, in comparison with NRs, the MS values of nanoparticles are higher (Fig. 5d). For example, the MS value for 50 nm NRs is 58 emu g−1, while that for the same volume of NPs (the volume of a 50 nm NR is nearly equal to that of 16 nm NPs, ESI,† Table S4) is 83 emu g−1. However, from the M(T) curve, we have seen Verwey transition (the bulk phenomenon) in 50–70 nm length NRs, which suggests the absence of a surface oxidized layer. Therefore, we believe that the low magnetization might be due to the surface spin canting as well as the shape anisotropy of the NRs, which prevents them from magnetizing in directions other than along their easy magnetic axis.47 For the random orientation of NRs, the projection of the magnetization vectors along the field direction is smaller than that for a collection of nanoparticles without the shape anisotropy effect.48
For in vitro applications, the cytocompatibility is investigated using the Sulphorhodamine-B (SRB) assay to assess whether these magnetite NRs have any deleterious biological properties (Fig. S7, ESI†). The SRB assay results indicate that the viability of the HeLa cells is not affected by the mere presence of NRs and the cells register normal growth, suggesting that the NRs are reasonably biocompatible and do not have any toxic effect for in vitro use. The SRB assay shows that nearly 90% of the cells are viable, even after incubation with 1 mg ml−1 of NRs.
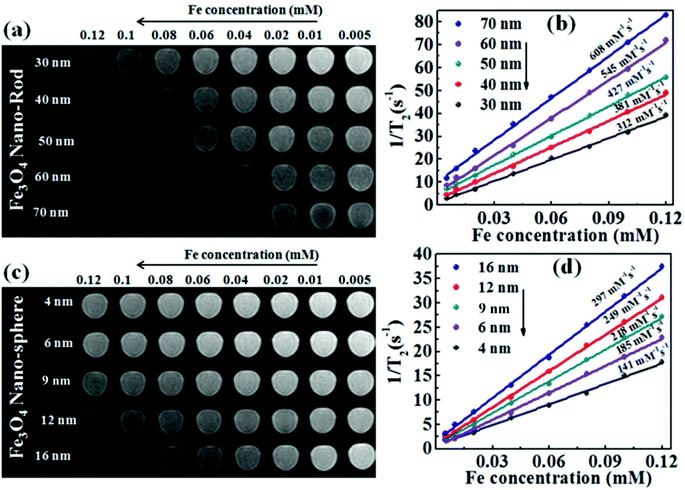
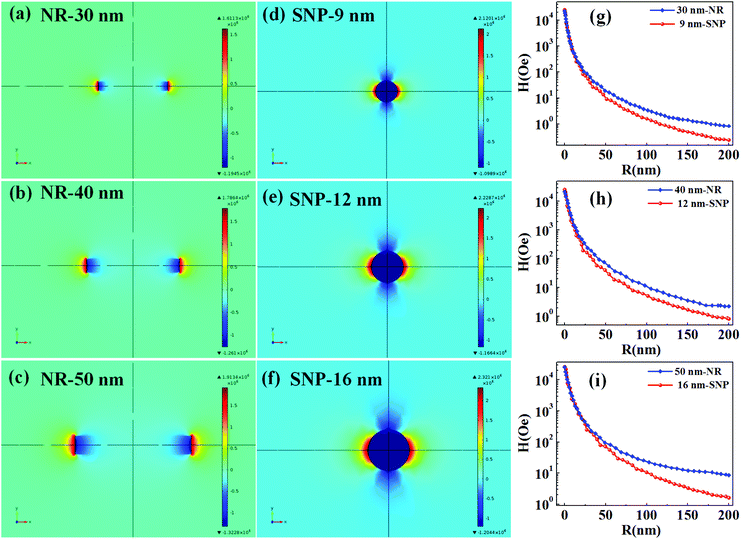
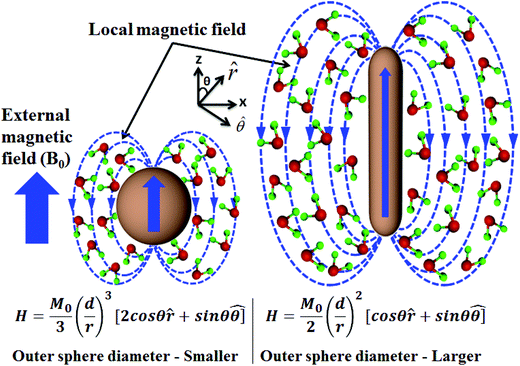
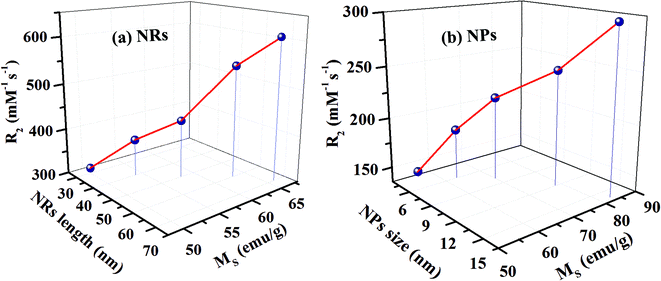
The T2 weighted MR images of PEI modified Fe3O4 NRs and NPs at different iron concentrations are recorded at 3 T. The obtained phantom image shows a significant signal attenuation on increasing the concentration of Fe from 0.005 to 0.12 mmol (Fig. 6a and c). The corresponding relaxation rates (R2 = 1/T2) exhibit a linear trend with the Fe concentration as shown in Fig. 6b and d. The R2 values for Fe3O4 NRs with lengths of 30, 40, 50, 60 and 70 nm are 312, 381, 427, 545 and 608 mM−1 s−1, respectively (Fig. 6b). The increasing trend of R2 values with the length of nanorods is possibly due to the enhancement of magnetization value as well as surface area (responsible for the field perturbation areas for the outer sphere protons), which was found to increase with increase of the NRs’ length. Fig. 6d shows that R2 relaxivity values of Fe3O4 NPs increase from 141 to 297 mM−1 s−1 with increase in the size from 4 to 16 nm. From the magnetic data, it is observed that the NPs exhibit higher magnetization values as compared to NRs, while the observed R2 is counter-intuitive and higher in the case of lower susceptibility nanorods. For example, the MS value of 16 nm Fe3O4 NPs is 83 emu g−1 and that of 50 nm NRs (equivalent material volume) is 58 emu g−1. Although the MS value of NRs is less than that of NPs by 25 emu g−1, the NRs exhibit nearly 1.5 times higher R2 value. Similarly, the 9 and 12 nm NPs have material volumes equivalent to those of 30 and 40 nm length NRs, respectively. However, the R2 values of NPs (9 nm, 218 mM−1 s−1 and 12 nm, 249 mM−1 s−1) are much lower than the NRs (30 nm, 312 mM−1 s−1 and 40 nm, 381 mM−1 s−1). The difference in R2 values between NRs and NPs of equivalent material volumes can be understood by considering the outer sphere theory, which comprises the diffusion and dephasing of protons around the magnetic field inhomogeneity of a magnetic nanoparticle. According to Hwang and Freed's theory, the R2 value is proportional to the square of MS and the effective magnetic diameter (eqn (S1), ESI† note A).27 In general, the MS value determines the local magnetic field inhomogeneity, and the effective diameter defines the field perturbation area for the outer sphere protons. The field perturbation area is directly related to the surface area of nanostructures, and in our case, the NRs possess a higher surface area than NPs of a similar solid volume (Table S4†). For example, the surface area of NRs of length 50 nm is nearly 1.5 times higher than the surface area of NPs of size 16 nm which has an equivalent material volume. Therefore, the NRs are considered to be able to generate a larger area of local field inhomogeneity as compared to NPs under an applied magnetic field. The local magnetic field generated by 9–16 nm NPs and 30–70 nm length NRs are calculated using Comsol Multiphysics. Fig. 7a–f shows the local magnetic field distribution outside the NPs and NRs of equivalent material volume at an applied magnetic field of 3 Tesla (the magnetic field distribution profile for NRs of length 60 and 70 nm are shown in Fig. S8, ESI†). The simulation results show a significantly stronger local field inhomogeneity created by the NRs than the NPs. Moreover, from the surface and further away the field intensity decreases slower for NRs than the NPs (Fig. 7g–i), which could be due to an anisotropic shape of the NRs. In general, the magnetic field induced outside a magnetized sphere varies with (1/r3), while in the case of a cylinder it varies with (1/r2), where ‘r’ is the distance away from the surface of the spherical/cylindrical rod object.49 Thus, the rod shape morphology and higher outer sphere diameter of the NRs render a strong local magnetic field over a larger volume as compared to NPs, although it possesses lower magnetic moment. As a result, a larger number of water protons experience a strong magnetic field over a large volume and rapidly de-phase, consequently a higher R2 value is realized for NRs than for the NPs of equivalent material volume. While for spherical NPs, due to the small volume of magnetic field variations, the water protons slowly diffuse around the nanoparticles and hence slowly de-phase, consequently a smaller R2 value is observed. Details of the water proton R2 relaxation due to NPs and NRs are shown in Scheme 2. Further, with an increase of NR length, the induced local magnetic field strength outside the NRs also increases (Fig. S8, ESI†) (this enhancement of local magnetic field strength is due to the increase of both the MS value and the surface area). As a result, with an increase of NR length from 30 to 70 nm, the R2 relaxivity value increases linearly from 312 to 608 mM−1 s−1 (Fig. 8a). A similar increasing trend in the R2 relaxivity values is also observed for nanoparticles (Fig. 8b). It is of interest to note that the highest R2 value 608 mM−1 s−1 observed for NRs of length 70 nm is nearly six times higher than the value reported for the commercial contrast agent (Ferumoxytol and 85 mM−1 s−1).23,50 In general, the rod shaped morphology offers longer blood circulation times and stronger interaction with tumors in comparison with spherical nanoparticles of equivalent hydrodynamic diameters.31 Hence, we believe that nanorods with superior T2 weighted contrast properties can improve clinical diagnosis sensitivity to a great extent.
4. Conclusions
In summary, we have successfully demonstrated a facile amine mediated reduction process for the synthesis of Fe3O4 NRs of 30–70 nm length and 4–12 nm diameter. As compared to conventional spherical nanoparticles, Fe3O4 NRs of similar material volume provide a superior T2 contrast effect with 1.5–2 times higher R2 value. The enhanced MRI contrast properties of nanorods are attributed to the higher surface area and anisotropic morphology which induces a stronger magnetic field perturbation over a larger volume more effectively for the outer sphere protons. With the increase of the length of Fe3O4 NRs, the R2 value increases sharply from 312 to 608 mM−1 s−1. This increasing trend of R2 values with the length of nanorods is due to enhancement of the magnetization value as well as outer sphere surface area. With given biocompatibility and low cytotoxicity, these iron oxide rod shaped structures appear to be promising contrast agents for MRI applications and in future we would like to conduct further in vivo cancer diagnostic studies with such anisotropic functionalized structures.Acknowledgements
We gratefully acknowledge the Industrial Research and Consultancy Center (IRCC), IIT Bombay and the Council of Scientific and Industrial Research (CSIR), New Delhi, the Nanomission of the Department of Science and Technology (DST), and the nanotechnology division of the Department of Electronics and Information Technology (DEITY), the Government of India for the financial support of this study. We are thankful to Dr Karthik Ganesan, SRL Diagnostics Pvt Ltd, Lower Parel, Mumbai for providing MRI instrument facilities. M. Aslam would also like to acknowledge a financial support from Prof. Vinayak P. Dravid, the Materials Science and Engineering Department, Northwestern University, Evanston, IL-60201.References
- J. Cheon and J.-H. Lee, Acc. Chem. Res., 2008, 41, 1630–1640 CrossRef CAS PubMed.
- Y.-w. Jun, J.-w. Seo and J. Cheon, Acc. Chem. Res., 2008, 41, 179–189 CrossRef CAS PubMed.
- J.-H. Lee, Y.-M. Huh, Y.-w. Jun, J.-w. Seo, J.-t. Jang, H.-T. Song, S. Kim, E.-J. Cho, H.-G. Yoon, J.-S. Suh and J. Cheon, Nat. Med., 2007, 13, 95–99 CrossRef CAS PubMed.
- N. Lee and T. Hyeon, Chem. Soc. Rev., 2012, 41, 2575–2589 RSC.
- J. R. McCarthy and R. Weissleder, Adv. Drug Delivery Rev., 2008, 60, 1241–1251 CrossRef CAS PubMed.
- E. Terreno, D. D. Castelli, A. Viale and S. Aime, Chem. Rev., 2010, 110, 3019–3042 CrossRef CAS PubMed.
- D. Yoo, J.-H. Lee, T.-H. Shin and J. Cheon, Acc. Chem. Res., 2011, 44, 863–874 CrossRef CAS PubMed.
- A.-H. Lu, E. L. Salabas and F. Schüth, Angew. Chem., Int. Ed., 2007, 46, 1222–1244 CrossRef CAS PubMed.
- J. Gao, H. Gu and B. Xu, Acc. Chem. Res., 2009, 42, 1097–1107 CrossRef CAS PubMed.
- J.-P. Fortin, C. Wilhelm, J. Servais, C. Ménager, J.-C. Bacri and F. Gazeau, J. Am. Chem. Soc., 2007, 129, 2628–2635 CrossRef CAS PubMed.
- J.-H. Lee, J.-t. Jang, J.-s. Choi, S. H. Moon, S.-h. Noh, J.-w. Kim, J.-G. Kim, I.-S. Kim, K. I. Park and J. Cheon, Nat Nanotechnol., 2011, 6, 418–422 CrossRef CAS PubMed.
- J. S. Weinstein, C. G. Varallyay, E. Dosa, S. Gahramanov, B. Hamilton, W. D. Rooney, L. L. Muldoon and E. A. Neuwelt, J. Cereb. Blood Flow Metab., 2009, 30, 15–35 CrossRef PubMed.
- H. B. Na, I. C. Song and T. Hyeon, Adv. Mater., 2009, 21, 2133–2148 CrossRef CAS PubMed.
- N. Lee, H. Kim, S. H. Choi, M. Park, D. Kim, H.-C. Kim, Y. Choi, S. Lin, B. H. Kim, H. S. Jung, H. Kim, K. S. Park, W. K. Moon and T. Hyeon, Proc. Natl. Acad. Sci. U. S. A., 2011, 108, 2662–2667 CrossRef CAS PubMed.
- J.-t. Jang, H. Nah, J.-H. Lee, S. H. Moon, M. G. Kim and J. Cheon, Angew. Chem., Int. Ed., 2009, 48, 1234–1238 CrossRef CAS PubMed.
- Z. Li, P. W. Yi, Q. Sun, H. Lei, H. Li Zhao, Z. H. Zhu, S. C. Smith, M. B. Lan and G. Q. Lu, Adv. Funct. Mater., 2012, 22, 2387–2393 CrossRef CAS PubMed.
- Y. Wang, Y. W. Ng, Y. Chen, B. Shuter, J. Yi, J. Ding, S. c. Wang and S. S. Feng, Adv. Funct. Mater., 2008, 18, 308–318 CrossRef CAS PubMed.
- Y.-W. Jun, Y.-M. Huh, J.-S. Choi, J.-H. Lee, H.-T. Song, Sungjun, S. Yoon, K.-S. Kim, J.-S. Shin, J.-S. Suh and J. Cheon, J. Am. Chem. Soc., 2005, 127, 5732–5733 CrossRef CAS PubMed.
- R. S. M. Rikken, R. J. M. Nolte, J. C. Maan, J. C. M. van Hest, D. A. Wilson and P. C. M. Christianen, Soft Matter, 2014, 10, 1295–1308 RSC.
- I. Milosevic, H. Jouni, C. David, F. Warmont, D. Bonnin and L. Motte, J. Phys. Chem. C, 2011, 115, 18999–19004 CAS.
- J. Wan, X. Chen, Z. Wang, X. Yang and Y. Qian, J. Cryst. Growth, 2005, 276, 571–576 CrossRef CAS PubMed.
- H. M. Joshi, Y. P. Lin, M. Aslam, P. V. Prasad, E. A. Schultz-Sikma, R. Edelman, T. Meade and V. P. Dravid, J. Phys. Chem. C, 2009, 113, 17761–17767 CAS.
- K. C. Barick, M. Aslam, Y.-P. Lin, D. Bahadur, P. V. Prasad and V. P. Dravid, J. Mater. Chem., 2009, 19, 7023–7029 RSC.
- M. Aslam, E. A. Schultz, T. Sun, T. Meade and V. P. Dravid, Cryst. Growth Des., 2007, 7, 471–475 CAS.
- K. C. Barick, S. Singh, D. Bahadur, M. A. Lawande, D. P. Patkar and P. A. Hassan, J. Colloid Interface Sci., 2014, 418, 120–125 CrossRef CAS PubMed.
- M. K. Jaiswal, M. De, S. S. Chou, S. Vasavada, R. Bleher, P. V. Prasad, D. Bahadur and V. P. Dravid, ACS Appl. Mater. Interfaces, 2014, 6, 6237–6247 CAS.
- Z. Zhao, Z. Zhou, J. Bao, Z. Wang, J. Hu, X. Chi, K. Ni, R. Wang, X. Chen, Z. Chen and J. Gao, Nat. Commun., 2013, 4, 2266 Search PubMed.
- K. Kattel, J. Y. Park, W. Xu, H. G. Kim, E. J. Lee, B. A. Bony, W. C. Heo, S. Jin, J. S. Baeck, Y. Chang, T. J. Kim, J. E. Bae, K. S. Chae and G. H. Lee, Biomaterials, 2012, 33, 3254–3261 CrossRef CAS PubMed.
- S. Huang, J. Liu, D. Liu and Q. Yuan, New J. Chem., 2012, 36, 1335–1338 RSC.
- M.-L. Chen, L.-M. Shen, S. Chen, H. Wang, X.-W. Chen and J.-H. Wang, J. Mater. Chem. B, 2013, 1, 2582–2589 RSC.
- B. Sitharaman, Nanobiomaterials handbook, CRC Press, 2011 Search PubMed.
- J. Mohapatra, A. Mitra, D. Bahadur and M. Aslam, CrystEngComm, 2013, 15, 524–532 RSC.
- A. Mitra, J. Mohapatra, S. S. Meena, C. V. Tomy and M. Aslam, J. Phys. Chem. C, 2014, 118, 19356–19362 CAS.
- A. P. Grosvenor, B. A. Kobe, M. C. Biesinger and N. S. McIntyre, Surf. Interface Anal., 2004, 36, 1564–1574 CrossRef CAS PubMed.
- T. J. Daou, G. Pourroy, S. Bégin-Colin, J. M. Grenèche, C. Ulhaq-Bouillet, P. Legaré, P. Bernhardt, C. Leuvrey and G. Rogez, Chem. Mater., 2006, 18, 4399–4404 CrossRef CAS.
- L.-Y. Chen, Y.-T. Yin, C.-H. Chen and J.-W. Chiou, J. Phys. Chem. C, 2011, 115, 20913–20919 CAS.
- J.-M. Moon and A. Wei, J. Phys. Chem. B, 2005, 109, 23336–23341 CrossRef CAS PubMed.
- S. Mourdikoudis and L. M. Liz-Marzán, Chem. Mater., 2013, 25, 1465–1476 CrossRef CAS.
- E. Murad and J. L. Bishop, Am. Mineral., 2000, 85, 716–721 CAS.
- M. Chen, Y.-G. Feng, X. Wang, T.-C. Li, J.-Y. Zhang and D.-J. Qian, Langmuir, 2007, 23, 5296–5304 CrossRef CAS PubMed.
- J. K. Armstrong, R. B. Wenby, H. J. Meiselman and T. C. Fisher, Biophys. J., 2004, 87, 4259–4270 CrossRef CAS PubMed.
- P. K. Kandel, L. P. Fernando, P. C. Ackroyd and K. A. Christensen, Nanoscale, 2011, 3, 1037–1045 RSC.
- T. Xia, M. Kovochich, M. Liong, H. Meng, S. Kabehie, S. George, J. I. Zink and A. E. Nel, ACS Nano, 2009, 3, 3273–3286 CrossRef CAS PubMed.
- G. Joaquín and S. Gloria, J. Phys.: Condens. Matter, 2004, 16, R145 CrossRef.
- W. Friedrich, J. Phys.: Condens. Matter, 2002, 14, R285 CrossRef.
- J. Mohapatra, A. Mitra, D. Bahadur and M. Aslam, J. Alloys Compd., 2015, 628, 416–423 CrossRef CAS PubMed.
- J. Wan, Y. Yao and G. Tang, Appl. Phys. A, 2007, 89, 529–532 CrossRef CAS.
- H. Sun, B. Chen, X. Jiao, Z. Jiang, Z. Qin and D. Chen, J. Phys. Chem. C, 2012, 116, 5476–5481 CAS.
- J. F. Schenck, Med. Phys., 1996, 23, 815–850 CrossRef CAS.
- S. Xuan, Y.-X. J. Wang, J. C. Yu and K. Cham-Fai Leung, Chem. Mater., 2009, 21, 5079–5087 CrossRef CAS.
Footnotes |
| † Electronic supplementary information (ESI) available. See DOI: 10.1039/c5nr00055f |
| ‡ Visiting scholar, Materials Science and Engineering Department, Northwestern University, Evanston, IL-60201, USA. |
| This journal is © The Royal Society of Chemistry 2015 |

