 Open Access Article
Creative Commons Attribution 3.0 Unported Licence
Tuning the dielectric properties of metallic-nanoparticle/elastomer composites by strain
Patrick
Gaiser
,
Jonas
Binz
,
Bruno
Gompf
*,
Audrey
Berrier
and
Martin
Dressel
Physikalisches Institut, Universität Stuttgart, Pfaffenwaldring 57, 70550 Stuttgart, Germany. E-mail: b.gompf@physik.uni-stuttgart.de
First published on 10th February 2015
Abstract
Tunable metal/dielectric composites are promising candidates for a large number of potential applications in electronics, sensor technologies and optical devices. Here we systematically investigate the dielectric properties of Ag-nanoparticles embedded in the highly flexible elastomer poly-dimethylsiloxane (PDMS). As tuning parameter we use uniaxial and biaxial strain applied to the composite. We demonstrate that both static variations of the filling factor and applied strain lead to the same behavior, i.e., the filling factor of the composite can be tuned by application of strain. In this way the effective static permittivity εeff of the composite can be varied over a very large range. Once the Poisson's ratio of the composite is known, the strain dependent dielectric constant can be accurately described by effective medium theory without any additional free fit parameter up to metal filling factors close to the percolation threshold. It is demonstrated that, starting above the percolation threshold in the metallic phase, applying strain provides the possibility to cross the percolation threshold into the insulating region. The change of regime from conductive phase down to insulating follows the description given by percolation theory and can be actively controlled.
1 Introduction
Flexible metal-dielectric composites with a high dielectric constant enable a large number of applications in charge-storage capacitors, electrostriction artificial muscles or in general in flexible organic electronics.1–5 Several studies have investigated the mechanical tunability of the optical properties and plasmonic behavior of thin metallic films6 or nanoparticles either in two-dimensional7–9 or three-dimensional10,11 metallo-dielectric composites using elastomeric substrates.The physics behind these applications is the well-known dependence of the electric and dielectric properties of metal-dielectric composites on the metal filling factor, as described by percolation theory. The geometrical framework of this theory and the associated concepts of critical phenomena, scaling behavior and fractality are applicable on a wide variety of systems. The results are especially independent on the specific size or shape of the system under investigation. For electrical or optical measurements this size-independence is given as long as the long wavelength limit is fulfilled, which for low-frequency investigations is clearly the case. In systems consisting of randomly distributed metal nanoparticles in a dielectric host, the dc-conductivity exhibits an abrupt change when the metal concentration reaches a critical value fc – the percolation threshold – and becomes metallic. This jump becomes manifest in a divergence of the real part of the static dielectric constant at the insulator-to-metal transition. For a finite conductivity of the host material, theory predicts that this divergence is limited to a maximum.12 As shown in ref. 12, the divergence can be qualitatively interpreted by the increased capacitive coupling between adjacent particles with increasing filling factor. Each pair of nearest particles forms a capacitor, which effective surface tends to infinity and its distance to zero at the percolation threshold. Therefore the effective capacity of the system diverges.
Near fc the electrical and optical behavior is governed by scaling laws.13 At the percolation threshold values of the real part of the permittivity of up to 105 have been reported in ferroelectric/metal composites.14 At low frequencies and for a vanishing conductivity of the insulating host, the divergence of the real part of the permittivity of the composite material εeff can be described by:
 | (1) |
 | (2) |
 | (3) |
Following this route in recent years a number of papers were published on the electrical and mechanical properties of composites composed of an elastomer such as poly-dimethylsiloxane (PDMS) together with metallic nanoparticles (NP) or carbon nanotubes.15–18
It was shown that the unique elastic properties of PDMS are indeed preserved even in the metallic state, i.e., for metal filling factors above the percolation threshold.19 This allows for tuning the electrical resistance of the composites by stretching the elastomer.20 Here we systematically show that both below and even across the percolation threshold the dielectric properties can be tuned by stretching the PDMS/silver-nanoparticle composites over a wide range and that the change of the strain dependent filling factor directly follows from the elastic properties of the elastomer. Additionally it is shown that, in the case of biaxial stretching, the larger volume change leads to a stronger strain dependence of the dielectric properties compared to the uniaxial case.
2 Experimental
Ag-nanoparticle powder was bought from Ionic Liquids. They were fabricated by plasma vapor deposition and handled under Ar atmosphere. The particles are not covered by any ligand or stabilization layer. The size distribution was verified by transmission electron microscopy and the average particle size is about 35 nm with a broad distribution spanning up to 100 nm. The samples were prepared by mixing the Ag-nanoparticles with PDMS (Sylgard 184, Dow Corning) in the respective volume fractions. Even though the volume fractions can be obtained from the weighted masses very accurately, the effective filling factor depends sensitively on the homogeneity of the sample. In the following the experimental filling factor calculated from the weighted masses will be called nominal filling factor. It can be determined with an accuracy of about 0.2%. Within the sample the local filling factor can exhibit larger variations due to possible inhomogeneities. In order to ensure homogeneity of all the samples, the Ag-nanoparticle powder (Ag-NP) was thoroughly ground with a mortar and mixed with pure PDMS which was prepared in a 10![[thin space (1/6-em)]](https://www.rsc.org/images/entities/char_2009.gif) :
:![[thin space (1/6-em)]](https://www.rsc.org/images/entities/char_2009.gif) 1 ratio of elastomer and hardener. Upon mixing, the composites with filling factors near to the percolation threshold became a viscous and homogeneous liquid, an important precondition for reliable stretching experiments. Afterwards, the liquid was stirred in an ultrasonic bath and then degassed in a desiccator, for 15 min. To ensure the reproducible curing of the samples, the liquid was cast into a petri dish with a thickness not exceeding 1 mm and degassed again for 10 min. Then, the liquid was cured for 120 min at 120 °C and subsequently cut into smaller pieces. Prior to the measurements the homogeneity of the samples were checked by optical microscopy. Good samples look uniformly grey and no homogeneities could be resolved. In particular, even after stretching, no buckling was to be seen.
1 ratio of elastomer and hardener. Upon mixing, the composites with filling factors near to the percolation threshold became a viscous and homogeneous liquid, an important precondition for reliable stretching experiments. Afterwards, the liquid was stirred in an ultrasonic bath and then degassed in a desiccator, for 15 min. To ensure the reproducible curing of the samples, the liquid was cast into a petri dish with a thickness not exceeding 1 mm and degassed again for 10 min. Then, the liquid was cured for 120 min at 120 °C and subsequently cut into smaller pieces. Prior to the measurements the homogeneity of the samples were checked by optical microscopy. Good samples look uniformly grey and no homogeneities could be resolved. In particular, even after stretching, no buckling was to be seen.
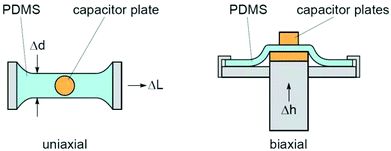
The stretching dependent dielectric constant was determined in specifically designed set-ups, for uniaxial and biaxial stretching respectively, which allow accurate capacitance measurements under defined stretching conditions by independently determining the thickness of the sample (see Fig. 4). The capacitance itself was measured by a capacitance bridge (Andeen Hagerling, AH2550A) at 1 kHz. To account for stray fields in the finite capacitor plates and for parasitic capacitance coming from cables and the set-up all values were corrected by comparison with samples having a well-known dielectric constant (air or PDMS) by the means of an effective capacitor plate area and an offset capacitance.
3 Elastic properties of Ag-NP/PDMS composites
Before one can calculate the strain dependent filling factor of Ag-NP in the composites, the volume change of the samples under applied strain has to be known. The Poisson's ratio ν of the samples was determined from the measured thickness and length changes under uniaxial strain as measured from calibrated optical microscope pictures: | (4) |
 is the applied strain. Here L0 and L are the length of the sample before and after stretching, respectively. The Poisson's ratio is a measure of the transverse contraction of the material with respect to its longitudinal elongation. A Poisson's ratio of 0.5 would indicate that there is no volume change of the sample under strain. The PDMS samples investigated in this work have all a Poisson's ratio smaller than 0.5, indicating an increase of volume upon stretching. As an example, Fig. 2 shows the dependence of the Poisson's ratio ν on applied uniaxial strain for a sample with an Ag-NP filling factor of f = 9% measured in the range 0% to 30% stretching. For all samples under investigation the Poisson's ratio ν is basically constant, i.e., independent of the applied strain and filling factor in the strain range used in our study. The fit yields ν = 0.34, a value also found in our experiments for pure PDMS and all other composites under investigation up to filling factors of f ∼ 15%. As a consistency check, using this Poisson's ratio, the capacitance measurements yield a strain independent dielectric constant for pure PDMS of about εr = 2.7 at 1 kHz, in good agreement with literature values.21
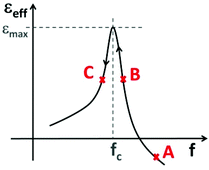 | ||
| Fig. 1 Schematic illustration of the static dielectric constant εeffvs. filling factor f. At point A the dependence can be described by eqn (2) and at point C by eqn (1). The maximum is given by eqn (3). The arrows indicate the decrease of the filling factor by stretching (based on ref. 12). | ||
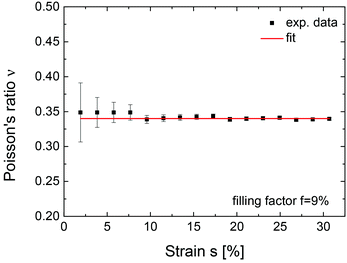 | ||
| Fig. 2 The Poisson's ratio of Ag-NP/PDMS composites is independent of the applied strain and independent of the Ag-NP filling factor f in the range 0–15%. | ||
4 Dielectric properties of the composite
First we investigate the dependence of the dielectric constant εeff on the filling factor f of the Ag-NP. In Fig. 3 the dependence of εeff is plotted for 19 different samples with nominal filling factors varied between 0 (pure PDMS) and f = 14.2%, a filling factor just before the samples become metallic. As expected from percolation theory, the measured dielectric constant εeff increases with increasing filling factor f and tends to diverge near the critical filling factor reaching values above 160. Below the percolation threshold, the experimental data can be fitted by eqn (1) resulting in a critical filling factor of fc = 14.3% and a critical exponent of p = 0.8, values in good agreement with percolation theory.13 Due to the extremely sharp dependence of eqn (1) on fc around the percolation threshold, fc can be determined from the fit in Fig. 3 with an accuracy of ±0.05%. The behavior can also be described quite well by Bruggeman's effective medium approximation (BEMA)17: | (5) |
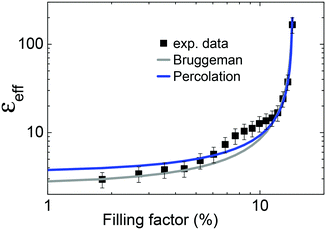 | ||
| Fig. 3 Dielectric constant εeff as a function of the filling factor f for 19 different Ag-NP/PDMS samples. The data can be fitted by the BEMA (eqn (5)) as well as by the scaling law given in eqn (1). Error bars in the nominal filling factor are smaller than the symbol size. | ||
5 Uniaxial and biaxial strain
The effect of uniaxial strain s on a PDMS sample leads, on the one hand, to an elongation of the sample in the direction of the applied force (ΔL) and on the other hand to sample shrinkage in the other two directions (see Fig. 4). Under the assumption of an isotropic stretching behavior and neglecting higher order terms this leads to a volume change which can be described by | (6) |
In the case of biaxial stretching the sample is isotropically stretched in the film plane while only the thickness shrinks. This leads to twice the volume change as in the uniaxial case
 | (7) |
Assuming that only the volume of the elastomer is increased upon stretching by Vg = V + ΔV and the volume of the embedded Ag-NP stays constant the strain dependent filling factors are given by
 | (8) |
 | (9) |
Fig. 4 displays a schematic drawing of both set-ups used in this work. The change in the dielectric constant induced by the applied strain is measured by small capacitor plates placed below and above the samples, in the middle of the stretched region. The two plates are pressed against the sample by small springs to compensate for the strain induced shrinking of the sample height. All strain dependent measurements were performed with unstretched freshly prepared samples. All the results presented in this manuscript have been successfully reproduced by independently produced samples. All the samples gave rise to identical behavior when stretched the first time. Some of the samples have been stretched up to 60%, which is over the threshold to the plastic regime of the sample, they have shown an hysteresis of about 20% upon release of the strain. However after the complete stretch/release cycle was completed the capacitance value ended up at the same point, within the error bars. For samples stretched within the elastic regime, even smaller deviations are to be expected. However, since in loading–unloading cycles the samples exhibit a slight hysteresis, we present only first time stretched data here.
Fig. 5 shows the strain dependent dielectric constant εeff for an Ag-NP/PDMS composite with a nominal starting filling factor of f0 = 10.6% up to a strain of 54% in the case of uniaxial stretching. The strain induced reduction of the filling factor f leads to a continuous decrease of the effective dielectric constant of the composite. At the highest applied strain the filling factor is reduced to f = 9.2%, i.e., roughly by 10%.
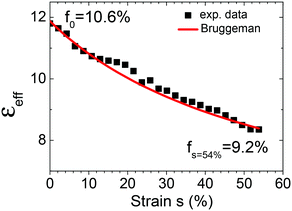 | ||
| Fig. 5 Uniaxial-strain dependent dielectric constant of an Ag-NP/PDMS composite with a nominal starting filling factor of f0 = 10.6%. The line curve is calculated by inserting eqn (8) into eqn (5) without using any free fit parameters. | ||
Over the same range the effective dielectric constant is reduced from 11.8 to 8.3 corresponding to a reduction of roughly 30%. By inserting eqn (8) into eqn (5) the expected change of the effective dielectric constant can be calculated without using any free fit parameters. The agreement between the experimental data and the calculated values is extremely good. This has two main implications: the BEMA nicely describes the effective dielectric constant of the composite if D = fc is interpreted as the critical filling factor and the strain dependent change of the filling factor can be simply described by the Poisson's ratio ν of the composite.
In Fig. 6, the result for an Ag-NP/PDMS composite with a nominal starting filling factor of f0 = 14.2% is shown. At this high starting filling factor close to the critical value fc, an applied uniaxial strain of 36% reduces the dielectric constant by nearly a factor of 5, whereas the filling factor is only reduced from 14.2% to about 12.6%. The inset shows the strain dependent filling factor calculated from eqn (8). The line curve in the main panel gives the calculated effective dielectric constant obtained by inserting eqn (8) into eqn (5). For filling factors close to the percolation threshold the strain dependent capacitance measurements exhibit much larger fluctuations, leading to larger discrepancies between measurement and calculation. The main reason for the fluctuations is the presence of losses in the sample due to a non-vanishing conductivity, i.e., ε cannot be treated as purely real anymore.
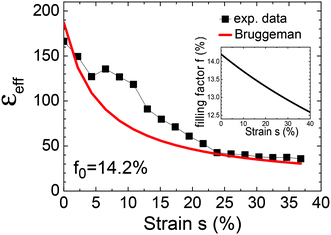 | ||
| Fig. 6 Dielectric constant vs. uniaxial strain of an Ag-NP/PDMS composite with a nominal starting filling factor of f0 = 14.2% close to the percolation threshold. The inset helps converting the strain dependent filling factor based on eqn (8). The line curve is calculated by inserting eqn (8) into eqn (5). | ||
These fluctuations become even larger for filling factors above the percolation threshold. In fact for uniaxial stretching it was not possible to cross the percolation threshold by starting with a metallic sample due to the required too high strain. From eqn (9) one expects a larger change of the filling factor for the same strain in the case of biaxial stretching. Therefore we perform additional measurements under biaxial strain for different nominal starting filling factors f0 ranging from 5% to 11%. In Fig. 7 the results are shown for three different f0. In the figure the changes of εeff due to the applied biaxial strain s are directly plotted as a function of the filling factor f(s) as calculated by eqn (9). For all three samples the strain was varied from 0 to about 40%. The additionally continuous line is calculated from the BEMA (eqn (5)) without any free fit parameter. The very good agreement between calculation and measurement shows that the filling factor can also be nicely tuned by applying biaxial strain.
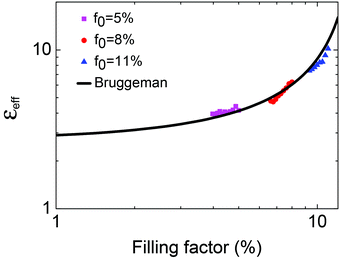 | ||
| Fig. 7 Dielectric constant vs. filling factor f under biaxial stain for three different starting filling factors f0. The respective filling factor changes were calculated by eqn (9) and the ranges correspond to maximum applied strains of about 40%. The continuous line is calculated from eqn (5) without using any free fit parameters. | ||
In contrast to the case of uniaxial stretching, it is possible now to cross the percolation threshold under biaxial stretching. In Fig. 8 the change of the dielectric constant under biaxial strain is shown for an Ag-NP/PDMS composite with a starting filling factor slightly above the percolation threshold (fc ∼ 15%). For clarity on the x-axis f − fc is plotted to demonstrate that the huge changes due to the divergence at fc happens within ±1% left and right of the percolation threshold. It is to be noted that first order phase transitions are governed by large fluctuations at the critical point. For metal-to-insulator transitions this is manifested in huge conductivity fluctuations around the percolation threshold which in principle leads to fluctuating values. Every individual measured sample will therefore follow only qualitatively the predicted overall behaviour at the critical density. Above the percolation threshold, εeff is not purely real anymore and the fluctuations are large due to the fragile conducting networks in this region. Nevertheless biaxial stretching leads in this case first to an increase of εeff, reaching values of about 250 and then under further stretching to a steep decrease, following the sketched behavior of Fig. 1, going from point A to C. The lines and the triangle are calculated from the eqn (1)–(3), respectively, according to the scheme in Fig. 1. Although the agreement with theory above the percolation threshold is not as perfect as below the percolation threshold, the overall behavior is quantitatively well reproduced. For instance the zero-crossing of εeff occurs slightly above fc. Between fc and the zero-crossing of εeff, the composite has a positive εeff although some narrow conducting paths exist (point B in Fig. 1), a behavior already shown for thin percolating metal films.26
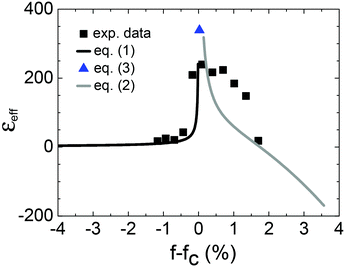 | ||
| Fig. 8 Dielectric constant vs. biaxial strain for an Ag-NP/PDMS composite with a starting filling factor above the percolation threshold. The lines and the triangle are calculated from eqn (1)–(3), respectively. | ||
6 Conclusions
In this investigation we have shown that it is possible to tune the dielectric constant of Ag-NP/elastomer composites by applying uniaxial and biaxial strain over a wide range. The strain dependent dielectric function follows thereby the strain dependent filling factor. The strain dependent filling factor is given by the expected volume change upon strain and depends only on the Poisson's ratio of the composite. Owing to the larger volume change in the case of biaxial strain, the tuning capability is larger compared to the uniaxial case. Below the percolation threshold the dielectric behavior can be nicely described by percolation theory as well as by the BEMA. Percolation theory is even able to correctly describe the divergence of εeff across the percolation. Here huge values of the dielectric constant of over 250 can be observed. This tunability opens up many novel applications in sensing or plastic electronics, where a controlled tuning of the dielectric/conductive properties of the composite materials is required.Acknowledgements
The work was financially supported by the Deutsche Forschungs-gemeinschaft under DR 228/38-1. A.B. acknowledges support by the Carl-Zeiss-Stiftung.Notes and references
- J. A. Rogers, T. Someya and Y. Huang, Science, 2010, 327, 1603 CrossRef CAS PubMed.
- T. Sekitani, H. Nakajima, H. Maeda, T. Fukushima, T. Aida, K. Hata and T. Someya, Nat. Mater., 2009, 8, 494 CrossRef CAS PubMed.
- Q. M. Zhang, H. Li, M. Poh, F. Xia, Z.-Y. Cheng, H. Xu and C. Huang, Nature, 2002, 419, 284 CrossRef CAS PubMed.
- T. Mirfakhrai, J. D. W. Madden and R. Baughman, Mater. Today, 2007, 10, 30 CrossRef CAS.
- T. Sekitani, U. Zschieschang, H. Klauk and T. Someya, Nat. Mater., 2010, 9, 1015 CrossRef CAS PubMed.
- S. Rehwald, M. Berndt, F. Katzenberg, S. Schwieger, E. Runge, K. Schierbaum and D. Zerulla, Phys. Rev. B: Condens. Matter, 2007, 76, 085420 CrossRef.
- X. Zhu, L. Shi, X. Liu, J. Zi and Z. Wang, Nano Res., 2010, 3, 807 CrossRef CAS.
- M. G. Millyard, F. M. Huang, R. White, E. Sprigone, J. Kivioja and J. Baumberg, Appl. Phys. Lett., 2012, 100, 073101 CrossRef PubMed.
- T. Vossmeyer, C. Stolte, M. Ijeh, A. Kornowski and H. Weller, Adv. Funct. Mater., 2008, 18, 1611 CrossRef CAS.
- Y. Kim, J. Zhu, B. Yeom, M. Di Prima, X. Su, J.-G. Kim, S. J. Yoo, C. Uher and N. A. Kotov, Nature, 2013, 500, 59 CrossRef CAS PubMed.
- D. Ryu, K. J. Loh, R. Ireland, M. Karimzada, F. Yaghmaie and A. M. Gusman, Smart Struct. Syst., 2011, 8, 471 CrossRef.
- A. L. Efros and B. I. Shklovskii, Phys. Status Solidi, 1976, 76, 475 CrossRef CAS.
- J. P. Clerc, G. Giraud, J. M. Laugier and J. M. Luck, Adv. Phys., 1990, 39, 191 CrossRef CAS.
- C. Pecharroman, F. Esteban-Betegon, J. F. Bartolome, S. Lopez-Esteban and J. S. Moya, Adv. Mater., 2001, 13, 1541 CrossRef CAS.
- P. Du, X. Lin and X. Zhang, J. Phys. D: Appl. Phys., 2013, 46, 195303 CrossRef.
- M. Park, et al. , Nat. Nanotechnol., 2012, 7, 803 CrossRef CAS PubMed.
- D. A. G. Bruggeman, Ann. Phys., 1935, 24, 636 CrossRef CAS.
- K.-Y. Chun, Y. Oh, J. Rho, J.-H. Ahn, Y.-J. Kim, H. R. Choi and S. Baik, Nat. Nanotechnol., 2010, 5, 853 CrossRef CAS PubMed.
- A. T. Sepulveda, et al., Nanoscale, 2013, 5, 4847 RSC.
- M. Park, H. Kim and J. P. Youngblood, Nanotechnology, 2008, 19, 055705 CrossRef PubMed.
- Dow Corning, Sylgard 184 product information.
- T. C. Choy, Effective Medium Theory, Oxford Science Publications, 1999 Search PubMed.
- V. M. Shalaev and A. K. Sarychev, Phys. Rev B: Condens. Matter, 1998, 57, 13265 CrossRef CAS.
- H. Scher and R. Zallen, J. Chem. Phys., 1970, 53, 3759 CrossRef CAS PubMed.
- L. Wang and Z.-M. Dang, Appl. Phys. Lett., 2005, 87, 042903 CrossRef PubMed.
- M. Hövel, B. Gompf and M. Dressel, Phys. Rev. B: Condens. Matter, 2010, 81, 035402 CrossRef.
| This journal is © The Royal Society of Chemistry 2015 |

