Concave gold nanocube assemblies as nanotraps for surface-enhanced Raman scattering-based detection of proteins†
Paolo
Matteini
*a,
Marella
de Angelis
a,
Lorenzo
Ulivi
b,
Sonia
Centi
c and
Roberto
Pini
a
aInstitute of Applied Physics “Nello Carrara”, National Research Council, via Madonna del Piano 10, I-50019 Sesto Fiorentino, Italy. E-mail: p.matteini@ifac.cnr.it; Fax: (+) 39 055 5225305
bInstitute for Complex Systems, National Research Council, via Madonna del Piano 10, I-50019 Sesto Fiorentino, Italy
cDepartment of Biomedical, Experimental and Clinical Sciences, University of Florence, viale Pieraccini 6, I-50139 Firenze, Italy
First published on 18th December 2014
Abstract
SERS detection of proteins is typically performed by using labeling agents with stable and high Raman scattering cross sections. This is a valuable approach for trace detection and quantification of a target protein but is unsuitable for inspecting its inherent structural and functional properties. On the other hand, direct SERS of proteins has been mainly devoted to the study of short peptides and aminoacid sequences or of prosthetic groups with intense Raman signals, which is of scarce interest for a thorough characterization of most proteins. Here we try to overcome these limitations by setting-up an effective platform for the structural SERS analysis of proteins. The platform consists of an extended bidimensional array of gold concave nanocubes (CNCs) supported on a PDMS film. CNCs are closely-packed through face–face and face–corner interactions generating a monolayered arrangement featuring well distributed nanoholes. Here the protein homogeneously experiences an E-field enhancement outward from the metal surfaces surrounding it, which causes a large number of vibrations to be contemporarily amplified. The proposed platform provides stable and detailed SERS spectra and confers rapidity and reproducibility to the analysis.
Introduction
Surface-enhanced Raman scattering (SERS) is a high-sensitivity vibrational spectroscopy technique with the potential to afford thorough information about the conformation and chemical structure of a target species.1,2 In this respect, SERS represents a concrete possibility for the identification of biomolecules such as proteins at low concentrations as well as for the characterization of their structural organization and functional behavior.3–5 From a practical point of view, SERS detection requires that the molecular target comes in close proximity (within a few nanometers from the metal surface) to an optical enhancer substrate based on plasmon nanostructures of noble metals such as gold or silver.6 Upon suitable excitation of their plasmon resonances, the local electric field enhancement produces an increase in the Raman signal of the molecule by many orders of magnitude (typically in the 105–107 range).To date, the most popular approach for the SERS detection of biomolecules rests on the use of colloidal metal nanospheres or spheroidal nanoparticles deposited on glass or silicon substrates or aggregated within salts-containing solutions or by means of narrow optofluidic channels.7–9 The ‘hot spots’ created at the gaps and junctions between two or multiple adjacent nanoparticles are at the basis of an amplified Raman signal.10 However, control over the hot spot distribution within these systems is intrinsically challenging, conferring scarce reproducibility and accuracy to the SERS analysis. Improved SERS performances can be obtained by replacing nanospheres with structures containing sharp nanoscaled corners and edges, due to their amplifying antenna-like behavior.11,12 These features provide the electromagnetic field enhancement with additional 2–3 orders of magnitude.13,14 In the most recent literature, superstructures consisting of regular arrays of noble metal nanoparticles with different shapes and arrangement patterns have been introduced.15–17 In this case preformed colloids are chemically assembled to create large organized entities, which hold the promise of stronger and more reproducible SERS signals.18
Currently, the most successful results of SERS analysis of proteins have been obtained by indirect methods that is by using labeling agents with stable and high Raman scattering cross sections.4,19 These are valuable tools for trace detection and quantification of a biomolecular target but are unsuitable for inspecting its inherent structural and physiochemical properties. On the other hand, direct SERS of proteins has been mainly devoted to the study of short peptide fragments and aminoacid sequences or of different prosthetic groups including those of heme- and flavo-proteins due to their strong SERS response.20–23 Nonetheless, this perspective restricts the investigation to very limited peptide sequences and appears of scarce interest for a thorough characterization of the protein. Other methods require that the protein is genetically modified with specific aminoacid motifs (e.g. the hexahistidine tag),20,24 which assures a successful binding of the biomolecule to the metal surface and thus the possibility to gain insights into its spectroscopic characterization, although at the expense of a sustainable practice.
In this paper we show how to overcome the limitations depicted above by setting-up an effective platform for the structural SERS detection of proteins. Our method does not need a preliminary modification of the biomolecule and confers rapidity and reproducibility to the analysis. Optimal results are achieved by the combination of two main factors: (1) the choice of nonspherical tipped metallic nanostructures with controlled architectural parameters and (2) their assembly into organized 2D-arrays featuring a distribution of nanoholes for protein entrapment and detection.
Results and discussion
The SERS substrate herein engineered consists of an extended bidimensional array of gold concave nanocubes (CNCs) supported on a polydimethylsiloxane (PDMS) film. A scheme of the fabrication process is shown in Fig. 1.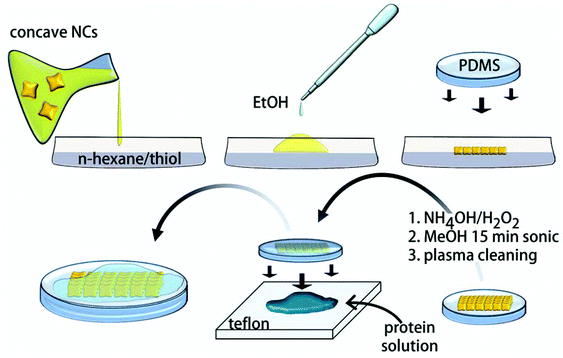 | ||
| Fig. 1 Scheme of the fabrication of the CNC arrays, their immobilization over PDMS films and preparation of the protein samples for SERS analysis. | ||
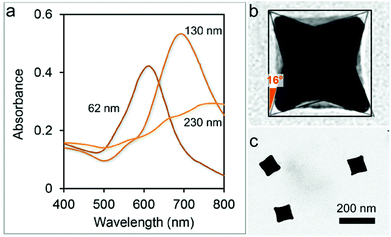
CNCs have been selected among other nanostructures due to a number of distinctive features including their intrinsically high SERS response and the availability of a solid surfactant-assisted synthesis protocol with high formation yields.25,26 We note that accessibility to colloidal batches with high monodispersity is essential for the preparation of large-area organized nanoparticle assemblies.27 In particular, particles of 130 nm size assured a >95% formation yield, as indicated by their sharp and intense plasmonic band (around 730 nm), which is not the case for the other sizes tested here (Fig. 2a). As a consequence, we focused on the former particle size for the following investigation. CNCs have a cubic shape but with square pyramid-shaped depressions in each one of the six faces (Fig. 2b). The average angle between the facets of the concave cube and those of an ideal regular cube was determined to be 16° ± 1°, indicating that the facets of the CNCs are of the high index {720} type, in accordance with the previous literature.25 CNCs were obtained by a seed-mediated synthetic method including the use of a cetyltrimethylammonium chloride (CTAC) surfactant as a stabilizing agent which plays an essential role in controlling the concave morphology of the final product.28
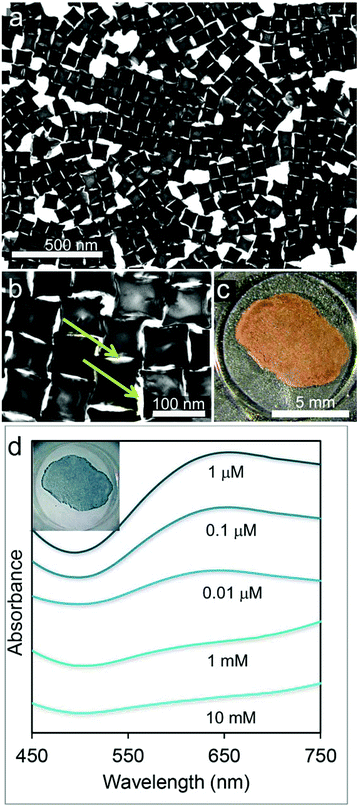
Superstructures of CNCs were obtained by self-assembly of the nanoparticles at a hexane–water interface with alkanethiol in the organic phase (Fig. 3a, b).29–31 In accordance with this procedure, destabilization of the colloidal particles is induced by the addition of ethyl alcohol, which triggers their adsorption at the interface. Here they undergo coating with alkanethiols, which succeeds in converting the nanoparticle repulsive force into van der Waals interactions and subsequent particle packing. After evaporation of both solvents, the as-formed gold islands easily adhere to a PDMS film,32 conferring it a mirror-like metallic sheen (Fig. 3c). The CNCs are closely-packed in a monolayer through face–face and face–corner interactions featuring well distributed holes of nanometric size (Fig. 3b).33 These act as nanotraps for accommodating the target protein once its pristine solutions are sandwiched and left dry between the SERS substrate and a flat and chemically-inert Teflon substrate. PDMS and Teflon generate a twofold water-repulsive interface that forces the protein to preferentially interact with the gold surface during the water evaporation process.34–36 At the same time this procedure assures a more homogeneous distribution of the protein over the SERS substrate with respect to methods based on simple drop coating deposition37 (Fig. S1†). The optical coupling between the plasmon bands of the particles17 is responsible for a broad surface plasmon peak centered at 640 nm (Fig. 3d). The rate of alkanethiol coating rules the compactness of the final nanoparticles assembly,31 which is obtained in the form of loose to dense monolayers and eventually leads to the formation of disordered 3D aggregates (Fig. S2†). Accordingly, an increase in the absorbance due to a significant decrease in the void areas and an increase in plasmon coupling is observed upon raising the thiol concentration up to 10−6 M (Fig. 3d). The transition from 2-dimensional arrays to aggregated clusters occurring at higher thiol concentrations is instead responsible for a remarkable decrease and broadening in their absorption curves, which can be attributed to multiple plasmon coupling effects (Fig. 3d). After the gold assembly is formed and is adhered to the PDMS film, it was subjected to alkaline oxidizing treatment, then cleansed in methanol and finally plasma etched, which succeeded in removing the alkanethiol from the metal surfaces (Fig. S3†).
The measured enhancement factor (EF) of the SERS substrate at the optimal thiol concentration of 1×10⁻⁶ M is of the order of ∼106 (see ESI† and Fig. S4) based on a minimum of 30 measurements on 4 replica substrates. Interestingly, our EF value is in line with values previously observed in superstructured systems based on lithographed38 or template-assisted39 gold nanoscale building blocks, which is not trivial when dealing with self-assembled substrates from colloidal particles.17 A visual appearance of the SERS response on a microscopic scale is here provided by mapping the signal from a probe molecule over (30 × 30) μm2 area (Fig. S5†). The homogeneity of the measured signal, which is quantified by a relative standard deviation of 20%, suggests a rather regular disposition of the hot spots throughout the SERS substrate.
The nanoscale distribution of the electric-field enhancement was simulated with a finite element method (FEM).18,40 As anticipated, the close assembly of the concave nanocubes was responsible for the formation of nanoholes at the interface between adjacent particles. Specifically, theoretical calculations evidenced that two main sites can be responsible for substantial SERS activity (Fig. 4): the junction points between cube corners (Fig. 4a) as well as between a cube corner and the face of an adjacent cube (Fig. 4b), and the nanoholes (Fig. 4a, c). The former type sites show 10–100 times larger E-field intensities with respect to those simulated within the nanoholes. Considering that the surface for analyte adsorption provided by the latter is quite larger with respect to that available at the junction points formed by the corners, we deduced that the nanoholes will mainly contribute to the final performances of our SERS substrate. Interestingly, the most effective configuration among those considered corresponded to three nanocubes in a shifted array (a cube with its corners approximating the middle of each adjacent cube face). While large E-field intensity values are generated at nearly the entire interface between particles, we may observe that this configuration appears less frequently in our substrate (Fig. 3a) and is thus expected to contribute to a lesser extent to the whole system efficiency.
The SERS substrate was finally tested for the detection of two proteins, i.e. insulin and cytochrome c, which are low-abundance biomarkers of principal biological processes such as the control of physiological glycometabolism and the incurrence of malignant tumors and fulminant hepatitis, respectively. Apart from the advantages offered by SERS in the ultrasensitive and effective identification of these proteins, SERS detection is expected to offer rich insights into tracking their functionality in respect to their secondary structure and conformational states. Nonetheless, the SERS analysis of these proteins has been previously proved challenging. First, large differences of peak intensity and dramatic frequency changes in the SERS spectra of insulin have been reported when it was detected in aggregating mixtures of metal colloids.41,42 These effects can be ascribed to the combination of an uneven hot spot distribution and the variability in the interactions established by the molecule with the colloidal surface,9 which similarly affected the signal of other biological species on SERS substrates with an uncontrolled particles assembly.7,20,43,44 Another matter requiring careful scrutiny is the SERS detection of heme-proteins like cytochrome c. In these cases, the intense SERS signals of the heme group are responsible for masking the spectral features of the remaining protein parts,21 in spite of using a nonresonant excitation.45,46
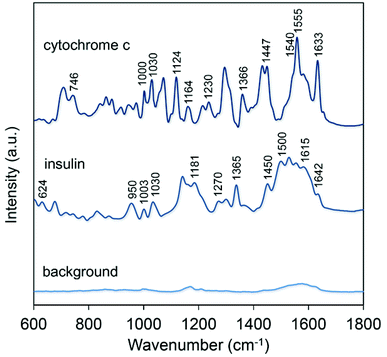
Representative spectra of insulin and cytochrome c are reported in Fig. 5 along with the background signal of the SERS substrate. In both cases we fixed the excitation wavelength to 639 nm in an attempt to maximize the SERS signal thanks to an excellent overlap with the plasmonic band originated by the CNC array (Fig. 3d). The SERS spectrum of insulin provides abundant and characteristic information including the band at 624 cm−1 assigned to Phe, the pair of Tyr Raman markers at 830 and 866 cm−1; the C–C stretching mode at 950 cm−1; Phe ring breathing modes at 1003 and 1030 cm−1; Tyr and Phe peaks at 1181 and 1208 cm−1; amide III band at 1270 cm−1; –CH deformation modes at 1365 and 1385 cm−1 and a –CH2 deformation mode at 1450 cm−1.9,42 The group of peaks between 1500 and 1615 cm−1 can be ascribed to the Phe, Tyr and Trp modes of the aromatic ring, while amide I band appears at 1642 cm−1. The presence of this band is regarded as fundamental for assigning the secondary structure being dependent on the conformation of the polypeptide backbone and on the presence of intra- and inter-molecular hydrogen bonds.47 Additionally, our results indicated a low variability in the SERS spectra of insulin by sequential measurements from different locations and replica substrates (Fig. S6†).
Analogously to the case of insulin, the nonresonant SERS spectrum of cytochrome c provided extensive vibrational information. In this case frequencies not merely associated with the heme group but originated from some amino acid residues and the peptide backbone were detected. Here the typical vibrational modes of heme are apparent: ν10 (1633 cm−1, B1g), ν11 (1540 cm−1, B1g), ν13 (1230 cm−1, B1g), ν15 (746 cm−1, B1g), ν22 (1124 cm−1, A2g), ν30 (1164 cm−1, B2g), ν4 (1370 cm−1/1366 cm−1, A1g).21,45 In addition, some bands can be ascribed to different aminoacid residues: e.g. 1555 cm−1 and 880 cm−1 (Trp), 1000 cm−1 and 1030 cm−1 (Phe), and 840 cm−1 and 860 cm−1 (Tyr); while the 1240 cm−1 mode is attributed to the amide III band and the 1447 cm−1 to the CH2 deformation.34,48
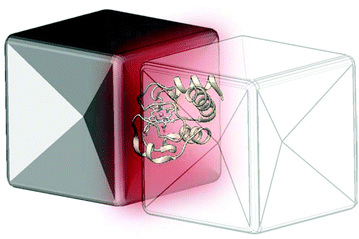
The suppression of some bands (such as the above-mentioned amide I band) and the fluctuation in the SERS response of various proteins from different locations of the SERS substrate have been frequently reported in the literature.36,41,43,44 These have been mostly interpreted as the consequence of the distancing of the protein with respect to the metal surface.49,50 In this case, a partial to full amplification of some frequencies at the expense of those generated by bonds placed at a larger distance from the surface of the SERS substrate is expected to occur.51–53 In contrast we observed stable and detailed SERS spectra, which require a different interpretation. We may speculate that, once entrapped within a nanohole, the protein molecule homogeneously experiences an E-field enhancement outward from the metal surfaces surroundings it, which causes a larger number of vibrations to be contemporarily amplified (Fig. 6). Obviously, the more regular is the hot spots (and nanoholes) distribution, the larger will be the influence of this effect over the final protein spectrum. Similar arguments can be used to explain the appearance of some non-heme vibrational modes in the cytochrome c spectrum. Again, the SERS active surfaces enclosing the molecule can induce an addictive effect to modes generated by peripheral parts of the protein that are typically shielded by more effective heme modes.
In conclusion we described an original strategy for the SERS detection of proteins based on a powerful SERS substrate that is composed of a 2D-distribution of gold nanocrystals. The peculiar characteristics of these nanocrystals and their assembly into organized arrays favored the formation of nanoscaled holes, which play the role of traps for effective protein detection. These features conferred substrate solidity and reliability to our SERS, which offered the possibility to unveil a number of structural characteristics of a protein by a simple and rapid procedure. We envision a number of future applications in the biological and medical areas for the proposed SERS system including the study of protein–ligand and protein–drug interactions and the identification of physiological mechanisms behind several pathological conditions.
Experimental
Materials
Reagents, metallic salts and other analytical grade chemicals were acquired from Sigma-Aldrich or Merck. PDMS was obtained from Sylgard. Human insulin solution (10 g L−1 in pH 8.2 HEPES) and cytochrome c from bovine heart were obtained from Sigma and used as received.Concave gold nanocubes synthesis
The particles were synthesized in accordance with the procedure of Zhang et al.25 with slight modifications. In brief, gold seeds were prepared by quickly injecting 0.3 mL of ice-cold NaBH4 (10 mM) into a rapidly stirred solution containing 0.125 mL HAuCl4 (10 mM) and 5 mL of CTAC (100 mM). After 2 hours without agitation, the seed solution was 1000-fold diluted with 0.1 M CTAC through two consecutive steps. CNCs were obtained by slowly adding 0.4 mL of the diluted seeds to a rapidly stirred growth solution containing 40 mL of CTAC (100 mM), 2 mL HAuCl4 (10 mM), 0.4 mL AgNO3 (10 mM), 0.6 mL HCl (1 M) and 0.4 mL of ascorbic acid (100 mM). The solution was left undisturbed overnight, then centrifuged (3×1000g, 40 min) and finally 4-fold concentrated and stored in cetylpyridinium chloride (CPC, 10 mM) until further use. Nanocrystal dimensions were obtained by dynamic light scattering (DLS) measurements on a Malvern Nano ZS90. TEM micrographs of the particles were acquired with a Philips CM-12 microscope running at 100 kV. The optical properties of CNCs were characterized by using a Jasco V-560 spectrophotometer.PDMS film fabrication
For the fabrication of PDMS circular films (0.8 cm diameter, 200 μm thickness), 50 μL of a 10![[thin space (1/6-em)]](https://www.rsc.org/images/entities/char_2009.gif) :
:![[thin space (1/6-em)]](https://www.rsc.org/images/entities/char_2009.gif) 1 base to curing agent mixture (Sylgard 184) were poured into 0.5 cm2 polystyrene circular molds and cured over a 40 °C hot plate. Just before use, a plastic cylinder (5 cm length × 1 cm diameter) was gently pressed over the air-exposed side of the film while the other side (protected from air) was used for capturing the floating gold islands.
1 base to curing agent mixture (Sylgard 184) were poured into 0.5 cm2 polystyrene circular molds and cured over a 40 °C hot plate. Just before use, a plastic cylinder (5 cm length × 1 cm diameter) was gently pressed over the air-exposed side of the film while the other side (protected from air) was used for capturing the floating gold islands.
Nanocrystal array fabrication
The assembly of the nanoparticles into organized arrays was pursued by following previous protocols29–31 with some modifications. 0.08 mL of the nanoparticle colloid was deposited at the bottom of a PTFE cell (5 cm2 area) to which 0.4 mL of n-hexane containing different concentrations of 1-dodecanthiol was added. 0.16 mL of EtOH was then dropped (at about 0.01 mL s−1) at the top of the hexane phase, leading to the assembly of gold nanoparticles at the water–hexane interface. The floating gold island adhered to the PDMS film upon complete evaporation of hexane. The PDMS-supported gold substrates were then soaked in a mixture of NH4OH–H2O2–H2O at 1![[thin space (1/6-em)]](https://www.rsc.org/images/entities/char_2009.gif) :
:![[thin space (1/6-em)]](https://www.rsc.org/images/entities/char_2009.gif) 1
1![[thin space (1/6-em)]](https://www.rsc.org/images/entities/char_2009.gif) :
:![[thin space (1/6-em)]](https://www.rsc.org/images/entities/char_2009.gif) 61 volume ratio at 40 °C for 30 min,54 followed by sonication in methanol at 30 °C for 15 min and oxygen plasma treatment (Harrick Scientific Corp., PDC-002 operated at 60 Hz and 0.2 Torr air) for 4 min. The optical properties of CNC arrays were characterized by a portable spectrometer (EPP2000 by Stellarnet Inc.) and a Shimadzu 8300 ATR-FTIR spectrophotometer. The fluorescence distribution of anti-rabbit IgG–FITC protein over the gold substrate was obtained with a Leica DMI3000B microscope.
61 volume ratio at 40 °C for 30 min,54 followed by sonication in methanol at 30 °C for 15 min and oxygen plasma treatment (Harrick Scientific Corp., PDC-002 operated at 60 Hz and 0.2 Torr air) for 4 min. The optical properties of CNC arrays were characterized by a portable spectrometer (EPP2000 by Stellarnet Inc.) and a Shimadzu 8300 ATR-FTIR spectrophotometer. The fluorescence distribution of anti-rabbit IgG–FITC protein over the gold substrate was obtained with a Leica DMI3000B microscope.
Surface-enhanced Raman scattering spectroscopy
SERS experiments were conducted on a micro-Horiba XPlora system. The spectrograph uses a 1200 grooves mm−1 grating with a confocal microscope in backscattering geometry and a 2D-CCD camera. We used a 50× objective with a NA value of 0.5, with accumulation times of 5 s per spectrum and a ∼70 μW power on the sample. Typically, for a single SERS measurement, we used 10 μL of fresh 2 × 10⁻⁶ M and 17 × 10−6 M solutions of cytochrome c and insulin in Milli-Q water, respectively. For each sample, the measurement was conducted on at least 3 replica substrates obtained under the same experimental conditions. All data were baseline corrected when needed. The samples were prepared according to Fig. 1. Methods used for FEM modeling and EF calculation are described in ESI.†Acknowledgements
This work was partially supported by the Regione Toscana and European Community within the frame of the ERANET+ Project BI-TRE.References
- K. A. Willets and R. P. Van Duyne, Annu. Rev. Phys. Chem., 2007, 58, 267–297 CrossRef CAS PubMed.
- M. Moskovits, Rev. Mod. Phys., 1985, 57, 783–826 CrossRef CAS.
- D. A. Stuart, A. J. Haes, C. R. Yonzon, E. M. Hicks and R. P. Van Duyne, IEE Proc. Nanobiotechnol., 2005, 152, 13–32 CrossRef CAS.
- R. A. Alvarez-Puebla and L. M. Liz-Marzan, Small, 2010, 6, 604–610 CrossRef CAS PubMed.
- D. Cialla, S. Pollok, C. Steinbrücker, K. Weber and J. Popp, Nanophotonics, 2014, 1–30 DOI:10.1515/nanoph-2013-0024.
- K. Saha, S. S. Agasti, C. Kim, X. Li and V. M. Rotello, Chem. Rev., 2012, 112, 2739–2779 CrossRef CAS PubMed.
- C. Blum, T. Schmid, L. Opilik, S. Weidmann, S. R. Fagerer and R. Zenobi, J. Raman Spectrosc., 2012, 43, 1895–1904 CrossRef CAS.
- M. Wang, N. Jing, I. H. Chou, G. L. Cote and J. Kameoka, Lab Chip, 2007, 7, 630–632 RSC.
- V. P. Drachev, M. D. Thoreson, E. N. Khaliullin, V. J. Davisson and V. M. Shalaev, J. Phys. Chem. B, 2004, 108, 18046–18052 CrossRef CAS.
- P. H. C. Camargo, M. Rycenga, L. Au and Y. N. Xia, Angew. Chem., Int. Ed., 2009, 48, 2180–2184 CrossRef CAS PubMed.
- L. Rodriguez-Lorenzo, R. A. Alvarez-Puebla, F. J. G. de Abajo and L. M. Liz-Marzan, J. Phys. Chem. C, 2010, 114, 7336–7340 CAS.
- J. P. Xie, Q. B. Zhang, J. Y. Lee and D. I. C. Wang, ACS Nano, 2008, 2, 2473–2480 CrossRef CAS PubMed.
- P. S. Kumar, I. Pastoriza-Santos, B. Rodriguez-Gonzalez, F. J. Garcia de Abajo and L. M. Liz-Marzan, Nanotechnology, 2008, 19 Search PubMed.
- S. Y. Lee, L. Hung, G. S. Lang, J. E. Cornett, I. D. Mayergoyz and O. Rabin, ACS Nano, 2010, 4, 5763–5772 CrossRef CAS PubMed.
- P. N. Sisco and C. J. Murphy, J. Phys. Chem. A, 2009, 113, 3973–3978 CrossRef CAS PubMed.
- C. Fang, D. Brodoceanu, T. Kraus and N. H. Voelcker, RSC Adv., 2013, 3, 4288–4293 RSC.
- Z. N. Zhu, H. F. Meng, W. J. Liu, X. F. Liu, J. X. Gong, X. H. Qiu, L. Jiang, D. Wang and Z. Y. Tang, Angew. Chem., Int. Ed., 2011, 50, 1593–1596 CrossRef CAS PubMed.
- M. Alba, N. Pazos-Perez, B. Vaz, P. Formentin, M. Tebbe, M. A. Correa-Duarte, P. Granero, J. Ferre-Borrull, R. Alvarez, J. Pallares, A. Fery, A. R. de Lera, L. F. Marsal and R. A. Alvarez-Puebla, Angew. Chem., Int. Ed., 2013, 52, 6459–6463 CrossRef CAS PubMed.
- X. X. Han, B. Zhao and Y. Ozaki, Anal. Bioanal. Chem., 2009, 394, 1719–1727 CrossRef CAS PubMed.
- G. V. P. Kumar, B. A. A. Reddy, M. Arif, T. K. Kundu and C. Narayana, J. Phys. Chem. B, 2006, 110, 16787–16792 CrossRef CAS PubMed.
- I. Delfino, A. R. Bizzarri and S. Cannistraro, Biophys. Chem., 2005, 113, 41–51 CrossRef CAS PubMed.
- N. S. Lee, Y. X. Hsieh, M. D. Morris and L. M. Schopfer, J. Am. Chem. Soc., 1987, 109, 1358–1363 CrossRef CAS.
- T. M. Cotton, S. G. Schultz and R. P. Van Duyne, J. Am. Chem. Soc., 1980, 102, 7960–7962 CrossRef CAS.
- R. Ahijado-Guzman, P. Gomez-Puertas, R. A. Alvarez-Puebla, G. Rivas and L. M. Liz-Marzan, ACS Nano, 2012, 6, 7514–7520 CrossRef CAS PubMed.
- J. A. Zhang, M. R. Langille, M. L. Personick, K. Zhang, S. Y. Li and C. A. Mirkin, J. Am. Chem. Soc., 2010, 132, 14012–14014 CrossRef CAS PubMed.
- M. Rycenga, M. R. Langille, M. L. Personick, T. Ozel and C. A. Mirkin, Nano Lett., 2012, 12, 6218–6222 CrossRef CAS PubMed.
- C. B. Murray, C. R. Kagan and M. G. Bawendi, Annu. Rev. Mater. Sci., 2000, 30, 545–610 CrossRef CAS.
- Y. Yu, Q. B. Zhang, X. M. Lu and J. Y. Lee, J. Phys. Chem. C, 2010, 114, 11119–11126 CAS.
- F. Reincke, S. G. Hickey, W. K. Kegel and D. Vanmaekelbergh, Angew. Chem., Int. Ed., 2004, 43, 458–462 CrossRef CAS PubMed.
- H. W. Duan, D. Y. Wang, D. G. Kurth and H. Mohwald, Angew. Chem., Int. Ed., 2004, 43, 5639–5642 CrossRef CAS PubMed.
- Y. K. Park, S. H. Yoo and S. Park, Langmuir, 2007, 23, 10505–10510 CrossRef CAS PubMed.
- M. J. Allen, V. C. Tung, L. Gomez, Z. Xu, L. M. Chen, K. S. Nelson, C. W. Zhou, R. B. Kaner and Y. Yang, Adv. Mater., 2009, 21, 2098–2102 CrossRef CAS.
- On the basis of size and geometry of the CNC arrays, we estimate that a minimum of 20 molecules of a small protein like insulin can be accommodated inside each nanotrap without any conformational distortion. We may predict that larger proteins should benefit from larger nanotraps, which can be generated by using CNCs with larger dimensions.
- M. Kahraman, B. N. Balz and S. Wachsmann-Hogiu, Analyst, 2013, 138, 2906–2913 RSC.
- P. Matteini, L. G. Dei, E. Carretti, N. Volp, A. Goti and R. Pini, Biomacromolecules, 2009, 10, 1516–1522 CrossRef CAS PubMed.
- S. Keskin and M. Culha, Analyst, 2012, 137, 2651–2657 RSC.
- J. Filik and N. Stone, Analyst, 2007, 132, 544–550 RSC.
- C. David, N. Guillot, H. Shen, T. Toury and M. L. de la Chapelle, Nanotechnology, 2010, 21 Search PubMed.
- C. Farcau and S. Astilean, J. Phys. Chem. C, 2010, 114, 11717–11722 CAS.
- P. Matteini, F. Tatini, L. Luconi, F. Ratto, F. Rossi, G. Giambastiani and R. Pini, Angew. Chem., Int. Ed., 2013, 52, 5956–5960 CrossRef CAS PubMed.
- D. Kurouski, T. Postiglione, T. Deckert-Gaudig, V. Deckert and I. K. Lednev, Analyst, 2013, 138, 1665–1673 RSC.
- D. Kurouski, M. Sorci, T. Postiglione, G. Belfort and I. K. Lednev, Biotechnol. Prog., 2014, 30, 488–495 CrossRef CAS PubMed.
- S. Stewart and P. M. Fredericks, Spectrochim Acta, Part A, 1999, 55, 1615–1640 CrossRef.
- X. M. Dou, Y. M. Jung, Z. Q. Cao and Y. Ozaki, Appl. Spectrosc., 1999, 53, 1440–1447 CrossRef CAS.
- G. Niaura, A. K. Gaigalas and V. L. Vilker, J. Electroanal. Chem., 1996, 416, 167–178 CrossRef CAS.
- X. X. Han, G. G. Huang, B. Zhao and Y. Ozaki, Anal. Chem., 2009, 81, 3329–3333 CrossRef CAS PubMed.
- D. Kurouski, T. Deckert-Gaudig, V. Deckert and I. K. Lednev, J. Am. Chem. Soc., 2012, 134, 13323–13329 CrossRef CAS PubMed.
- F. Wei, D. M. Zhang, N. J. Halas and J. D. Hartgerink, J. Phys. Chem. B, 2008, 112, 9158–9164 CrossRef CAS PubMed.
- C. D. Keating, K. M. Kovaleski and M. J. Natan, J. Phys. Chem. B, 1998, 102, 9404–9413 CrossRef CAS.
- K. Kneipp, H. Kneipp, I. Itzkan, R. R. Dasari and M. S. Feld, J. Phys.: Condens. Matter, 2002, 14, R597–R624 CrossRef CAS.
- Q. Ye, J. X. Fang and L. Sun, J. Phys. Chem. B, 1997, 101, 8221–8224 CrossRef CAS.
- J. Gersten and A. Nitzan, J. Chem. Phys., 1980, 73, 3023–3037 CrossRef CAS PubMed.
- C. A. Murray and D. L. Allara, J. Chem. Phys., 1980, 76, 1290–1303 CrossRef PubMed.
- D. J. Kim, R. Pitchimani, D. E. Snow and L. J. Hope-Weeks, Scanning, 2008, 30, 118–122 CrossRef CAS PubMed.
Footnote |
| † Electronic supplementary information (ESI) available. See DOI: 10.1039/c4nr05704j |
| This journal is © The Royal Society of Chemistry 2015 |

