
Towards graphene iodide: iodination of graphite oxide†
Petr
Šimek
a,
Kateřina
Klímová
a,
David
Sedmidubský
a,
Ondřej
Jankovský
a,
Martin
Pumera
b and
Zdeněk
Sofer
*a
aInstitute of Chemical Technology, Department of Inorganic Chemistry, 166 28 Prague 6, Czech Republic. E-mail: zdenek.sofer@vscht.cz; Fax: +420 22431-0422
bDivision of Chemistry & Biological Chemistry, School of Physical and Mathematical Sciences, Nanyang Technological University, Singapore, 637371, Singapore. E-mail: pumera@ntu.edu.sg; Fax: +65 6791-1961
First published on 30th October 2014
Abstract
Halogenated graphene derivatives are interesting owing to their outstanding physical and chemical properties. In this paper, we present various methods for the synthesis of iodinated graphene derivatives by the iodination of graphite oxides prepared according to either the Hummers or Hofmann method. Both graphite oxides were iodinated by iodine or hydroiodic acid under reflux or in an autoclave at elevated temperatures (240 °C) and pressures (over 100 bar). The influence of both graphite oxide precursors on the properties of resulting iodinated graphenes was investigated by various techniques, including SEM, SEM-EDS, high-resolution XPS, FTIR, STA, and Raman spectroscopy. Electrical resistivity was measured by a standard four point technique. In addition, the electrochemical properties were investigated by cyclic voltammetry. Although the iodinated graphenes were structurally similar, they had remarkably different concentrations of iodine. The most highly iodinated graphenes (iodine concentration above 30 wt%) exhibited relatively high C/O ratios, confirming high degrees of reduction. Iodine is incorporated in the form of covalent bonds to carbon atoms or as polyiodide anions non-covalently bonded through the charge transfer reaction with the graphene framework. Iodinated graphenes with such properties could be used as the starting material for further chemical modifications or as flame-retardant additives.
Introduction
Over the last decade, graphene1 has become one of the most intensively studied materials owing to its unique electrical, optical and mechanical properties with potential applications in optoelectronic and microelectronic devices,2 electrochemical and biochemical sensors3 and energy storage materials.4 Graphene derivatives have perhaps even more interesting properties which can be tuned through exact chemical modifications, such as hydrogenation5,6 or halogenation.7,8For the large-scale synthesis of such chemically-modified graphenes, the graphite oxide is the most commonly used precursor. Graphite oxide is usually synthesized by the oxidation of graphite in concentrated acids with permanganate or chlorate ions. Generally, methods based on reaction mixtures with MnO4− yield graphite oxides containing higher concentrations of carboxylic acid functional groups, while graphite oxides synthesized in the presence of ClO3− mainly contain hydroxyl and epoxide functional groups.9 Also, the amount of oxygen functionalities can differ dramatically according to the method of synthesis. Varying the composition and amount of oxygen functionalities has a significant effect on the resulting properties of the final graphene after the exfoliation/reduction.9
The halogen-based chemical modifications of graphite oxides leading to the formation of highly-halogenated graphenes are well studied in the case of fluorine.10,11 The formation of a strong C–F bond makes fluorinated graphene (fluorographene) unsuitable for further chemical modification or for reversible halogen storage. Compared to fluorographene, brominated graphenes are much more reactive.12–14 Iodinated graphenes can probably be even more interesting materials. This material can thus be used not only as a reactive precursor for other chemical iodinations but also as a flame retardant. It is, therefore, bewildering that only a few researchers reported the synthesis and properties of iodinated graphenes.15–17 Moreover, no systematic complex study has been published so far.
A hydrogen iodide solution was successfully used as a reducing agent for the reduction of graphite oxide and oxidized graphene nanoribbons.16,18,19 HI was also employed in the hydrogenation of C60 fullerenes to produce the C60H18 compound.20 Most authors report on the preparation of iodinated graphenes through the charge transfer reaction.21 Covalent bonding of I to the carbon framework was confirmed only on carbon nanotubes.22 Intercalated and physisorbed iodine species were used for the enhancement of Raman signal of graphene23 or for p-type electrical doping of graphene.24
Thus, we present several scalable methods for the synthesis of iodinated derivatives of graphene with different amounts of iodine and different concentrations of the remaining functional groups. To optimize the synthesis, graphite oxide was prepared according to either the Hummers25 or Hofmann26 method. We show the influence of each method on the iodine concentration and characterize the synthesized iodinated graphenes using a broad spectrum of analytic techniques.
Experimental
Materials
Graphite oxide (GO) was prepared according to either the Hofmann or Hummers method from high purity microcrystalline graphite (2–15 μm, 99.9995%, Alfa Aesar). Sulfuric acid (98%), nitric acid (68%), potassium chlorate (>99%), potassium permanganate (>99.5%), hydrogen peroxide (30%), hydrochloric acid (37%), iodine (>99%), hydroiodic acid (57%), methanol (>99.9%) and N,N-dimethylformamide (DMF) were obtained from Penta (Czech Republic). Potassium hydrogen phosphate and potassium dihydrogenphosphate were obtained from Lach-Ner (Czech Republic). Argon of 99.996% purity was obtained from SIAD (Czech Republic). Deionized water (16.8 Mohm) was used for buffer preparation. Nylon and Teflon filtration membranes with a porosity of 0.45 μm (Vitrum, Czech Republic) were used for the filtration of the reaction products.Synthetic procedures
The graphite oxide prepared by the Hofmann method26 was termed ‘HO-GO’. Concentrated sulphuric acid (87.5 mL) and nitric acid (27 mL) were added to a reaction flask containing a magnetic stir bar. The mixture was then cooled at 0 °C, and graphite (5 g) was added. The mixture was vigorously stirred to avoid agglomeration and to obtain a homogeneous dispersion. While keeping the reaction flask at 0 °C, potassium chlorate (55 g) was slowly added to the mixture in order to avoid a sudden increase in temperature and the consequent formation of explosive chlorine dioxide gas. Upon the complete dissolution of the potassium chlorate, the reaction flask was then loosely capped to allow the escape of the evolved gas and the mixture was continuously stirred vigorously for 96 h at room temperature. On the completion of the reaction, the mixture was poured into deionized water (3 L) and decanted. The graphite oxide was first redispersed in HCl (5%) solutions to remove sulphate ions and then repeatedly centrifuged and redispersed in deionized water until all chloride and sulphate ions were removed. The graphite oxide slurry was then dried in a vacuum oven at 50 °C for 48 h before use.The second graphite oxide, ‘HU-GO’, was synthesized by a similar method to the Hummers method.25 Graphite (5 g) and sodium nitrate (2.5 g) were stirred with concentrated sulphuric acid (115 mL). The mixture was then cooled at 0 °C. Potassium permanganate (15 g) was then added with vigorous stirring for 2 h. During the following four hours, the reaction mixture was allowed to reach room temperature before being heated to 35 °C for 30 min. The reaction mixture was then poured into a flask of deionized water (250 mL) and heated to 70 °C for 15 min. The unreacted potassium permanganate and manganese dioxide were removed by the addition of 3% hydrogen peroxide. The reaction mixture was then allowed to settle before being decanted. The obtained graphite oxide was then purified by repeated centrifugation and redispersion in deionized water until all sulphate ions were removed. The graphite oxide slurry was then dried in a vacuum oven at 50 °C for 48 h before use.
The synthesis of iodinated graphene was performed for both HO-GO and HU-GO using three different methods.
The first method involved iodination at atmospheric pressure with hydroiodic acid. Graphite oxide (250 mg) was placed in a 100 mL reaction flask with a magnetic stirring bar, and hydroiodic acid (25 mL) was added. The reaction mixture was stirred and refluxed for 24 h. The reaction product was separated by suction filtration, and repeatedly washed with deionized water and methanol. The samples prepared according to this procedure were termed ‘HO-HI-REF’ and ‘HU-HI-REF’.
The second method was performed with hydroiodic acid at elevated pressure and temperature. Graphite oxide (250 mg) and hydroiodic acid (15 mL) were placed in a Teflon-lined stainless steel autoclave. The autoclave was heated at 240 °C for 24 h. The unreacted iodine was evaporated at room temperature and the product was washed from the reaction vessel using deionized water. Next, the reaction mixture was directly filtered by suction filtration on the nylon membrane and repeatedly washed with deionized water and methanol. These samples were termed ‘HO-HI-A’ and ‘HU-HI-A’.
The last method of synthesis was performed with iodine at elevated pressure and temperature. Graphite oxide (250 mg) and iodine (25 g) were placed in a Teflon-lined stainless steel autoclave. The autoclave was heated at 240 °C for 24 h. The unreacted iodine was evaporated at room temperature and the product was washed from the reaction vessel using methanol. Next, the product was separated from the suspension by suction filtration on the nylon membrane and repeatedly washed with methanol and deionized water. The product was then dried in a vacuum oven at 70 °C for 48 h. These products were termed ‘HO-I-A’ and ‘HU-I-A’, respectively.
Methods
The morphology of the iodinated graphenes was investigated using scanning electron microscopy (SEM) with a FEG electron source (Tescan Lyra dual beam microscope). Elemental composition and mapping were performed using an energy dispersive spectroscopy (EDS) analyzer (X-MaxN) with a 20 mm2 SDD detector (Oxford Instruments) and AZtecEnergy software. To conduct the measurements, the samples were placed on a carbon conductive tape. SEM and SEM-EDS measurements were carried out using a 10 kV electron beam.Combustible elemental analysis (CHNS-O) was performed using a PE 2400 Series II CHNS/O Analyzer (Perkin Elmer, USA). The instrument was used in the CHN operating mode (the most robust and interference-free mode) to convert the sample elements to simple gases (CO2, H2O and N2). The PE 2400 analyzer automatically performed combustion, reduction, and homogenization of product gases, separation and detection. An MX5 microbalance (Mettler Toledo) was used for precise weighing of the samples (1.5–2.5 mg per single sample analysis). Using this procedure, the accuracy of CHN determination is better than 0.30% abs. Internal calibration was performed using an N-fenyl urea.
To measure the iodine concentration, the samples were decomposed for analysis according to the Schöniger method. An exact amount of the sample (ca. 10 mg) was wrapped in ash-free paper, burned under a pure oxygen atmosphere and leached out with deionized water. Formed I− ions were titrated with a solution of Hg(NO3)2 using sodium nitroprusside as an indicator.
High resolution X-ray photoelectron spectroscopy (XPS) was performed using an ESCAProbeP spectrometer (Omicron Nanotechnology Ltd, Germany) with a monochromatic aluminum X-ray radiation source (1486.7 eV). Wide-scan surveys of all elements were performed, with subsequent high-resolution scans of the C 1s, O 1s and I 3d peaks. Relative sensitivity factors were used to evaluate the carbon-to-oxygen (C/O) ratios from the survey spectra. The samples were placed in a conductive carrier made from a high purity silver bar. An electron gun was used to eliminate sample charging during measurements (1–5 V).
Raman spectroscopy was conducted on an inVia Raman microscope (Renishaw, England) with a CCD detector in backscattering geometry. A DPSS laser (532 nm, 50 mW) with a 100× magnification objective was used for the Raman measurements. The instrument was calibrated with a silicon reference to give a peak position at 520 cm−1 and a resolution of less than 1 cm−1.
Fourier transform infrared spectroscopy (FTIR) measurements were performed on a NICOLET 6700 FTIR spectrometer (Thermo Scientific, USA). A Diamond ATR crystal and a DTGS detector were used for all measurements, which were carried out in the range of 4000–650 cm−1.
Thermal behavior was analyzed by simultaneous thermal analysis (STA). The DTA and TG curves were recorded simultaneously on a Linseis STA PT1600 apparatus at a heating rate of 10 °C min−1 from ambient temperature to 1000 °C under a dynamic air atmosphere (50 cm3 min−1).
Electrochemical characterization was performed by cyclic voltammetry using an Interface 1000 potentiostat (Gamry, USA) with a three electrode set-up. The glassy carbon working electrode (GC), the platinum auxiliary electrode (Pt) and the Ag/AgCl reference electrode were obtained from Gamry (USA). For the cyclovoltammetric measurements, graphene was dispersed in DMF (1 mg ml−1) and 3 μl was evaporated on the glass carbon working electrode. All the potentials stated in the following section were measured against the Ag/AgCl reference electrode. The scan rate was set to 100 mV s−1. To measure the inherent electrochemistry, a phosphate buffer solution (PBS, 50 mM, pH = 7.2) was used as the supporting electrolyte. The HET rate was measured using a 10 mM K4[Fe(CN)6]/K3[Fe(CN)6] redox probe, with a 50 mM PBS solution as the supporting electrolyte.
To measure the electrical resistivity of the iodinated graphenes, 40 mg was compressed into a capsule (1/4 inch diameter) at a pressure of 400 MPa for 30 s. The resistivity of the capsules was measured by a four-point technique using the Van der Pauw method. The resistivity measurements were performed with a Keithley 6220 current source and an Agilent 34970A data acquisition/switch unit. The measuring current was set to 10 mA.
Results and discussion
The Hummers and Hofmann methods were used to prepare two types of graphite oxides. The graphite oxides were then iodinated using three different methods illustrated in Scheme 1 (for more details and terminology, see the Experimental section). All of the prepared materials were thoroughly characterized in order to understand the iodination process.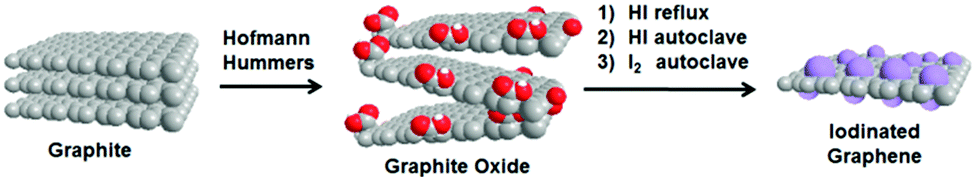 | ||
| Scheme 1 Synthesis of iodinated graphenes. | ||
The characterization of the materials was first performed by scanning electron microscopy (SEM) in order to determine the impact of the starting material and reaction conditions on the morphology of the iodine doped graphenes. The morphology of the iodinated graphenes is depicted in Fig. 1. Iodinated graphite oxides prepared by the Hofmann method exhibit a typical layered structure, usually observed in graphite oxides and partially reduced graphenes. In the case of iodinated graphenes prepared by the Hummers method we can observe a more wrinkled structure with voile-like edges of the graphene sheets (especially profound for HU-I-A) which is typical for the thermally or chemically reduced graphite oxides. Comparison of all the micrographs reveals that the reaction conditions were sufficient to produce partially exfoliated iodine doped graphenes.
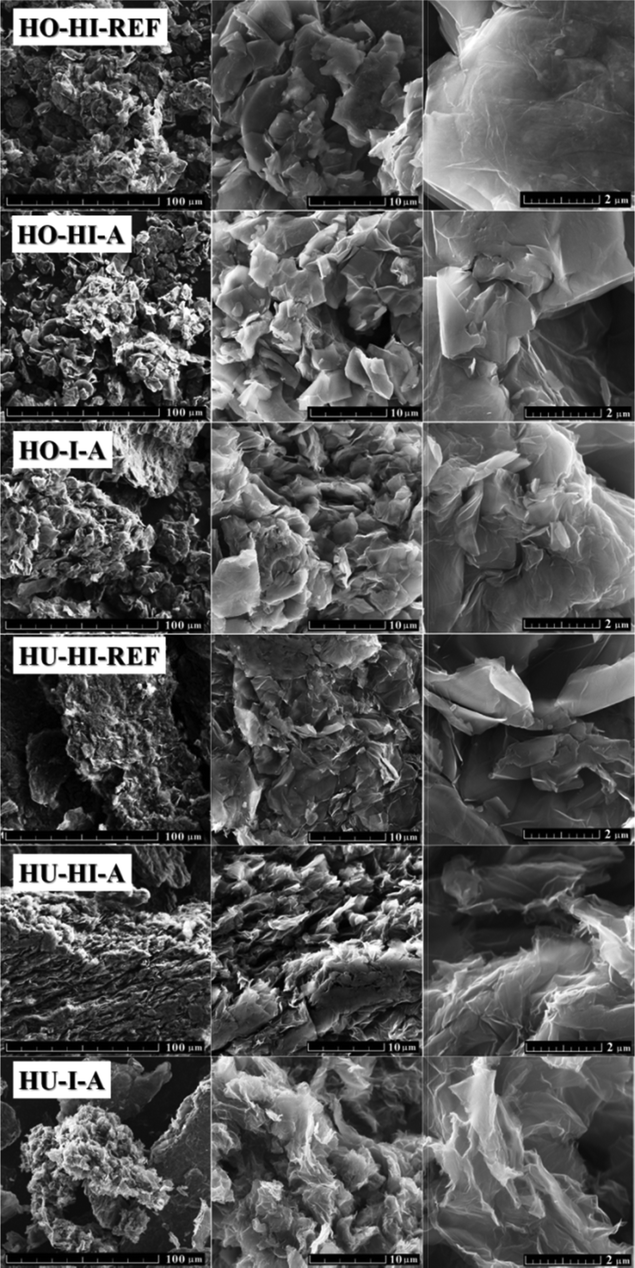 | ||
| Fig. 1 SEM micrographs of iodinated graphite oxides. | ||
Elemental composition, including carbon, oxygen and iodine, was analyzed by scanning electron microscopy combined with energy dispersive spectroscopy (SEM-EDS). To further determine the spread of iodine over the material, elemental distribution mapping was also performed. The overall elemental maps for carbon, oxygen and iodine can be seen in Fig. 2. Fitted EDS spectra in the range of 0–7 keV are also included. In all samples the distribution of iodine is homogeneous, reflecting only the contours of surface morphology. The same can be observed for carbon and oxygen. This is a common phenomenon because the signal strength of EDS is dependent on the incident electron beam. The lower parts of the sample thus become partially shielded from the electron beam and appear darker in the resulting elemental map. This observation supports the assumption that the iodination reaction or physical sorption took place in the whole bulk of the graphenes and not only on the edges of graphene flakes. Let us note that hydrogen cannot be detected by the EDS method. Therefore, other analytical techniques were used to deal with the elemental content and the results are compared to those of EDS measurements.
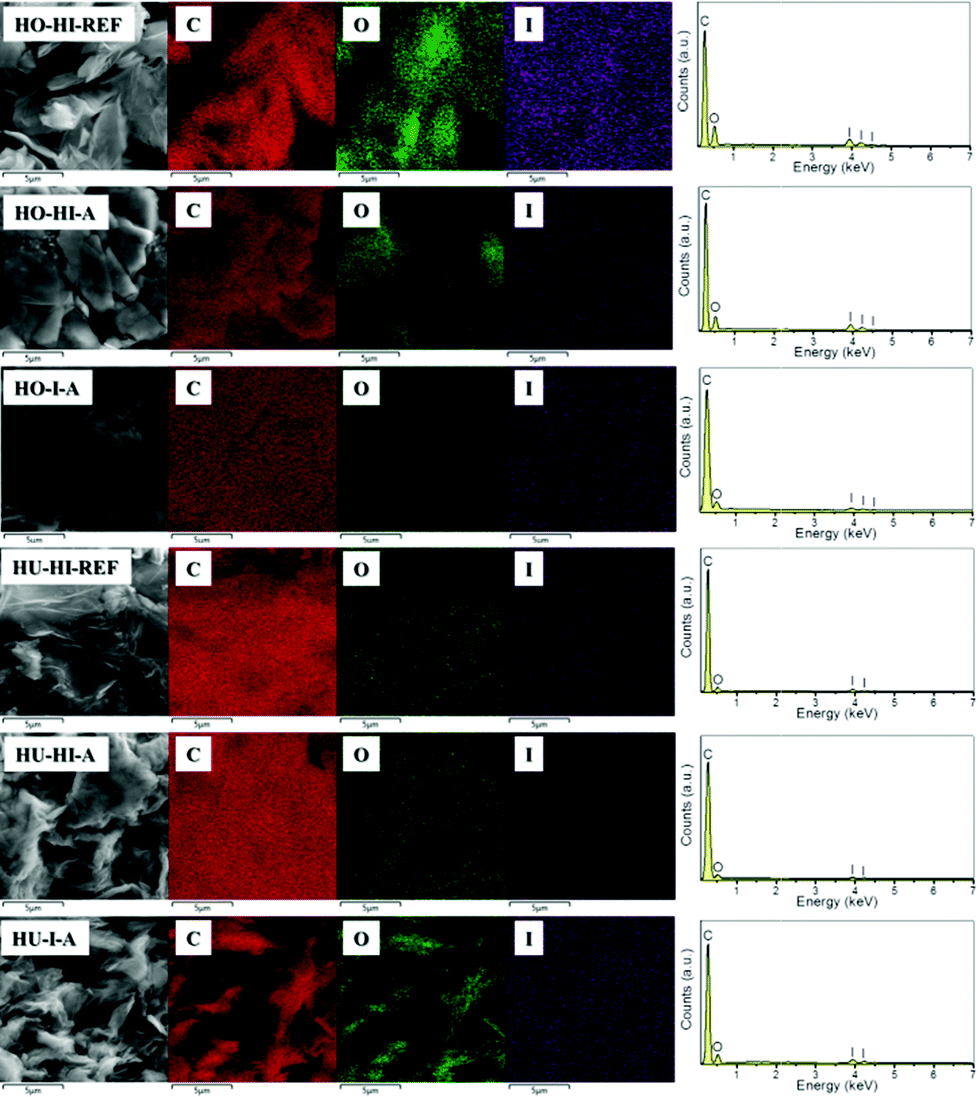 | ||
| Fig. 2 SEM-EDS element distribution maps of iodinated graphenes and the corresponding EDS spectra. | ||
Individual element distributions as determined by EDS are shown in Table 1. Apart from C, O and I, no other elements were detected in concentrations higher than 0.1 wt%. Iodine was well detected in all the measured samples. The iodination method, as well as the starting material, had a significant effect on the iodine content. The highest concentrations were achieved for HO-HI-REF and HO-HI-A, and the obtained values were 31.9 and 29.7 wt%, respectively. In the case of graphite oxides prepared by the Hummers method, the highest concentration was found in the sample iodinated by elemental iodine in the autoclave (HU-I-A). Interestingly enough, a different influence of the iodination procedure on the C/O ratio and the I concentration was observed for Hofmann and Hummers graphite oxides. Hummers graphite oxides treated with HI (HU-HI-REF and HU-HI-A) showed a high C/O ratio, indicating successful reduction of the oxygen functionalities. On the other hand, their iodine content was the lowest of the analyzed samples. This can be attributed to the more exfoliated structure, when one can expect less iodine to be intercalated between graphene sheets. Graphite oxides prepared by the Hofmann method treated with hydroiodic acid (HO-HI-REF and HO-HI-A) had lower C/O ratios but, on the other hand, higher amounts of I. This led us to the suggestion that some iodine is non-covalently bonded to the graphene sheets. The discrepancy between iodinated Hummers and Hofmann graphite oxides could be explained by a different composition of oxygen groups in the starting graphite oxides. This topic is further elaborated in the section on combustible elemental analysis.
| Sample | C | O | I |
|---|---|---|---|
| HO-HI-REF | 57.1 | 10.9 | 31.9 |
| HO-HI-A | 62.3 | 8.0 | 29.7 |
| HO-I-A | 74.9 | 7.0 | 18.1 |
| HU-HI-REF | 80.5 | 4.2 | 15.4 |
| HU-HI-A | 84.8 | 4.9 | 10.4 |
| HU-I-A | 72.5 | 6.5 | 21.0 |
To confirm and further develop the results gathered by SEM and EDS, a combustible elemental analysis was carried out. Its advantage is the capability to determine the hydrogen concentration. The results are summarized in Table 2. Iodine concentration showed good agreement with that determined by EDS. Highest iodine concentrations were obtained for HO-HI-REF (30.7 wt%) and HO-HI-A (30.4 wt%). The differences in oxygen concentrations compared to EDS can be explained by indirect determination of oxygen content, which is assessed as the remainder after the subtraction of C, H, N and I concentrations from 100 wt%. Also important is the fact that the EDS spectrum is collected only from a very limited amount of material and may slightly differ from the average composition.
| Sample | C | H | N | I | O |
|---|---|---|---|---|---|
| HO-HI-REF | 50.12 | 1.90 | 0.00 | 30.66 | 17.32 |
| HO-HI-A | 47.12 | 2.9 | 0.00 | 30.42 | 20.38 |
| HO-I-A | 68.87 | 0.41 | 0.00 | 19.35 | 11.37 |
| HU-HI-REF | 77.31 | 0.47 | 0.17 | 13.37 | 8.68 |
| HU-HI-A | 83.94 | 0.11 | 0.00 | 9.66 | 6.29 |
| HU-I-A | 65.28 | 0.92 | 0.95 | 17.60 | 15.26 |
Noticeably higher concentrations of iodine were detected for graphenes prepared from Hofmann graphite oxide. There are two main causes that probably contributed to this effect. As is known, graphite oxide prepared by chlorate oxidation methods (Hofmann method) contains more highly reactive epoxide groups.9 The reaction on the epoxide ring with I2 or with HI likely creates a C–I bond. In the case of permanganate oxidation methods (Hummers method), graphite oxide with higher content of the carboxyl group is prepared.9 A reaction with an iodination agent would then likely yield the acetyl iodide group. The second reason for such a difference between iodinated Hofmann and Hummers graphenes could be the extent of reduction (or exfoliation) in the resulting graphenes. As can be seen in Table 2, the samples HO-HI-REF and HO-HI-A contained a significantly higher concentration of oxygen than HU-HI-REF and HU-HI-A. Significant differences were also found in hydrogen concentration. Hydrogenation occurs mainly on C![[double bond, length as m-dash]](https://www.rsc.org/images/entities/char_e001.gif) C bonds; however, a reduction of the ketone group leading to hydroxyl followed by hydrogenation of the reduced carbon atom is also possible. The presence of the C–H can also be deduced by recalculation of the elemental composition in weight% to atomic% (Table SI1†). The H/O ratio of oxygen functional groups is equal to 1 in the most hydrogenated case of hydroxyl groups, 0.5 for carboxylic acids and 0 in ketones or epoxide groups. This led us to the conclusion that higher H/O (in at%) can only be explained by the formation of C–H bonds. High pressure/high temperature reaction with concentrated hydroiodic acid was historically used to transform organic compounds to saturated hydrocarbons.27 The chemical or thermal reduction of the graphite oxide is, to a certain degree, accompanied by exfoliation of the graphene layers. Therefore, less reduced and less exfoliated graphene could allow for the intercalation of I2 (or possible bonding and/or intercalation of polyiodide species, such as I3− or I5−). To confirm this hypothesis, the results of XPS, FTIR and Raman measurements are further discussed.
C bonds; however, a reduction of the ketone group leading to hydroxyl followed by hydrogenation of the reduced carbon atom is also possible. The presence of the C–H can also be deduced by recalculation of the elemental composition in weight% to atomic% (Table SI1†). The H/O ratio of oxygen functional groups is equal to 1 in the most hydrogenated case of hydroxyl groups, 0.5 for carboxylic acids and 0 in ketones or epoxide groups. This led us to the conclusion that higher H/O (in at%) can only be explained by the formation of C–H bonds. High pressure/high temperature reaction with concentrated hydroiodic acid was historically used to transform organic compounds to saturated hydrocarbons.27 The chemical or thermal reduction of the graphite oxide is, to a certain degree, accompanied by exfoliation of the graphene layers. Therefore, less reduced and less exfoliated graphene could allow for the intercalation of I2 (or possible bonding and/or intercalation of polyiodide species, such as I3− or I5−). To confirm this hypothesis, the results of XPS, FTIR and Raman measurements are further discussed.
High pressure/high temperature iodination by elemental iodine in the autoclave yielded graphenes with a similar composition (HO-I-A and HU-I-A). However, the interpretation of Raman and XPS spectra confirmed a different chemical bond distribution in the graphenes. From the aforementioned analysis one can assume that both the iodination agent and the type of starting material play a significant role in the mechanism of the iodination. In the following paragraphs we have tried to differentiate between physically and chemically bonded iodine and evaluate the possible causes and implications.
High resolution XPS was used to determine the chemical composition of the surface of the iodinated graphenes. The XPS survey spectra are presented in Fig. 3, where I 3d, I 3p, I 4d, C 1s and O 1s peaks were obtained. The I 3d twin peak was found at ∼619.5 and ∼631 eV, the I 3p peak at ∼875 eV, the C 1s peak at ∼284.5 eV and the O 1s peak at ∼533 eV. These spectra were used to calculate the concentrations of C, O and I (see Table 3). The iodine concentrations obtained by XPS were not in good agreement with combustible elemental analysis and SEM-EDS. Higher iodine concentrations were obtained for samples that were synthesized using elemental iodine but, on the other hand, lower iodine concentrations were obtained for the remaining samples prepared with the reaction of hydroiodic acid. This fact can be explained by the high surface sensitivity of XPS where the amounts of C, O and I can be different compared to the bulk. Due to the differences in the reaction mechanism of iodination we expect higher concentration of C–I bonds within graphite oxide iodinated by elemental iodine and a higher concentration of non-covalently bonded iodine for samples reduced by hydroiodic acid.
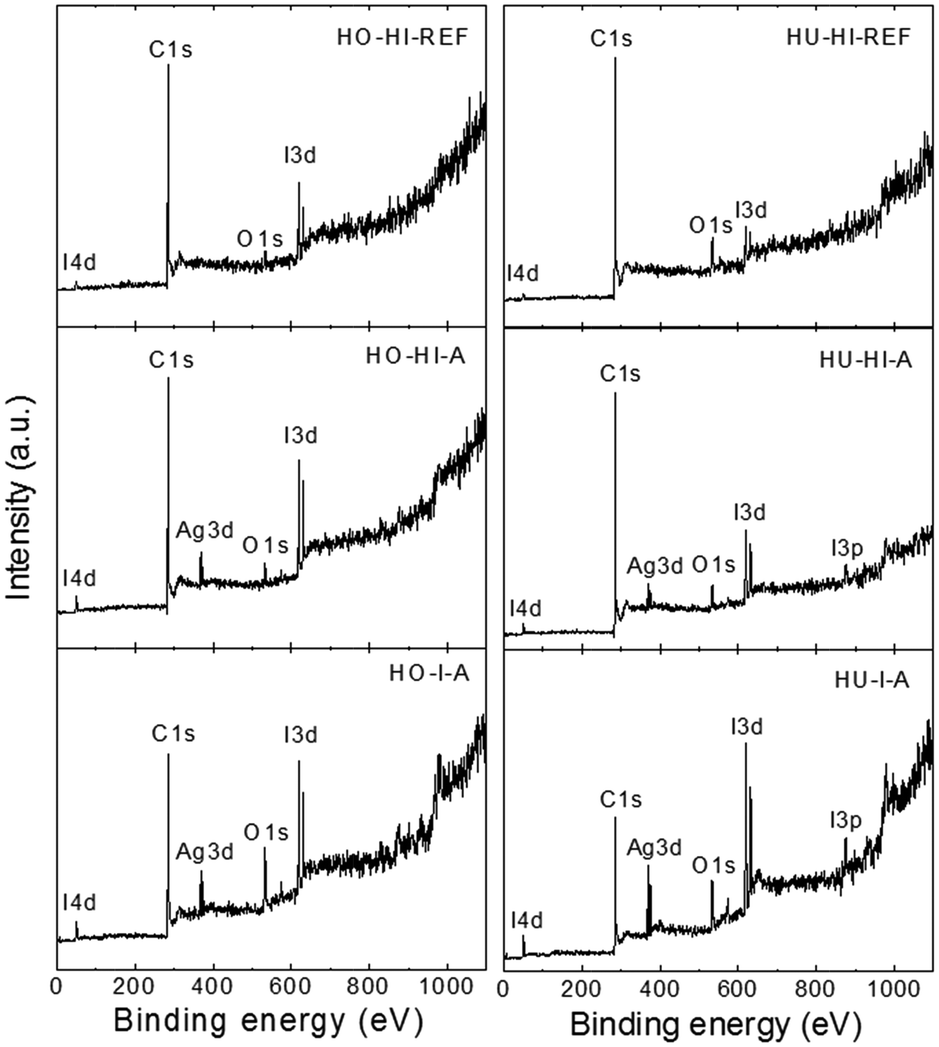 | ||
| Fig. 3 XPS survey spectra of iodinated graphenes. | ||
| Sample | C | O | I |
|---|---|---|---|
| HO-HI-REF | 95.54 | 3.44 | 1.02 |
| HO-HI-A | 94.98 | 3.21 | 1.81 |
| HO-I-A | 86.29 | 11.67 | 2.04 |
| HU-HI-REF | 92.91 | 6.26 | 0.84 |
| HU-HI-A | 95.29 | 3.51 | 1.20 |
| HU-I-A | 82.53 | 14.27 | 3.20 |
High C/O ratios were obtained for the graphite oxides reduced by hydroiodic acid under reflux (C/O = 20.9 for HO-HI-REF and C/O = 11.1 for HU-HI-REF) or in an autoclave (C/O = 22.2 for HO-HI-A and C/O = 20.4 for HU-HI-A), while for samples prepared using iodine the C/O ratios remained low (C/O = 5.6 for HO-I-A and C/O = 4.3 for HU-I-A). It is difficult to obtain high C/O ratios without the use of thermal reduction. Thus, the iodination/reduction of graphite oxide is suitable for the synthesis of iodinated graphene with low amounts of oxygen functionalities. Such high C/O ratios are comparable with those obtained on graphene prepared by thermal or microwave assisted reduction of graphite oxide.28,29
The detailed I 3d spectra of the iodinated graphenes are shown in Fig. 4. The I 3d was composed of two peaks, I 3d3/2 at ∼631 eV and I 3d5/2 at ∼619.5 eV. The I 3d5/2 peak at 619.5 eV can be attributed to a multitude of chemical bonds, including elemental iodine, polyiodide anions15 as well as the C–I bond.30 After a careful consideration and analysis of the Raman spectra we lean towards the opinion that polyiodides I3− and I5− are the most abundant stages of iodine, with respective binding energies at ∼618.9 eV and 619.7 eV. However, elemental iodine I2 and the C–I bond would also have peaks in this region.15,22 Therefore, we conclude that high resolution XPS alone is not sufficient to precisely determine the type of iodine bonding to the graphene backbone. This topic was further specified by the results of Raman spectroscopy. For comprehensiveness, detailed O 1s spectra are shown in ESI as Fig. SI1.†
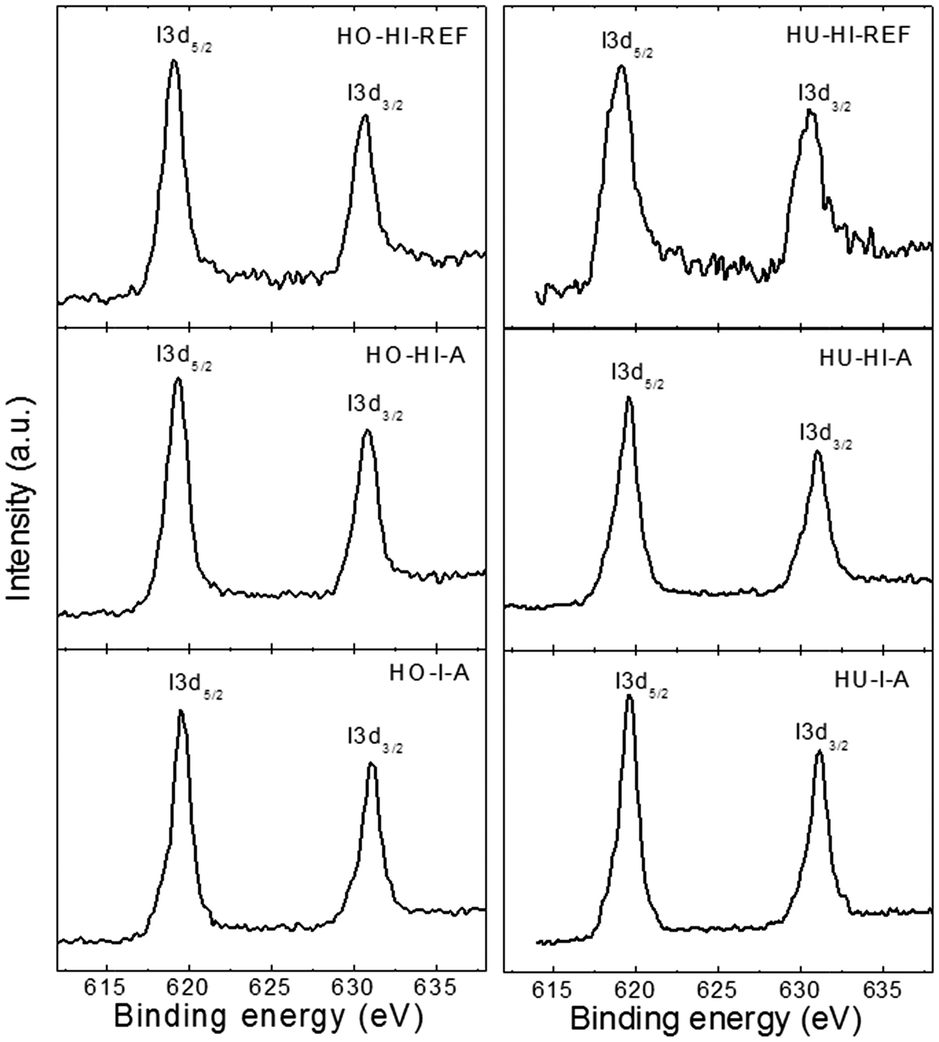 | ||
| Fig. 4 High-resolution XPS spectra of I 3d. | ||
A detailed analysis of the C 1s peak for all the iodinated graphenes is shown in Fig. 5. High resolution C 1s spectra were fitted to quantitatively differentiate the six different carbon stages: C–C (284.4 eV); C–C/C–H (285.4 eV); C–O/C–I (286.3 eV); CO (288.0 eV); O–CO (289.0 eV); π–π* interaction (290.5 eV). Significant differences in the composition of these functional groups were found in iodinated graphenes (Table 4). Results of the fitting procedure confirmed high amounts of oxygen in HO-I-A and HU-I-A.
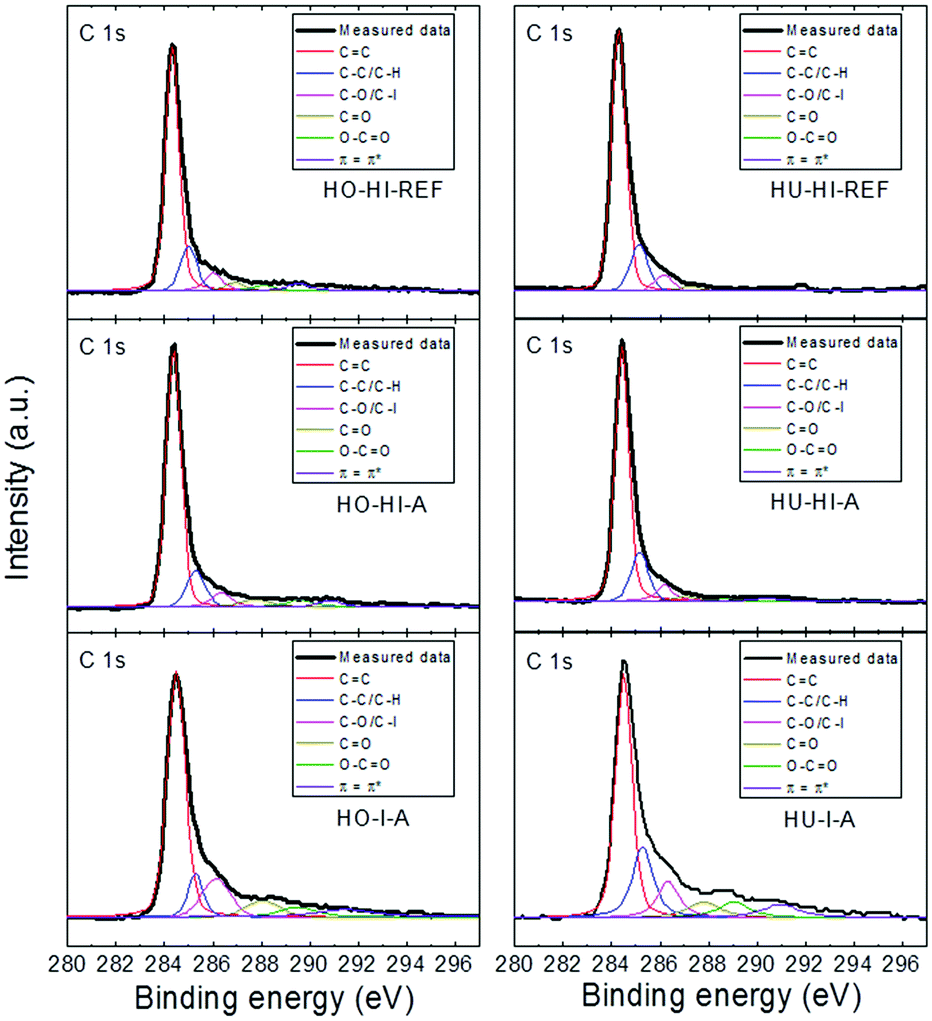 | ||
| Fig. 5 Detail of high resolution XPS spectra of the C 1s peak, where fittings of the individual spectra show the possible carbon bonds. | ||
| Sample | Groups | |||||
|---|---|---|---|---|---|---|
| –CC |
C–C/C–H | C–O/C–I | CO |
O–CO |
ππ* |
|
| HO-HI-REF | 69.17 | 14.40 | 5.69 | 2.86 | 3.47 | 4.41 |
| HO-HI-A | 72.44 | 11.54 | 5.56 | 4.54 | 3.11 | 2.81 |
| HO-I-A | 61.58 | 8.73 | 13.16 | 6.51 | 4.26 | 5.76 |
| HU-HI-REF | 73.67 | 15.48 | 5.28 | 2.10 | 1.53 | 1.94 |
| HU-HI-A | 71.76 | 16.17 | 6.30 | 2.52 | 1.47 | 1.78 |
| HU-I-A | 49.90 | 19.59 | 10.96 | 7.36 | 6.15 | 6.3 |
To further elaborate on the structural quality and to confirm the assumptions on the character of iodine bonding, Raman spectroscopy was performed on the iodinated graphenes (see Fig. 6). Two characteristic bands for graphite-derived materials were present: the D-band at 1350 cm−1 and the G-band at 1580 cm−1. The presence of the D-band is associated with sp3 hybridization of bonded carbon atoms, indicating mainly defects along the graphene layer. The G-band originates from sp2 hybridization of bonded carbon atoms.31
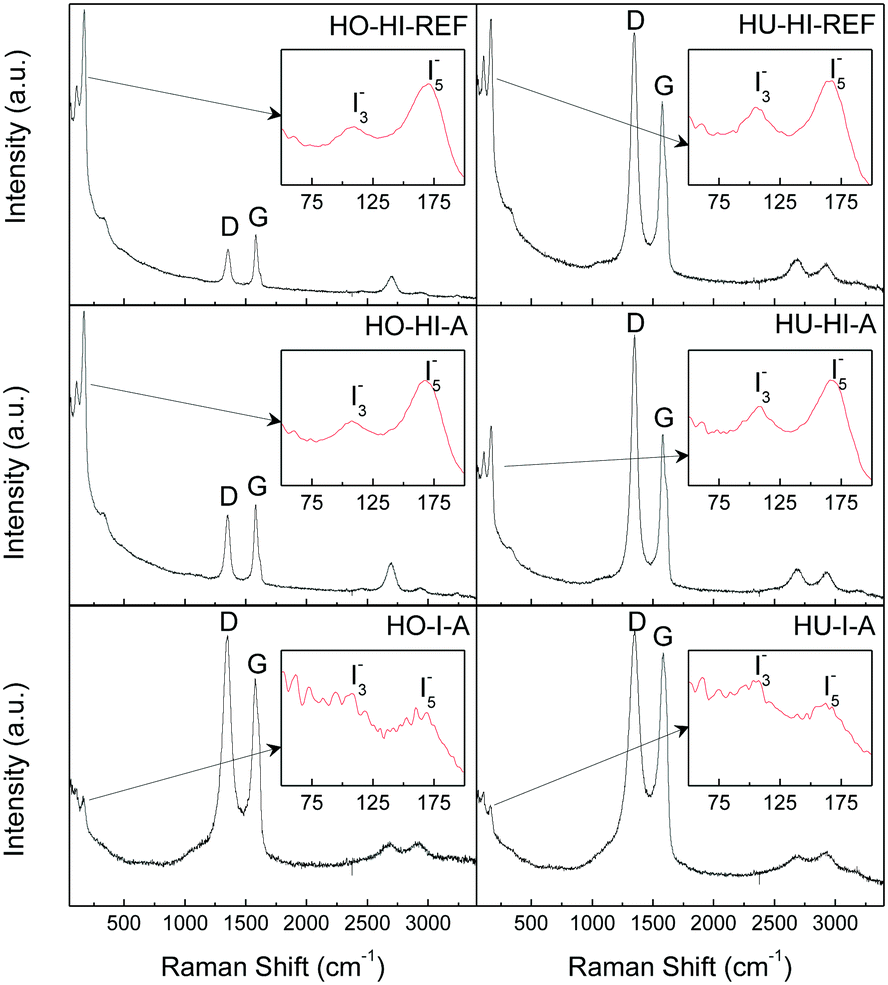 | ||
| Fig. 6 Raman spectra of iodinated graphenes, inset: region of the I3− and I5− vibrations. | ||
The D/G ratios and crystallite sizes (La) calculated from the intensities of the D and G bands32 are summarized in ESI as Table SI2.† In general, the D/G ratio is lower for the samples treated with HI in the autoclave compared to samples reacted under reflux. This is a clear indication of the restored graphene structure which occurs under a high pressure environment, unlike the reduction that takes place at atmospheric pressure. For the samples treated with elemental iodine we observe a strong dependence of the D/G ratio and La on the graphite oxide synthesis method. When graphite oxide prepared by the Hummers method was used as the starting material, a lower D/G ratio was observed for HU-I-A compared to the samples reacted with HI. In the case of graphite oxide prepared by the Hofmann method, the situation was completely opposite. A higher D/G ratio was observed for HO-I-A compared to the samples treated with HI. This indicates a significant influence of the chemistry of the starting material on its chemical modification properties.
There were also two other significant bands located at 109 cm−1 and 167 cm−1 in the spectra. The former can be attributed to the triiodide anion I3− and the latter to the vibration of pentaiodide anion I5− bonded to graphene layers through the electron transfer reaction.15 No proof for the presence of elemental iodine I2 (band around 185 cm−1) was found. These conclusions confirmed the interpretation of the XPS measurements discussed previously.
From relative intensities of the iodine (I3− and I5−) bands and the D and G bands we can estimate the relative abundance of molecular iodine in the graphenes. The biggest ratio can be clearly seen in HO-HI-REF, followed by HO-HI-A, HU-HI-REF and HU-HI-A. That would suggest that a higher concentration of molecular iodine is electrostatically bonded to the graphene sheets in the form of polyiodides. In the case of HO-I-A and HU-I-A the relative intensities of the iodine bands are smaller; therefore, a higher amount of iodine is expected to be covalently bonded to the graphene backbone. These results are in good agreement with those obtained by XPS and elemental combustion analysis. The lower concentration of iodine detected by XPS in the samples reduced by hydroiodic acid can be explained by decomposition of polyiodide anions under UHV conditions.
The ATR-FTIR spectra (Fig. SI2†) were analyzed in order to confirm the presence of the C–I bond. The presence of other functional groups was also followed. Because of the strong graphene absorption in the IR region spectra of weak quality were observed. Nevertheless, we were able to assign the band at 725 cm−1 to C–I. Another broad band observed at 1050–1200 cm−1 originates from the remaining oxygen functionalities. A vibration of the carbon atoms of the graphene layer is present at 1590 cm−1. The weak band located at 3650 cm−1 originates from the remaining hydroxyl groups. An interesting feature of the measured spectra is the double bands located at 2850 cm−1 and 2920 cm−1, respectively, which corresponds to the C–H bond. These two characteristic bands are visible for all samples. However, their intensity is extremely low. Therefore, we can assume that during the high temperature and high pressure reduction with HI or I2 a partial hydrogenation of the graphite oxide takes place. This was also proved by elemental combustion analysis for some of the samples (HO-HI-REF and HO-HI-A) where a certain degree of hydrogenation was observed.
The thermal stability of the iodinated graphenes was investigated under a dynamic air atmosphere by STA. Undoped Hofmann and Hummers graphenes prepared by thermal reduction (marked HO and HU, respectively) were also burned for comparison. Fig. 7 shows high differences between the onset temperatures for the oxidation–combustion of the graphenes. As the iodine concentration increased, graphene became more resistant to combustion. The combustion temperature of graphenes prepared from Hofmann graphite oxide increased from 476 °C for undoped HO to 748 °C for highly iodinated HO-HI-A (29.7 wt% of iodine). A similar trend was observed for the graphenes prepared from Hummers graphite oxide. While the onset temperature for HU was 360 °C, it increased to 611 °C for HU-HI-REF. Results showed that samples prepared by iodination using hydroiodic acid (HO-HI-REF, HO-HI-A, HU-HI-REF, HU-HI-A) were much more resistant to oxidation at elevated temperatures compared to the samples prepared by iodination using iodine (HO-I-A, HU-I-A). Combustion temperatures and amount of iodine in graphenes determined by EDS are shown in Table 5.
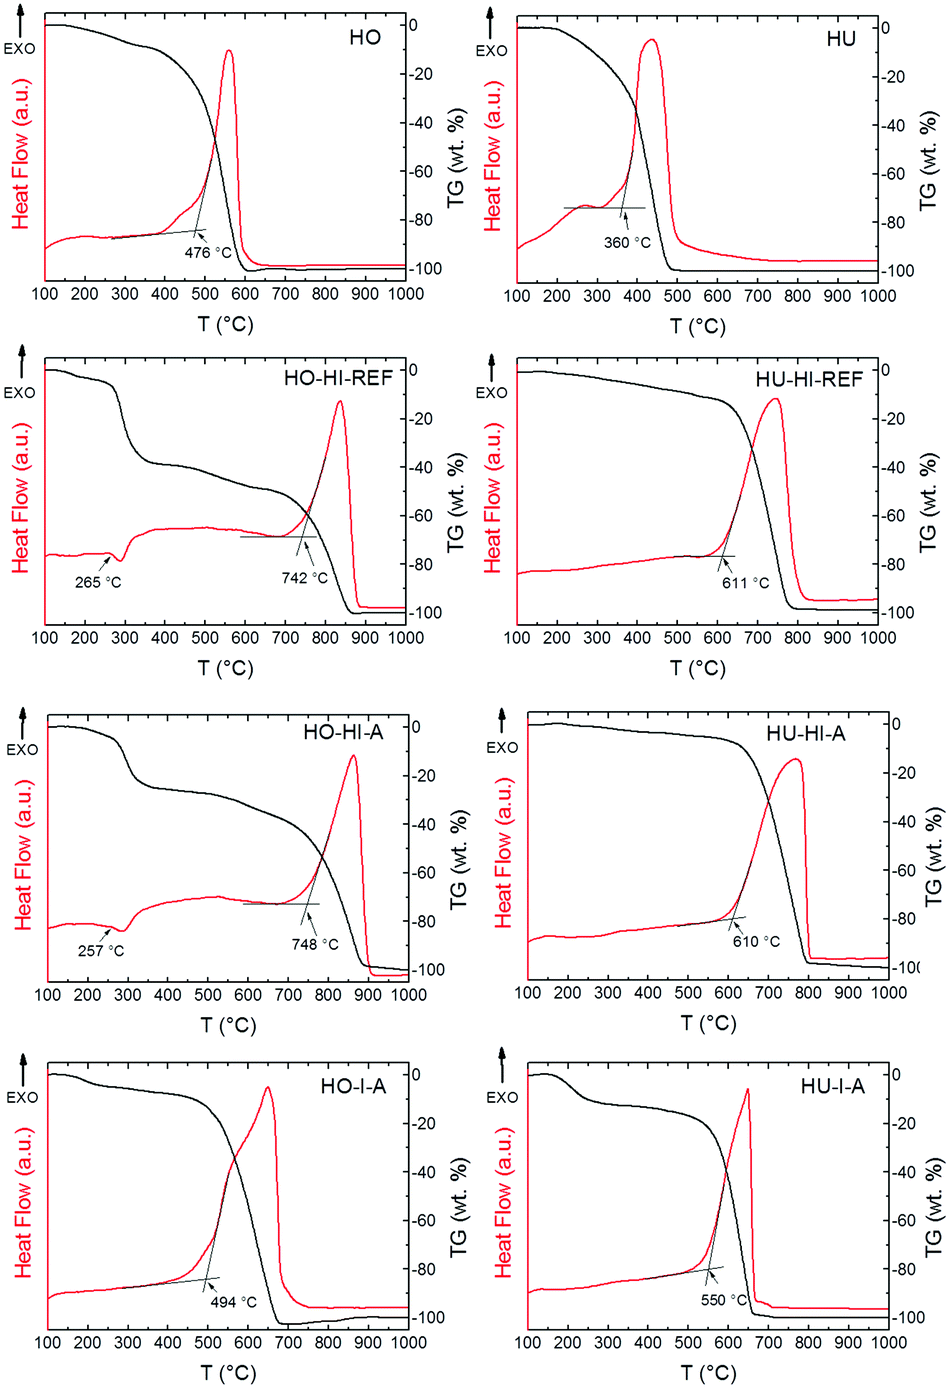 | ||
| Fig. 7 STA curves of iodinated graphenes and untreated graphite oxide. | ||
| Sample | I [wt%] | T [°C] |
|---|---|---|
| HO | 0 | 476 |
| HO-HI-REF | 31.9 | 742 |
| HO-HI-A | 29.7 | 748 |
| HO-I-A | 18.1 | 494 |
| HU | 0 | 360 |
| HU-HI-REF | 15.4 | 611 |
| HU-HI-A | 10.4 | 610 |
| HU-I-A | 21.0 | 550 |
Close analysis of the TG and DTA curves revealed another interesting fact: a small endothermic effect connected with the weight decrease was found at ∼260 °C for highly iodinated graphenes (HO-HI-REF, HO-HI-A). This effect is probably associated with a partial breaking of the C–I bonds and decomposition of polyiodide anions which proceeded continuously until the combustion (see TG curves of HO-HI-REF and HO-HI-A). This could make highly iodinated graphenes promising candidates for flame-retardant additives.
To obtain a better insight into the electrochemical activity of the iodinated graphenes, the HET (heterojunction electron transfer) rates were determined (Table 6) from the ferro/ferricyanide electrochemical probe (Fig. 8). The calculations were performed according to Nicolsons's method.33 Some differences in peak-to-peak separation were observed between 266 and 535 mV. Slower HET rates were mainly found for samples originating from graphite oxide prepared by the Hummers method (HU). This fact indicates the significant influence of the composition of the starting material on the HET rate of iodinated graphenes. In the case of samples originating from graphite oxide prepared by the Hofmann method (HO) a higher HET rate was observed for graphite oxide treated with elemental iodine in the autoclave. The situation was similar for samples originating from HU; a faster HET rate was observed for HU-I-A compared to HO-I-A.
 | ||
| Fig. 8 Cyclic voltammetry of iodinated graphenes performed on a ferrocyanide solution in PBS, potential is measured against the Ag/AgCl reference electrode. | ||
| Sample | Peak separation (mV) | HET (cm−1) |
|---|---|---|
| HO-HI-REF | 342 | 1.62 × 10⁻⁴ |
| HO-HI-A | 367 | 1.15 × 10⁻⁴ |
| HO-I-A | 327 | 1.99 × 10⁻⁴ |
| HU-HI-REF | 343 | 1.60 × 10⁻⁴ |
| HU-HI-A | 535 | 1.18 × 10⁻⁵ |
| HU-I-A | 283 | 3.61 × 10⁻⁴ |
The influence of iodine concentration on the HET rate is confusing, and different trends are observed for samples prepared from different graphite oxides. In the case of samples originating from HO, a faster HET rate is observed for samples with lower iodine concentration. In the case of samples originating from HU, a faster HET rate is observed for samples with higher iodine concentration. From these observations it is clear that the HET rate depends not only on the iodine concentration; various other factors, such as the concentration of defects, the composition of the starting graphite oxide and the concentration of the remaining oxygen functionalities, also play a significant role.
The extremely slow HET rate for the HU-HI-A can be explained by the chemistry of the starting graphite oxide. This material is mostly decorated by carboxylic acid groups on the rims of the graphene sheets. During high temperature treatment these functional groups undergo decomposition and iodine can be bonded to the edges of graphene sheets. Presence of iodine on the edges will lead to a significant reduction of the HET rate.
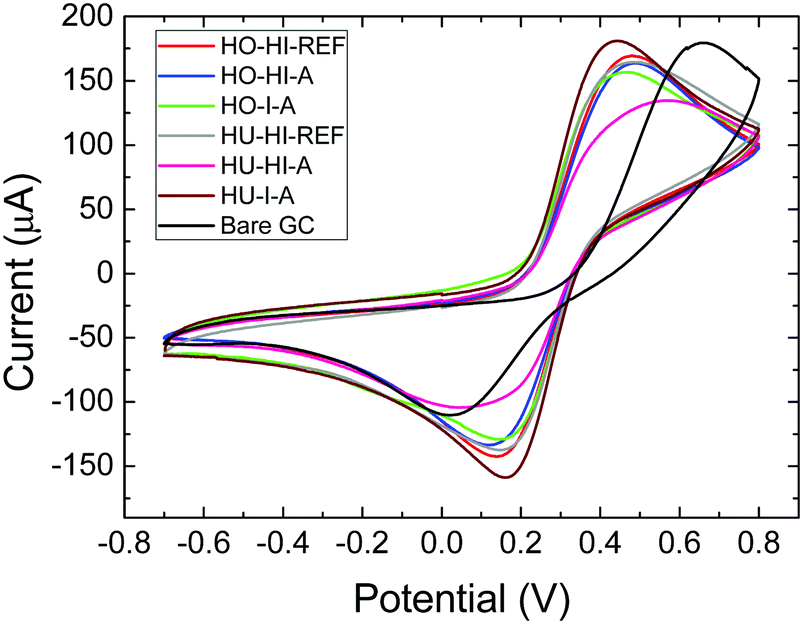
Finally, in order to determine the effect of iodine species in graphene on its electrical properties, measurements of electrical resistivity were performed. The results are tabulated in Table 7. The lowest resistivity, and therefore the highest conductivity, was measured for the samples treated with hydroiodic acid. This correlates well with the Raman spectra in which we observed that HO-HI-REF and HO-HI-A have the highest amount of polyiodide species, followed by HU-HI-REF and HU-HI-A. These samples also contain the lowest amount of the remaining oxygen functional groups which can also significantly increase the resistivity. The charge transfer reaction of atomic iodine with the graphene surface leads to negatively charged polyiodides and positively charged graphene (hole doping of graphene). However, due to the high delocalization of electron density on large iodine atoms or even larger polyiodide anions, their contribution to the increase of electrical resistivity is noticeably lower compared to other halogen atoms with a smaller diameter and a higher electronegativity, such as fluorine or chlorine. Graphenes iodinated with elemental iodine (HO-I-A and HU-I-A) have higher resistivities than those prepared with hydroiodic acid. This led us to the conclusion that the prospective formation of C–I bonds has a lower influence on the overall conductivity of iodine doped graphene than on the remaining oxygen functional groups.
| Sample | Resistivity (Ω cm) |
|---|---|
| HO-HI-REF | 2.4 × 10⁻³ |
| HO-HI-A | 1.8 × 10⁻³ |
| HO-I-A | 1.9 × 10⁻² |
| HU-HI-REF | 4.1 × 10⁻³ |
| HU-HI-A | 3.8 × 10⁻³ |
| HU-I-A | 8.8 × 10⁻² |
Conclusion
Iodinated graphenes with high amount of iodine were prepared by high pressure/high temperature reactions in an autoclave with hydroiodic acid and elemental iodine and under hydrogen iodide reflux. The extent of iodination was driven by both the starting material as well as the choice of the iodination reagent. Graphite oxide prepared by the Hofmann method showed good potential for iodination, especially when HI was used as the iodination agent. The highest concentration of iodine was over 30 wt% in the case of using hydrogen iodide under reflux and in the autoclave. Both the chemically and non-covalently bonded iodine species were detected in the synthesized iodo-graphenes as proved by Raman, FTIR and XPS spectroscopy. The charge transfer reaction between a graphene framework and molecular iodine is responsible for bonding and intercalation of polyiodide species. Samples iodinated by hydroiodic acid possess very high C/O ratios compared with thermally reduced graphenes. Partial hydrogenation of graphene during the reaction with HI was also observed. The amount of iodine significantly improved thermal stability resulting in increased combustion temperature compared to undoped graphite oxides. The presented methods for preparation of iodinated graphenes are highly suitable for achieving high concentration of iodine.Acknowledgements
This research was supported by a Specific University Research grant, MSMT no. 20/2014. M. P. acknowledges a Tier 2 grant (MOE2013-T2-1-056; ARC 35/13) from the Ministry of Education, Singapore.Notes and references
- A. K. Geim and K. S. Novoselov, Nat. Mater., 2007, 6, 183 CrossRef CAS PubMed.
- P. Blake, P. D. Brimicombe, R. R. Nair, T. J. Booth, D. Jiang, F. Schedin, L. A. Ponomarenko, S. V. Morozov, H. F. Gleeson, E. W. Hill, A. K. Geim and K. S. Novoselov, Nano Lett., 2008, 8, 1704 CrossRef PubMed.
- A. Bonanni, A. H. Loo and M. Pumera, Trends Anal. Chem., 2012, 37, 12–21 CrossRef CAS PubMed.
- M. Pumera, Energy Environ. Sci., 2011, 4, 668 CAS.
- D. C. Elias, R. R. Nair, T. M. G. Mohiuddin, S. V. Morozov, P. Blake, M. P. Halsall, A. C. Ferrari, D. W. Boukhvalov, M. I. Katsnelson, A. K. Geim and K. S. Novoselov, Science, 2009, 323, 610 CrossRef CAS PubMed.
- Z. Sofer, O. Jankovský, P. Šimek, L. Soferova, D. Sedmidubsky and M. Pumera, Nanoscale, 2014, 6, 2153 RSC.
- Ch. K. Chua and M. Pumera, J. Mater. Chem., 2012, 22, 23227 RSC.
- O. Jankovský, P. Šimek, D. Sedmidubský, S. Matějková, Z. Janoušek, F. Šembera, M. Pumera and Z. Sofer, RSC Adv., 2014, 4, 1378 RSC.
- H. L. Poh, F. Sanek, A. Ambrosi, G. Zhao, Z. Sofer and M. Pumera, Nanoscale, 2012, 4, 3515 RSC.
- H. L. Poh, Z. Sofer, K. Klimova and M. Pumera, J. Mater. Chem. C, 2014, 2, 5198–5207 RSC.
- K. J. Jeon, Z. Lee, E. Pollak, L. Moreschini, A. Bostwick, C. M. Park, R. Mendelsberg, V. Radmilovic, R. Kostecki and T. J. Richardson, ACS Nano, 2011, 5, 1042 CrossRef CAS PubMed.
- H. L. Poh, P. Šimek, Z. Sofer and M. Pumera, Chem. – Eur. J., 2013, 19, 2655 CrossRef CAS PubMed.
- K. Gopalakrishnan, K. S. Subrahmanyam, P. Kumar, A. Govindaraj and C. N. R. Rao, RSC Adv., 2012, 2, 1605 RSC.
- O. Jankovsky, P. Simek, K. Klimova, D. Sedmidubsky, S. Matejkova, M. Pumera and Z. Sofer, Nanoscale, 2014, 6, 6065 RSC.
- Z. Yao, H. Nie, Z. Yang, X. Zhou, Z. Liu and S. Huang, Chem. Commun., 2012, 48, 1027 RSC.
- S. Pei, J. Zhao, J. Du, W. Ren and H.-M. Cheng, Carbon, 2010, 48, 4466 CrossRef CAS PubMed.
- F. Karlický, K. Kumara Ramanatha Datta, M. Otyepka and R. Zbořil, ACS Nano, 2013, 7, 6434 CrossRef PubMed.
- F. Cataldo, O. Ursini and G. Angelini, Fullerenes, Nanotubes, Carbon Nanostruct., 2011, 19, 461 CrossRef CAS.
- I. K. Moon, J. Lee, R. S. Ruoff and H. Lee, Nat. Commun., 2010, 73, 1 CrossRef PubMed.
- F. Cataldo and S. Iglesias-Groth, Fullerenes, Nanotubes, Carbon Nanostruct., 2010, 18, 117 CrossRef CAS.
- G. Kalita, K. Wakita, M. Takahashi and M. Umeno, J. Mater. Chem., 2011, 21, 15209 RSC.
- K. S. Coleman, A. K. Chakraborty, S. R. Bailey, J. Sloan and M. Alexander, Chem. Mater., 2007, 19, 1076 CrossRef CAS.
- N. Jung, A. C. Crowther, N. Kim, P. Kim and L. Brus, ACS Nano, 2010, 4, 7005 CrossRef CAS PubMed.
- N. Jung, N. Kim, S. Jockusch, N. J. Turro, P. Kim and L. Brus, Nano Lett., 2009, 9, 4133 CrossRef CAS PubMed.
- W. S. Hummers and R. E. Offeman, J. Am. Chem. Soc., 1958, 80, 1339 CrossRef CAS.
- U. Hofmann and A. Frenzel, Kolloid-Z., 1934, 68, 149 CrossRef CAS.
- M. Berthelot, Compt. Rend., 1868, 64, 710 Search PubMed.
- H. L. Poh, F. Šaněk, A. Ambrosi, G. Zhao, Z. Sofer and M. Pumera, Nanoscale, 2012, 4, 3515 RSC.
- A. Y. S. Eng, Z. Sofer, P. Šimek, J. Kosina and M. Pumera, Chem. – Eur. J., 2013, 19, 15583 CrossRef CAS PubMed.
- H. Cabibil, H. Ihm and J. M. White, Surf. Sci., 2000, 447, 91 CrossRef CAS.
- Z. Sofer, O. Jankovský, P. Šimek, K. Klímová, A. Macková and M. Pumera, ACS Nano, 2014, 8, 7106–7114 CrossRef CAS PubMed.
- L. G. Cançado, K. Takai, T. Enoki, M. Endo, Y. A. Kim, H. Mizusaki, A. Jorio, L. N. Coelho, R. Magalhães-Paniago and M. A. Pimenta, Appl. Phys. Lett., 2006, 88, 163106 CrossRef PubMed.
- R. S. Nicholson, Anal. Chem., 1965, 37, 1351 CrossRef CAS.
Footnote |
| † Electronic supplementary information (ESI) available. See DOI: 10.1039/c4nr05219f |
| This journal is © The Royal Society of Chemistry 2015 |