
Misfit dislocation free InAs/GaSb core–shell nanowires grown by molecular beam epitaxy†
T.
Rieger
*,
D.
Grützmacher
and
M. I.
Lepsa
*
Peter Grünberg Institut 9 and JARA-FIT, Forschungszentrum Jülich GmbH, 52425 Jülich, Germany. E-mail: t.rieger@fz-juelich.de; m.lepsa@fz-juelich.de
First published on 10th November 2014
Abstract
In this report, we present the growth and structural analyses of broken gap InAs/GaSb core–shell nanowires by molecular beam epitaxy using an Au-free approach. Depending on the shell growth temperature, two distinct growth regimes for the GaSb shells are identified resulting in conformal or tapered shells. Morphological analyses reveal a dodecagonal nanowire cross-section after GaSb shell growth. Detailed transmission electron microscope investigations from different zone axes confirm that the small lattice mismatch of 0.6% allows the deposition of 40 nm thick GaSb shells free of misfit dislocations. Additionally, an abrupt interface from InAs to GaSb is found. These nanowires are suitable for future devices such as TFETs.
Introduction
Core–shell nanowires (NWs) are suitable candidates for several applications in nanoelectronics1 and -optics.2,3 By combining materials with different lattice constants, however, strain relaxation by misfit dislocations has to be taken into account, limiting the future applications. In this context, recently several groups published results about strain relaxation4–7 and coherent growth3,8 in lattice-mismatched core–shell NWs. Commonly, the coherent growth was only observed in thin shells with a low lattice mismatch.A core–shell system consisting of InAs and GaSb is of particular interest due to its unique type III band alignment.9 This allows the fabrication of tunnelling field effect transistors (TFETs) with high on/off ratio.10 In core–shell NWs, the interface area between InAs and GaSb can be very high with an abrupt interface not suffering from typical graded compositions observed in axial heterostructure NWs.11 The large interface area can carry high tunnelling currents. Apart from this, a core–shell system with a broken gap band alignment can transfer recently observed phenomena in two dimensional topological insulators12 into the NW geometry. Nanowire (T)FETs with a GaSb core and an InAs(Sb) shell have already been investigated and show promising characteristics.13,14 Here we present the growth, morphological and structural characteristics of InAs/GaSb core–shell NWs using molecular beam epitaxy (MBE).
Experimental details
The InAs/GaSb core–shell NWs were grown on Si (111) substrates in a Varian GENII MBE system equipped with As and Sb valved crackers. Prior to growth, the Si substrates were cleaned using hydrofluoric acid and reoxidized in hydrogen peroxide.15 The InAs core was grown at a temperature of 490 °C with In and As4 fluxes of 0.035 μm h−1 and 10−5 mbar, respectively. The growth time of the core was set to 1 h. These conditions result in a self-seeded growth of InAs NWs via a vapour solid (VS) growth mechanism, no foreign catalyst was used to grow the NWs. Subsequently, the substrate temperature was decreased to TsubGaSb and the growth of the GaSb shell was carried out with a Ga rate of 0.1 μm h−1 and a Sb flux FSb varying between 2 × 10⁻⁷ and 2 × 10⁻⁶ mbar. The growth of the GaSb shell was initiated by first providing sole Sb for 2 min and then opening the Ga shutter. This sequence should firstly create an InSb-like interface and secondly remove As from the chamber before GaSb is grown. The shell growth time tGaSb was varied between 5 and 90 minutes.After the growth, the morphology of the NWs was analysed by scanning electron microscopy (SEM) from the top (0° tilt), bird's eye view (60° tilt) and under a tilt angle of 90°. Transmission electron microscopy (TEM) was used to determine the crystalline structure, potential defects as well as the shell thickness. For this purpose, the NWs were aligned along the 〈110〉 and the 〈211〉 zone axes of the zinc blende lattice. Energy dispersive X-ray spectroscopy (EDX) in the TEM was used for elemental analyses. High angle annular dark field (HAADF) profiles were acquired to gain further information about the NW morphology.16 Selective area electron diffraction (SAED) pattern from both zone axes provided information about strain relaxation.
Results and discussion
GaSb shell growth
A typical SEM micrograph of bare InAs NWs is shown in Fig. 1a. The NWs are about 1.5 μm in length, have a mean diameter of about ∼100 nm and do not show any tapering except for the top ∼100 nm where the diameter decreases. The NW density is in the range of 1 NW μm−2, thus relatively low. However, low density NWs are ideal for core–shell structure since shadowing effects of neighbouring NWs as well as competition between them can be neglected. The InAs NWs have a hexagonal prism morphology with side facets belonging to the {110} family. Self-seeded InAs NWs typically have a high density of stacking faults, however, recent results demonstrated a significant improvement of the crystalline structure by the addition of Sb during growth.17 | ||
| Fig. 1 Bird's eye view SEM micrographs of InAs and InAs/GaSb core–shell NWs: (a) bare InAs NWs, (b)–(e) InAs/GaSb core–shell NWs with shell growth temperatures TsubGaSb of 490 °C (b), 400 °C (c), 360 °C (d) and 300 °C (e). (f) Higher magnification image of a NW with GaSb shell growth temperature of 300 °C showing a sidewall roughness. The inset in (d) shows a top-view image of a single core–shell NW clearly exhibiting a three-fold symmetry. | ||
Typically, the growth of GaSb on InAs is carried out at temperatures of about ∼400 °C.18–21 Accordingly, GaSb shells were grown in the temperature range TsubGaSb from 300 °C to 490 °C with a Sb flux of 8 × 10⁻⁷ mbar. Representative SEM images after a growth time of the shell tGaSb of 90 minutes are displayed in Fig. 1b–e. Under all conditions, a parasitic GaSb layer is grown on the Si (111) substrate in-between the NWs, indicating a low diffusion and high sticking coefficient. In general, this parasitic layer is rather smooth; it only roughens for the lowest growth temperature. The NW morphology, however, shows a strong dependency on the GaSb growth temperature. Substrate temperatures of 400 °C and higher result in a strong tapering of the GaSb shell, having a thinner shell at the bottom than at the top (Fig. 1b and c). Reducing the substrate temperature to ∼360 °C results in NWs with a uniform diameter as well as smooth facets (Fig. 1d). A further decrease of the substrate temperature, however, increases the roughness of the GaSb shell as evident by the higher magnification image in Fig. 1f. In general, after the growth of the GaSb shell, the NWs exhibit a flat top facet, contrary to the faceted tip of the bare InAs NWs. At temperatures around 350–400 °C and for long shell growth durations, this flat top is in combination with a radial growth at the top forming a platform (see Fig. 1c and d). A detailed description of the evolution of this platform is given in the ESI.† The platform itself shall be discussed later again.
In order to confirm the core–shell structure, NWs with shells grown at 360 °C and 490 °C were examined by TEM and EDX. The corresponding TEM images and EDX profiles are plotted in Fig. 2a and b, respectively. The low shell growth temperature of 360 °C gives rise to a uniform and conformal GaSb shell as can be seen by the two EDX profiles taken at the upper and lower part of the NW shown in Fig. 2a. The shell thickness is about 35 nm, being in good agreement with the expected value considering the Ga rate, growth time as well as geometry of the MBE system. At such low temperatures, the majority of Ga adatoms contributing to radial growth is due to direct impingement, diffusion from or to the substrate plays a minor role. Consequently, the parasitic GaSb layer has a thickness of about 150 nm. Apart from the GaSb shell, axial growth of GaSb takes place developing a platform at the top. The thickness of the axially grown GaSb is ∼140 nm and therefore in good agreement with the expected thickness of a GaSb layer grown on a planar substrate. This once more evidences the low diffusivity of Ga adatoms at the used growth conditions.
 | ||
| Fig. 2 TEM micrographs of InAs/GaSb core–shell NWs with shell growth at 360 °C (a) and 490 °C (b). EDX profiles are plotted right next to the TEM images, red lines on the images indicate the positions of the profiles. dc is the core diameter, dcs the diameter of the core–shell NW. | ||
The situation changes when the substrate temperature is increased. Then, the NWs show a strong tapering with a larger diameter dcs at the top than at the bottom dc (see Fig. 1b, c and 2b). EDX profiles acquired at different positions along the NW axis are plotted in Fig. 2b and demonstrate the absence of a GaSb shell at the lower part of the NW whereas a 40 nm thick GaSb shell is found at the upper part of the NW. In-between, the shell thickness gradually decreases. Since the NW density is low and comparable for both samples, shadowing does not play a role rather adatom diffusion leads to the growth of tapered shells. Dimakis et al. showed that low substrate temperatures and a corresponding low diffusivity of adatoms are required to grow homogenous and Si-doped GaAs shells around GaAs NWs.22 Similar to the results shown here, higher temperatures resulted in tapered shells. Possible explanations for such a preferred migration of adatoms to the top might be temperature differences along the NW,23,24 different facets at the top part and the main part of the NW as well as changes in the effective V/III ratio. Although in general, a homogenous, non-tapered shell is required, here we want to point out that a tapered shell might be advantageous for some applications. Thus, considering a radial TFET, the tapered core–shell morphology allows contacting the InAs as well as the GaSb parts individually without any etching. However, for the further discussion a substrate temperature of 360 °C is regarded as the optimal temperature for the shell growth since it provides smooth surfaces and a uniform shell thickness along the entire NW.
Using these optimized shell growth conditions, the growth time tGaSb was varied between 5 and 90 minutes. The shell thickness was measured by aligning the NWs to the 〈211〉 zone axis in the TEM. As presented in the ESI,† this zone axis gives a strong contrast between the core and the shell and clearly shows the interface. In Fig. 3, the shell thickness is plotted against the shell growth time. As can be seen, a linear dependence with a shell growth rate of about ∼23 nm h−1 is observed. This corresponds well with the supplied Ga rate of 100 nm h−1 considering the NW and MBE geometry as well as the substrate rotation. Within the studied regime, the Sb flux FSb was not found to have an impact on the growth of the GaSb shell, neither the growth rate nor the morphology of the shell.
 | ||
| Fig. 3 GaSb shell thickness versus shell growth time. The dashed line is a guide to the eye. The shell thickness has been measured by TEM from the 〈211〉 zone axis and shows a linear dependence on the growth time with a growth rate of about ∼23 nm h−1. | ||
During overgrowth of the InAs core with GaSb, the morphology of the NW changes. The InAs core has six side facets belonging to the {110} family as can be seen by the HAADF scan from the 〈110〉 zone axis plotted in Fig. 4a. The intensity of the HAADF signal depends on the thickness t as well as on the atomic number Z. In a first approximation, the intensity I scales linearly with t and with Z to the power of γ (I ∝ Zγ). Thus, in general it cannot be used to determine the facets in core–shell structures since both Z and t vary along the NW diameter. In the case of InAs and GaSb, having almost identical lattice constants, masses and average Z (In: 49, As: 33, InAs: 82; Ga: 31, Sb: 51, GaSb: 82), the materials can only hardly be distinguished by HAADF as long as atomic resolution is not reached. Thus, the HAADF profiles still give reasonable information about the NW shape. Consequently, a HAADF profile of an InAs/GaSb core–shell NW is plotted together with the profile of a pure InAs NW in Fig. 4a. As seen, the profile of the InAs/GaSb core–shell NW does not exhibit clear large facets but has a much more round shape. However, several short linear regions can be seen in the profile indicating a faceted cross-section rather than a round one. Fig. 4b depicts an SEM micrograph of the lower region of a core–shell NW with a 40 nm thick GaSb shell. The viewing direction is [![[1 with combining macron]](https://www.rsc.org/images/entities/char_0031_0304.gif) 2]. As seen, facets perpendicular to the viewing direction can be identified, thus being of {211} type. Apart from these facets, another set of facets rotated by 30° can be found, these are of {110} type. Thus, the HAADF profile is in agreement with the SEM image demonstrating core–shell NWs with multiple facets. This is schematically depicted in Fig. 4c: an InAs NW with 6 side facets of {110} type is surrounded by a GaSb shell having a dodecagonal outer shape which is bound by {110} and {211} side facets. Interestingly, this shape develops early during the shell growth and is maintained up to the longest investigated shell growth time of 90 min. Details on the time-dependence are given in the ESI.† Thus, it can be concluded that the growth rates and thus the chemical potentials for adatoms at the GaSb {110} and the {211} facets are similar. Treu et al. observed a similar behaviour while overgrowing InAs NWs with InP.25
2]. As seen, facets perpendicular to the viewing direction can be identified, thus being of {211} type. Apart from these facets, another set of facets rotated by 30° can be found, these are of {110} type. Thus, the HAADF profile is in agreement with the SEM image demonstrating core–shell NWs with multiple facets. This is schematically depicted in Fig. 4c: an InAs NW with 6 side facets of {110} type is surrounded by a GaSb shell having a dodecagonal outer shape which is bound by {110} and {211} side facets. Interestingly, this shape develops early during the shell growth and is maintained up to the longest investigated shell growth time of 90 min. Details on the time-dependence are given in the ESI.† Thus, it can be concluded that the growth rates and thus the chemical potentials for adatoms at the GaSb {110} and the {211} facets are similar. Treu et al. observed a similar behaviour while overgrowing InAs NWs with InP.25
 | ||
| Fig. 4 (a) HAADF profiles of InAs and InAs/GaSb core–shell NWs taken from the 〈110〉 zone axis. The profiles indicate the cross-sectional shape of the NWs. InAs NWs are bound by six {110} side facets while InAs/GaSb core–shell NWs are bound by twelve side facets belonging to the {110} and {211} family. Dashed lines are guides to the eye. (b) SEM image of the lower part of a core–shell NW showing the presence of multiple side facets. (c) Schematic of the cross-section of InAs/GaSb core–shell NWs. | ||
Evidence of a misfit dislocation free system
The low lattice mismatch of about 0.6% between InAs and GaSb results in a critical thickness of about 20 nm for layered systems before strain relaxation takes place.26 In NWs, the critical thickness not only depends on the lattice mismatch but also on the radius of the core. Consequently, the critical thickness is expected to increase for thin cores. Raychaudhuri and Yu27,28 developed a model to predict the critical thickness in core–shell NWs. Applying this model to the InAs/GaSb system with loop dislocations as well as considering the different crystal structures zinc blende (ZB) and wurtzite (WZ) and possible dislocation types (perfect and partial dislocations4), the critical thickness maps shown in Fig. 5a and b are obtained. The elastic constants of wurtzite InAs and GaSb are calculated using Martin transformation29 while the wurtzite lattice constants are obtained by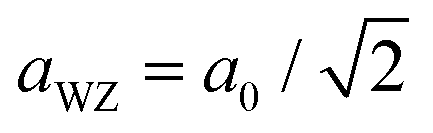 and
and 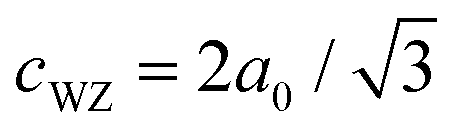 with a0 being the ZB lattice constant. As seen coherent growth is expected within a wide area. This means that core–shell NWs where either the core radius or the shell thickness are below 40 nm are coherently strained and thus dislocation free, independent on the other dimension (shell thickness or core radius). This is almost identical for both crystal structures. In this study, the NWs have a core radius of about 50 nm, resulting in a critical shell thickness of about 40–50 nm.
 | ||
| Fig. 5 Critical dimensions for coherent growth of InAs/GaSb core–shell NWs having zinc blende and wurtzite crystal structures. The critical dimensions are calculated using the model from ref. 27 and 28. Grey areas indicate the region of coherent growth whereas white areas are expected to be dislocated. Three different defect configurations were considered: Frank partial dislocations producing a stacking fault in the shell (“Shell stacking fault”, black line), Frank partial dislocations producing a stacking fault in the core (“Core stacking fault”, red line) and perfect dislocations (blue line). | ||
The coherent growth was investigated by means of (HR)TEM and SAED. For this purpose, NWs with different shell thicknesses were aligned to the 〈110〉 and 〈211〉 zone axes. Fig. 6a shows a TEM image acquired from the 〈110〉 zone axis exhibiting clear contrast between the core and the shell. However, the gradual decrease of the thickness of the InAs core towards its edges (due to the hexagonal morphology with {110} facets) makes it difficult to determine the interface and thus to gain information about the shell thickness or the interface abruptness. Nonetheless, the high number of planar defects such as twins and stacking faults being typical for VS InAs NWs can be seen, each of these defects penetrates from the core to shell indicating an epitaxial growth of the GaSb shell independent on the crystal structure or planar defects. A SAED image of this wire is shown in Fig. 6b, no splitting of the diffraction spots in axial or radial directions is seen suggesting coherent growth. However, the low lattice mismatch will only result in a small separation of the diffraction spots which might be hard to evaluate. Therefore, as an additional approach to investigate the coherent growth, the FFT of the HRTEM micrograph was calculated and a mask was applied maintaining only the {111} reflections. The inverse FFT which shows only the {111} planes is depicted in Fig. 6c. Each of the {111} planes continues perfectly from the core to the shell, no {111} planes ending at the interface, in the GaSb shell or in the InAs core are found. Thus, no misfit dislocations are seen over a length of ∼100 nm.
 | ||
| Fig. 6 (HR)TEM and SAED analyses of InAs/GaSb core–shell NWs with (a–f) 10 nm and (g–l) ∼40 nm thick GaSb shells from the 〈110〉 and 〈211〉 zone axes. A HRTEM image of a 10 nm thick shell from the 〈110〉 zone axis is shown in (a), a corresponding SAED pattern and FFT filtered image in (b) and (c), respectively. (d)–(f) Show similar images from the 〈211〉 zone axis. (g) Displays a low resolution TEM image of an InAs/GaSb core–shell NW with ∼40 nm thick shell from the 〈110〉 zone axis, (h) HRTEM image from the 〈110〉 zone axis, (i) SAED pattern. (j)–(l) TEM images and FFT filtered images of a ∼40 nm thick shell from the 〈211〉 zone axis. Colored overlays in (c), (f) and (l) indicate the different materials InAs (blue) and GaSb (red). The images from (a), (c), (d), (f), (h), (i), (k) and (l) are shown in larger scale in the ESI.† | ||
In GaAs/InAs4 and InAs/GaAs5 core–shell NWs with lattice mismatches of about 7% dislocations can often be identified by the presence of additional stacking faults caused by Frank partial dislocations. However, in those investigations the crystal structures of the cores were either (almost) pure ZB or WZ. The high density of planar defects in our InAs core NWs makes it difficult to find such partial dislocations within the NW.
The same NW as before is shown in Fig. 6d from the 〈211〉 zone axis, in this configuration the planar defects cannot be detected.30,31 However, this zone axis typically gives clear contrast between the core and the shell and therefore allows a precise measurement of the shell thickness. This is caused by the morphology of the core–shell NW where the InAs core is bound by {110} facets. Analyzing a NW with these facets from the {211} zone axis gives an abrupt change in thickness from the width of a single facet d to zero whereas the thickness linearly decreases towards the edge when analyzed from the conventional {110} zone axis. Schematically, both situations are displayed in the ESI.† Apart from this more precise measurement of the shell thickness, the abrupt change in chemical composition in a core–shell NW allows to investigate the interface roughness. As seen, the dark line corresponding to the interface is straight and does not exhibit any roughness. Therefore, we expect an abrupt interface. An analysis of the interface abruptness by means of EDX is difficult since the signals belonging to In and Sb strongly overlap in the region of 3–4 keV.
Similar as in the case of the 〈110〉 zone axis, the SAED pattern taken from the 〈211〉 zone axis shown in Fig. 6e does not show any splitting of diffraction spots. Assuming loop dislocation with Burgers vectors b parallel to the growth axis (b = a/3〈111〉, Frank partial dislocation) or b = a/2〈110〉 (perfect dislocation), also an analysis from the 〈211〉 zone axis will resolve these defects but not allowing to determine the type of dislocations. In this sense, Fig. 6f depicts the FFT-filtered HRTEM image from Fig. 6d. Identically to the former analyses, no dislocations are found.
A shell thickness in the range of 10 nm is, however, far below the critical thickness for InAs/GaSb and therefore expected to be misfit dislocation free. When the GaSb layer exceeds a thickness of 20 nm, strain relaxation is known to occur in planar films. Thus, TEM analyses of core–shell NWs with thicker shells of about 40 nm are shown in Fig. 6g–l. The low resolution micrograph in Fig. 6g clearly demonstrates the conformal core–shell morphology with relatively smooth side facets as well as stacking faults penetrating from the core to the shell. No Moiré fringes are seen in the image still indicating a pseudomorphic growth of the GaSb shell. The smooth side facets can be seen more clearly by the higher magnified image in Fig. 6h. Similarly as for thin GaSb shells, the SAED pattern (Fig. 6i) does not exhibit any splitting of the diffraction spots, neither in axial nor in radial direction.
Fig. 6j depicts a TEM micrograph from the 〈211〉 zone axis of a core–shell NW with a 40 nm thick shell. Again, no Moiré fringes are visible and smooth side facets can be seen. By the combination of the 〈110〉 and 〈211〉 zone axes, both side facets, {211} and {110}, of the core–shell NW can be seen. As outlined above and seen in the TEM images in Fig. 6, both side facets exhibit only a little roughness.
A HRTEM image from the 〈211〉 zone axis of this NW is shown in Fig. 6k, its FFT-filtered image in Fig. 6l. The abrupt contrast change from the core to the shell evidences a high interfacial quality even for thick shells and long shell growth durations. Both the HRTEM and the FFT-filtered image demonstrate dislocation free shells of 40 nm thickness and thus above the critical thickness for planar systems. However, the results perfectly match the calculations presented in Fig. 5: an InAs NW core of 50 nm radius can be covered with a GaSb shell of 40 nm thickness without the formation of misfit dislocations.
Origin of the platform formation
Finally, we discuss the formation of the GaSb platform with larger diameter than the core–shell NW itself. For this purpose, a TEM micrograph of the upper part of an InAs/GaSb core–shell NW is shown in Fig. 7a. As can be seen, the NW can be separated into two regions, a lower one being the InAs/GaSb core–shell system and an upper one being pure GaSb. The first one is characterized by a high density of stacking faults which originate from the InAs core. The contrast arising from the InAs core can be clearly seen in the lower part of the image. The upper part of the NW, however, exhibits a significantly smaller number of stacking faults in the axial direction. In this upper part, only GaSb is grown (see EDX scan from Fig. 2b). However, a higher density of planar defects is found in the radial direction. These occur when GaSb is grown radially on the ZB GaSb at the top. This radial growth creates the platform at the top of the NWs. The SAED pattern in Fig. 7b reveals two streaky pattern rotated by 70°, thus stacking faults and twins in two 〈111〉 directions. This can also be seen by the HRTEM image in Fig. 7c. The axially grown GaSb (in []B direction) has ZB crystal structure with a low density of stacking faults, WZ segments are not found. This is in agreement with the large energy difference between the ZB and WZ crystal structure for GaSb favouring the ZB structure.32 Identically, also the radial growth of GaSb at the top has ZB crystal structure but shows significantly more stacking faults and twins. However, here it has to be mentioned that the two discussed 〈111〉 directions are not equivalent. The axial growth is in []B direction while the radial GaSb on GaSb growth with higher planar defect density occurs in [1]A direction, radial growth of GaSb on GaSb in [11]B direction takes place as well but is slow as seen in Fig. 7a. Therefore, we conclude that the twin formation probability is higher in the [1]A than in the []B direction. In fact, Gorji Ghalamestani et al. observed similar behaviours when growing InP shells around InAs NWs with twinning superlattices and {111}-type side facets.![[thin space (1/6-em)]](https://www.rsc.org/images/entities/char_2009.gif) ‡33 Additionally, they observed a significantly higher growth rate in the [1]A than in the in the []B direction, also being in agreement with the results presented here. Fast growing facets will vanish while the slowly growing ones remain. As seen in Fig. 7a, the size of the {111}A facet continuously decrease while the {111}B facets keeps its dimensions and is flat as seen in the TEM image as well as in the SEM micrographs in Fig. 1. This growth behaviour at the top additionally explains the three-fold symmetry seen in the inset of Fig. 1d. The four 〈111〉A directions form a tetrahedron and the [111]A direction is directed into the substrate. Thus, seen from the top, the remaining 〈111〉A directions have a three-fold symmetry.
‡33 Additionally, they observed a significantly higher growth rate in the [1]A than in the in the []B direction, also being in agreement with the results presented here. Fast growing facets will vanish while the slowly growing ones remain. As seen in Fig. 7a, the size of the {111}A facet continuously decrease while the {111}B facets keeps its dimensions and is flat as seen in the TEM image as well as in the SEM micrographs in Fig. 1. This growth behaviour at the top additionally explains the three-fold symmetry seen in the inset of Fig. 1d. The four 〈111〉A directions form a tetrahedron and the [111]A direction is directed into the substrate. Thus, seen from the top, the remaining 〈111〉A directions have a three-fold symmetry.
 | ||
| Fig. 7 Origin of the platform formation on top of InAs/GaSb core–shell NWs. (a) TEM micrograph of the upper part of the core/shell NW clearly showing the stacking fault rich part induced by the InAs core as well as an axially grown part with less stacking faults being pure GaSb. In the upper part, additional stacking faults non-perpendicular to the growth direction can be seen. A SAED pattern of this region is shown in (b), a higher magnification image of the marked region in (a) demonstrating the stacking faults in different directions is displayed in (c). (d) Shows a TEM micrograph of a GaSb platform additionally exhibiting twins in the axial direction. The higher resolution image is shown in (e). The lower insets display FFTs of (e) and the colored areas in (e). | ||
As mentioned above, the axial growth of GaSb in []B direction does not result in a pure ZB crystal structure but also produces twin boundaries, but with a much lower density than in 〈111〉A directions. At these twin boundaries, the GaSb crystal rotates by 180° around the []B direction. Thus, all the 〈111〉 directions are rotated by 180°; the three-fold symmetry induced by the high growth rate in the 〈111〉A directions can then develop into a six-fold symmetry, which is also observed experimentally (Fig. 1c). However, slowly growing 〈111〉B facets are then in close neighbourhood to the fast growing 〈111〉A facets. These two growth fronts can then coalesce. Consequently, the HRTEM image and FFT of the upper region of these NWs become more complex as seen in Fig. 7d and e. A streaky FFT pattern with three streak orientations is observed. One of the orientations can be assigned to the []B direction (blue), another one to the [1]Aa direction (red) and the last one to its twinned counterpart [11]Bb (green). Here the subscripts a and b denote for the two ZB twins.
This multiple direction-twinned ZB GaSb can induce defects being present only in the upper pure GaSb region. Therefore, these defects are caused by the growth mechanism of GaSb on GaSb rather than the lattice mismatch between InAs and GaSb. To make the defects visible, Fig. 8 depicts a FFT-filtered HRTEM image of Fig. 7e. Some dislocations can be seen, two of them being magnified in the insets. Each of these dislocations is located at the connection point of the 〈111〉A and 〈111〉B directions. A more detailed description of this region can be found in the ESI.†
 | ||
| Fig. 8 FFT-filtered HRTEM image from Fig. 7e showing dislocations located in the GaSb platform not originating from the lattice mismatch between InAs and GaSb. Insets display higher magnification images clearly proving the dislocations. | ||
However, here, we want to point out that the dislocations in the upper pure GaSb region are far away from the interesting InAs/GaSb core–shell part and are observed only for rather thick shells. The core–shell region is free of dislocations as discussed in detail above. Thus, no impact from these defects on the device performance is expected.
Conclusions
To conclude, GaSb shells with high uniformity were grown around self-assisted InAs NWs by MBE. Depending on the growth temperature of the shell, either the entire NW is covered homogenously with GaSb or a tapered shell with absent shell growth at the bottom of the wire can be formed. Both configurations are highly interesting for future devices. The overgrowth is found to transform the cross-sectional shape of the NWs from hexagonal to dodecagonal with a combination of {110} and {211} side facets. In agreement with calculations, the low lattice mismatch of 0.6% between InAs and GaSb combined with the one-dimensional geometry results in misfit dislocation free core–shell NWs for shell thicknesses of at least 40 nm, thus a value twice as high as for layered systems. This confirms the excellent suitability of NWs for lattice mismatched heterostructures. These core–shell NWs with broken gap band alignment enable the investigation of TFETs for next generation, low energy electronics as well as novel physical phenomena of two dimensional topological insulators in the NW geometry. To the best of our knowledge, this study represents the first investigation of conformal III–V core–shell NWs grown by MBE exhibiting a change of both anions and cations when switching from the core to the shell.Acknowledgements
The authors acknowledge support in MBE growth by Ch. Krause. The TEM facilities at the Ernst Ruska Centre at the Forschungszentrum Jülich are gratefully acknowledged.Notes and references
- Ö. Gül, N. Demarina, C. Blömers, T. Rieger, H. Lüth, M. I. Lepsa, D. Grützmacher and Th. Schäpers, Phys. Rev. B: Condens. Matter, 2014, 89, 045417 CrossRef.
- M. Heiss, Y. Fontana, A. Gustafsson, G. Wüst, C. Magen, D. D. O'Regan, J. W. Luo, B. Ketterer, S. Conesa-Boj, A. V. Kuhlmann, J. Houel, E. Russo-Averchi, J. R. Morante, M. Cantoni, N. Marzari, J. Arbiol, A. Zunger, R. J. Warburton and A. Fontcuberta i Morral, Nat. Mater., 2013, 12, 439 CrossRef CAS PubMed.
- E. Dimakis, U. Jahn, M. Ramsteiner, A. Tahraoui, J. Grandal, X. Kong, O. Marquardt, A. Trampert, H. Riechert and L. Geelhaar, Nano Lett., 2014, 14, 2604 CrossRef CAS PubMed.
- T. Rieger, M. Luysberg, T. Schäpers, D. Grützmacher and M. I. Lepsa, Nano Lett., 2012, 12, 5559 CrossRef CAS PubMed.
- R. Popovitz-Biro, A. Kretinin, P. Von Huth and H. Shtrikman, Cryst. Growth Des., 2011, 11, 3858 CAS.
- K. L. Kavanagh, J. Salfi, I. Savelyev, M. Blumin and H. E. Ruda, Appl. Phys. Lett., 2011, 98, 152103 CrossRef PubMed.
- A. Biermanns, T. Rieger, G. Bussone, U. Pietsch, D. Grützmacher and M. I. Lepsa, Appl. Phys. Lett., 2013, 102, 043109 CrossRef PubMed.
- C. M. Haapamaki, J. Baugh and R. R. LaPierre, J. Appl. Phys., 2012, 112, 124305 CrossRef PubMed.
- V. V. R. Kishore, B. Partoens and F. M. Peeters, Phys. Rev. B: Condens. Matter, 2012, 86, 165439 CrossRef.
- J. Knoch and J. Appenzeller, IEEE Electron Device Lett., 2010, 31, 305 CrossRef CAS.
- M. Paladugu, J. Zou, Y.-N. Guo, X. Zhang, Y. Kim, H. J. Joyce, Q. Gao, H. H. Tan and C. Jagadish, Appl. Phys. Lett., 2008, 93, 101911 CrossRef PubMed.
- I. Knez, R.-R. Du and G. Sullivan, Phys. Rev. Lett., 2011, 107, 136603 CrossRef.
- A. W. Dey, J. Svensson, M. Ek, E. Lind, C. Thelander and L.-E. Wernersson, Nano Lett., 2013, 13, 5919 CrossRef CAS PubMed.
- B. Ganjipour, M. Ek, B. Mattias Borg, K. A. Dick, M.-E. Pistol, L.-E. Wernersson and C. Thelander, Appl. Phys. Lett., 2012, 101, 103501 CrossRef PubMed.
- T. Rieger, D. Grützmacher and M. I. Lepsa, Phys. Status Solidi RRL, 2013, 7, 840 CrossRef CAS.
- S. Lehmann, D. Jacobsson, K. Deppert and K. A. Dick, Nano Res., 2012, 5, 470 CrossRef CAS PubMed.
- M. J. L. Sourribes, I. Isakov, M. Panfilova, H. Liu and P. A. Warburton, Nano Lett., 2014, 14, 1643 CrossRef CAS PubMed.
- R. Hao, Y. Xu, Z. Zhou, Z. Ren, H. Ni, Z. He and Z. Niu, J. Phys. D: Appl. Phys., 2007, 40, 6690 CrossRef CAS.
- J. B. Rodriguez, P. Christol, L. Cerutti, F. Chevrier and A. Joullié, J. Cryst. Growth, 2005, 274, 6 CrossRef CAS PubMed.
- B. Z. Nosho, B. R. Bennett, L. J. Whitman and M. Goldenberg, J. Vac. Sci. Technol., B Microelectron. Nanometer. Struct., 2001, 19, 1626 CrossRef CAS.
- A. N. Baranov, N. Bertru, Y. Cuminal, G. Boissier, C. Alibert and A. Joullié, Appl. Phys. Lett., 1997, 71, 735 CrossRef CAS PubMed.
- E. Dimakis, M. Ramsteiner, A. Tahraoui, H. Riechert and L. Geelhaar, Nano Res., 2012, 5, 796 CrossRef CAS.
- F. Glas and J.-C. Harmand, Phys. Rev. B: Condens. Matter, 2006, 73, 155320 CrossRef.
- P. Krogstrup, R. Popovitz-Biro, E. Johnson, M. H. Madsen, J. Nygård and H. Shtrikman, Nano Lett., 2010, 10, 4475 CrossRef CAS PubMed.
- J. Treu, M. Bormann, H. Schmeiduch, M. Döblinger, S. Morkötter, S. Matich, P. Wiecha, K. Saller, B. Mayer, M. Bichler, M.-C. Amann, J. J. Finley, G. Abstreiter and G. Koblmüller, Nano Lett., 2013, 13, 6070 CrossRef CAS PubMed.
- A. Y. Babkevich, R. A. Cowley, N. J. Mason, S. Sandiford and A. Stunault, J. Phys.: Condens. Matter, 2002, 14, 7101 CrossRef CAS.
- S. Raychaudhuri and E. T. Yu, J. Vac. Sci. Technol., B Microelectron. Nanometer. Struct., 2006, 24, 2053 CrossRef CAS.
- S. Raychaudhuri and E. T. Yu, J. Appl. Phys., 2006, 99, 114308 CrossRef PubMed.
- R. Martin, Phys. Rev. B: Solid State, 1972, 6, 4546 CrossRef CAS.
- J. Johansson, L. S. Karlsson, C. P. T. Svensson, T. Mårtensson, B. . Wacaser, K. Deppert, L. Samuelson and W. Seifert, Nat. Mater., 2006, 5, 574 CrossRef CAS PubMed.
- S. Dayeh, C. Soci and X. Bao, Nano Today, 2009, 4, 347 CrossRef CAS PubMed.
- T. Akiyama, K. Sano, K. Nakamura and T. Ito, Jpn. J. Appl. Phys., 2006, 45, L275 CrossRef CAS.
- S. Gorji Ghalamestani, M. Heurlin, L.-E. Wernersson, S. Lehmann and K. A. Dick, Nanotechnology, 2012, 23, 285601 CrossRef PubMed.
Footnotes |
| † Electronic supplementary information (ESI) available: Cross sectional shape along the nanowire axis, evolution of the cross sectional shape, comparison of the 〈110〉 and the 〈211〉 zone axis, HRTEM images, evolution of the GaSb platform ad multiple twinning induced defects in the GaSb platform. See DOI: 10.1039/c4nr05164e |
| ‡ Although not mentioned in their paper, one can see stacking faults/twins in the 〈111〉A but not in the 〈111〉B direction. |
| This journal is © The Royal Society of Chemistry 2015 |