DOI:
10.1039/C4NJ01169D
(Paper)
New J. Chem., 2015,
39, 604-613
Preparation of carbon-coated lithium iron phosphate/titanium nitride for a lithium-ion supercapacitor
Received
(in Montpellier, France)
14th July 2014
, Accepted 28th October 2014
First published on 29th October 2014
Abstract
Carbon-coated lithium iron phosphate (C-LiFePO4) supported on a titanium nitride (TiN) substrate was designed as the electrode material for a lithium-ion supercapacitor for an energy storage application. C-LiFePO4 nanoparticles were prepared via a hydrothermal synthesis and carbonization treatment process. TiN nanowires were prepared using an anodization oxidation and nitridization process. A C-LiFePO4/TiN nanowire network was synthesized by loading C-LiFePO4 nanoparticles onto TiN nanowires through a chemical bath deposition method. The surface morphology and microstructure of C-LiFePO4/TiN were characterized using scanning electron microscopy, X-ray diffraction and Raman spectrum analysis. The lithium-ion insertion–extraction behavior of the C-LiFePO4/TiN in a Li2SO4 aqueous electrolyte was investigated by cyclic voltammetry, electrochemical impedance spectroscopy and galvanostatic charge–discharge measurements. C-LiFePO4/TiN exhibited a high capacitance of 972 F g−1 at the current density of 1.0 A g−1, presenting a capacity improvement of 210% when compared with 314 F g−1 for LiFePO4/TiN. The C-LiFePO4/TiN nanowire network also exhibited good cycle stability and high rate capability, presenting a promising application of the lithium-ion supercapacitor.
1. Introduction
Lithium iron phosphate (LiFePO4) has been recognized as a promising candidate to replace lithium cobalt oxide as the cathode material in lithium-ion batteries and exhibits a reversible electrochemical lithium-ion insertion–extraction reaction at 3.5 V (vs. Li/Li+) with a theoretical specific capacity of 170 mA h g−1.1–3 LiFePO4 also displays a good cycle stability and excellent thermal and chemical stability.4,5 However, LiFePO4 is usually regarded as the cathode material for lithium-ion batteries rather than the electrode material for the supercapacitors. The poor conductivity, resulting from the low lithium-ion diffusion rate and low electrical conductivity of LiFePO4, has posed a bottleneck for electrochemical supercapacitor applications. Bare LiFePO4 is an insulator with an electrical conductivity of about 10−9–10−11 S cm−1. The chemical diffusion coefficient of lithium ion is in the range of 10−11–10−13 cm2 s−1 depending on the microstructure of LiFePO4 and Li+ concentration.6,7 The electrical conductivity can be improved by means of carbon,8 metal3 or metal oxide coating,9 and Li-site10 or Fe-site ion doping.11 Among these methods, carbon coating on the LiFePO4 particle surface is found to be a very effective way.12
On the other hand, the current collector materials also play an important role in the charge–discharge process of electroactive materials. Well-designed TiO2 nanoarray and its nanocomposites have been well tailored and widely used as various functional materials.13–19 TiN is one of the good conductive materials with a bulk electrical conductivity of about 5 × 10⁴ S cm−1. Inclusively, TiN nanoarray and its nanocomposites can be well used as excellent electrode materials for electrochemical energy storage applications.20–26 Particularly, the high capacity and rate capability of TiN-coated LiFePO4/C powders were reported.27 The discontinuous carbon coating layer of LiFePO4/C was repaired using TiN particles to enhance the conductivity and rate capability of the composite electrode material. TiN modification was beneficial for ameliorating the overall activity and kinetics process. The improvement was mainly attributed to the lower charge transfer resistance and higher lithium ions diffusion coefficient. In most studies, LiFePO4/C powders were only regarded as the electrode material of the Li-ion cells. It is believed that the conductive TiN with an integrated and continuous coating layer network is able to effectively improve electrochemical capacitance and rate capability of LiFePO4. So, the C-LiFePO4 can be applied as the electrode material of the supercapacitor where a highly conductive TiN nanoarray is used as the current collector.
In this study, C-LiFePO4/TiN was designed as the electrode material for a lithium-ion supercapacitor for an energy storage application. C-LiFePO4 was obtained using a hydrothermal synthesis and carbonization treatment process, which was then supported on the TiN nanowires to form a C-LiFePO4/TiN nanowire network electrode. The carbon modification can improve the conductivity and also prevent the aggregation of LiFePO4.28Fig. 1 shows a schematic illustration of the lithium-ion charge–discharge process in the C-LiFePO4/TiN nanowire network. The carbon can provide a better electrical connection among the LiFePO4 particles and between the LiFePO4 particle and the TiN current collector.29 Carbon also acts as a reducing agent to avoid the further oxidation of ferrous ions (Fe2+) in LiFePO4.30,31 The TiN nanowires stack together to form an open nanoporous network structure, providing an accessible surface area for lithium ion diffusion. TiN nanowires act as the substrate and the current collector; the carbon acts as the electron transport channel between the LiFePO4 and the current collector and the LiFePO4 acts as the electroactive material. The strategy using carbon coating and the TiN nanowire substrate could promote charge transfer in LiFePO4, enabling C-LiFePO4/TiN to have good energy storage properties.
 |
| | Fig. 1 A schematic illustration of lithium-ion charge–discharge process in C-LiFePO4/TiN nanowire network. | |
2. Experimental
The starting materials used for synthesizing C-LiFePO4/TiN nanocomposites included Fe(NO3)3·9H2O (AR), NH4H2PO4 (AR), CH3COOLi·2H2O (AR), citric acid (AR), sucrose (AR), ethylene glycol (AR), ammonia atmosphere (99.99% purity) and titanium sheet (99.9% purity). Fe(NO3)3·9H2O, NH4H2PO4, CH3COOLi·2H2O, citric acid, sucrose, ethylene glycol were purchased from Sinopharm Chemical Reagent Co., Ltd. All the chemicals were used as received without further purification. The deionized (DI) water through the Millipore system with a resistivity of approx. 18.0 MΩ cm−1 was used.
2.1. Material preparation
Fig. 2 shows the schematic illustration of the preparation of the C-LiFePO4/TiN nanowire network. Firstly, TiN nanowires were prepared through the typical anodization, calcination, and nitridization processes using the precursor Ti foil, which acted as the electrode substrate. Then, C-LiFePO4 nanoparticles were prepared through a hydrothermal synthesis and carbonization treatment process using the precursors of CH3COOLi, Fe(NO3)3, NH4H2PO4, citric acid and sucrose, which acted as the electroactive material. Finally, C-LiFePO4 nanoparticles were deposited on TiN nanowires to form a C-LiFePO4/TiN nanowire network, which acted as the electrode material for the lithium-ion supercapacitor.
 |
| | Fig. 2 A schematic illustration of the preparation of C-LiFePO4/TiN nanowire network. | |
Synthesis of TiN nanowires: firstly, TiO2 nanowires were directly grown on the Ti foil using an anodization process at 60 V for 3 h. Prior to anodization, the Ti foil was cleaned by ultrasonication in acetone, ethanol, and then deionized water. The ethylene glycol electrolyte solution contained 0.075 M NH4F and 6.0 M H2O. The as-prepared TiO2 nanowires were annealed at 450 °C for 3 h. Finally, the TiN nanowires were prepared by a nitridization treatment of anatase TiO2 nanwires, which was conducted at 900 °C for 2 h in a tubular furnace in an ammonia atmosphere with a flow rate of 50 mL min−1. The progressive heating rates included 5 °C min−1 from a room temperature to 300 °C, 2 °C min−1 from 300 to 800 °C, and 1 °C min−1 from 800 to 900 °C. Finally, TiN nanwires were obtained after cooling down to room temperature. In the nitridization process, the ammonia atmosphere and the calcination temperature played key roles to fully convert TiO2 into TiN.
Synthesis of C-LiFePO4: C-LiFePO4 nanoparticles were carried out by a hydrothermal synthesis and carbonization treatment process.32 Fe(NO3)3·9H2O acted as the iron source; CH3COOLi·2H2O acted as the lithium source; citric acid the reducing agent; and sucrose acted as the carbon source. The stoichiometric amounts of CH3COOLi·2H2O, Fe(NO3)3·6H2O, NH4H2PO4 and citric acid in a molar ratio of 1![[thin space (1/6-em)]](https://www.rsc.org/images/entities/char_2009.gif) :1:1:1 were dissolved in distilled water to form a transparent solution. This mixture was then transferred into a 100 mL Teflon-lined stainless steel autoclave and maintained at 180 °C for 6 h. In the hydrothermal process, citric acid served as the reducing agent for the partial reduction of ferric ions (Fe3+). The hydrothermal solution obtained was evaporated at 80 °C under vacuum conditions until a light green LiFePO4 powder was obtained. The as-prepared LiFePO4 powder was immersed in a sucrose solution where the weight ratio of sucrose/LiFePO4 was 0.25:1. This pretreated product was calcined at 650 °C for 10 h under a nitrogen atmosphere to form C-LiFePO4 nanoparticles. For a comparison, bare LiFePO4 nanoparticles were also prepared using the same procedure as mentioned above except for the carbonization treatment using sucrose solution.
:1:1:1 were dissolved in distilled water to form a transparent solution. This mixture was then transferred into a 100 mL Teflon-lined stainless steel autoclave and maintained at 180 °C for 6 h. In the hydrothermal process, citric acid served as the reducing agent for the partial reduction of ferric ions (Fe3+). The hydrothermal solution obtained was evaporated at 80 °C under vacuum conditions until a light green LiFePO4 powder was obtained. The as-prepared LiFePO4 powder was immersed in a sucrose solution where the weight ratio of sucrose/LiFePO4 was 0.25:1. This pretreated product was calcined at 650 °C for 10 h under a nitrogen atmosphere to form C-LiFePO4 nanoparticles. For a comparison, bare LiFePO4 nanoparticles were also prepared using the same procedure as mentioned above except for the carbonization treatment using sucrose solution.
Synthesis of C-LiFePO4/TiN: C-LiFePO4/TiN nanowire network was synthesized using a chemical bath deposition method. The C-LiFePO4 nanoparticles were put into the ethanol solution and mixed through ultrasonic treatment. Then, the C-LiFePO4 suspension was dropped on the TiN nanowires. Finally, the C-LiFePO4/TiN nanowire network was obtained after thoroughly washing with ethanol and deionized water, and dried in air. For a comparison, the LiFePO4/TiN nanowire network was also prepared using the same procedure without any carbon modification.
2.2. Characterization and electrochemical measurement
The morphology and microstructure of C-LiFePO4/TiN electrode material were characterized using scanning electron microscopy (SEM, Hitachi S-4700). The crystal phase of C-LiFePO4/TiN was characterized using X-ray diffractometry (XRD, Rigaku D/max 2550 PC, Cu Ka). The carbon coating effect in C-LiFePO4/TiN was investigated using Raman spectroscopy (Raman, Renishaw Invia Reflex System, UK) in the range of 100–2000 cm−1, which was equipped with a He–Ne laser beam operating at a wavelength of 532 nm. The three-electrode system setup was fully applied for the electrochemical testing. The electrochemical performance of C-LiFePO4/TiN was investigated using cycle voltammetry (CV) and electrochemical impedance spectroscopy (EIS). The CV curves were measured in a potential range of −1.0 to 0 V (vs. SCE) using an electrochemical workstation (CHI760C, CH Instruments, USA). The EIS was measured at an electrode potential of 0 V or 0.5 V vs. SCE, a perturbation potential of 5 mV and a frequency range of 0.01–100000 Hz using the electrochemical workstation (IM6e ZAHNER Elektrik, Germany). The electrochemical capacitance was investigated through galvanostatic charge–discharge measurements using an electrochemical workstation (PAR VersaSTAT3, Princeton Applied Research, USA). The three-electrode system included the working electrode of C-LiFePO4/TiN, the counter electrode of a platinum plate, Hg/Hg2Cl2 reference electrode and 0.5 M Li2SO4 aqueous electrolyte solution. All the electrolytes used above were 0.5 M Li2SO4 aqueous solution. Specific (mass and area) capacitances were calculated using eqn (1).where I represents the constant discharge current (mA). ΔV and Δt denote the potential window (V) and total discharge time (s), respectively. A represents the mass of electroactive materials (mg) or the geometrical area of the electrode (cm2).
3. Results and discussion
In this paper, the carbon-coated lithium iron phosphate (C-LiFePO4) supported on the titanium nitride (TiN) substrate was designed as the electrode material of lithium-ion supercapacitor for an energy storage application. The C-LiFePO4/TiN nanocomposite were fabricated using a chemical bath deposition method. The preparation of these samples have not yet been reported and so this part will focus on materials and eletrochemical properties.
3.1. Morphology characterization
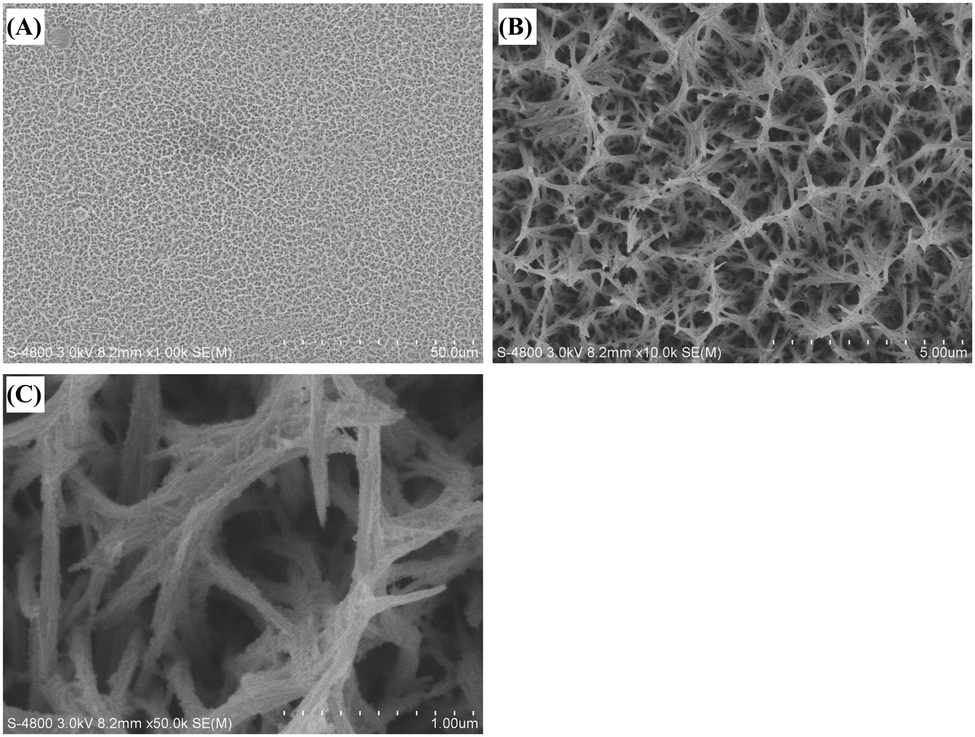
Fig. 3(A–C) shows SEM images of the TiN substrate with different resolutions. As-formed TiN presented the nanowire morphology. TiN nanowires were directly grown on the Ti foil. These cross-linked TiN nanowires formed the open nanoporous network structure, which could provide the accessible surface area. It was also beneficial for the electron transport in the TiN nanowires when electrons were generated from the electrochemical Li+ insertion–extraction reaction of C-LiFePO4. Besides, the porous network structure of the TiN nanowires allowed an easy diffusion of electrolyte ions into the inner region of the C-LiFePO4/TiN electrode.
 |
| | Fig. 3 (A–C) SEM images of TiN nanowires with different resolution. | |
Fig. 4(A–C) shows SEM images of the C-LiFePO4/TiN nanowire network with different resolutions. LiFePO4 nanoparticles were attached onto the TiN nanowires. The size of C-LiFePO4 nanoparticles was about 30 nm. Herein, C-LiFePO4 composite was firstly attached to TiN nanowires and then aggregated to cover TiN nanowires through a chemical bath deposition process. The tight bonding of C-LiFePO4 to the TiN nanowires provided good electrical contact and structural stability of this electrode material. In addition, the interspace between the C-LiFePO4 nanoparticles could favor electrochemical reaction inside the electroactive material and fast lithium-ion transport as well. The overlapping nanoparticles resulted from the TiN nanowires promoted the lithium-ion diffusion to the interior of C-LiFePO4.
 |
| | Fig. 4 (A–C) SEM images of C-LiFePO4/TiN nanowire network with different resolution. | |
3.2. XRD analysis
Fig. 5 shows the XRD pattern of C-LiFePO4 and the standard diffraction peaks of LiFePO4 (JCPDS, No. 83-2092). C-LiFePO4 demonstrated the characteristic diffraction peaks at 2θ = 17.1°, 20.8°, 22.7°, 24.0°, 25.6°, 29.7°, 32.2°, 32.2°, 35.6°, 37.9°, 39.6° and 39.8°, which were corresponding to the crystal planes of (200), (101), (210), (011), (111), (201), (211), (020), (301), (311), (121) and (410), respectively. C-LiFePO4 exhibited the crystal structure of a single olivine-type phase. The impurity crystal phase was not detected, indicating the high-yield formation of an olivine LiFePO4 in the hydrothermal synthesis process. There were no obvious carbon diffraction peaks seen in the XRD pattern of C-LiFePO4 due to its low content and amorphous form.
 |
| | Fig. 5 XRD pattern of C-LiFePO4 powder and the standard diffraction peaks of LiFePO4. | |
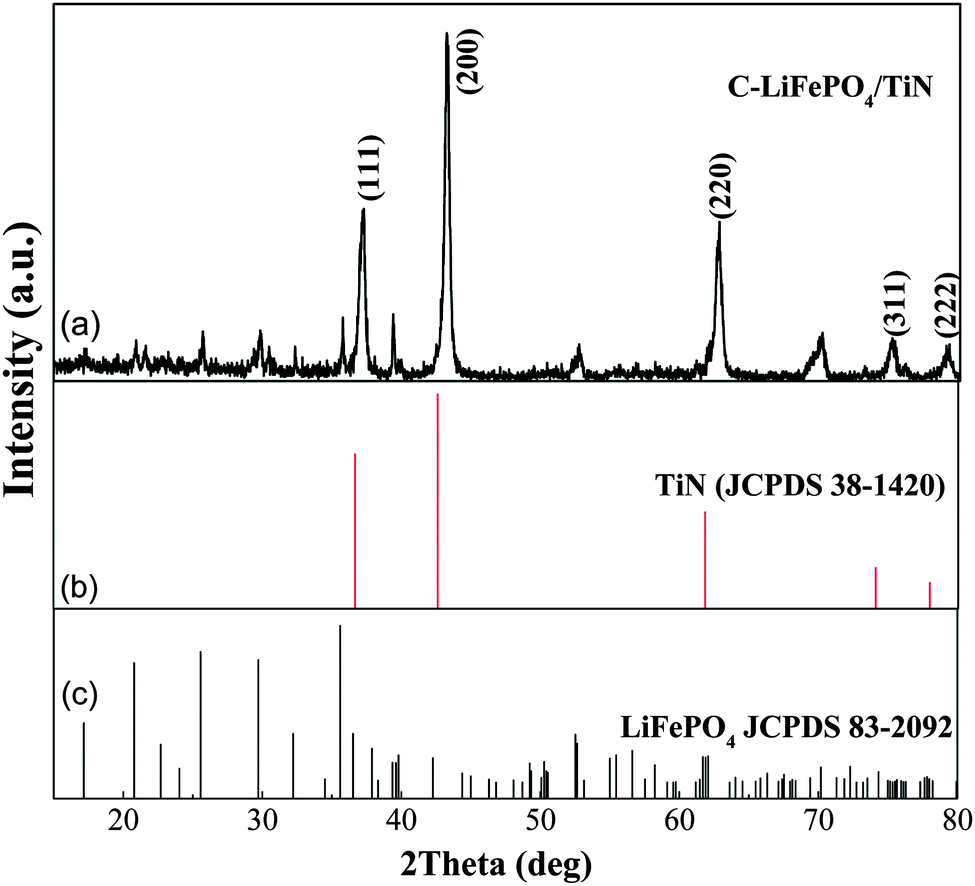
Fig. 6 shows the XRD pattern of C-LiFePO4/TiN thin film and the standard diffraction peaks of TiN and LiFePO4. The characteristic diffraction peaks of a single olivine-type LiFePO4 were observed. Comparatively, the weak diffraction peak intensity of LiFePO4 was due to the small loading mass of LiFePO4 supported on the TiN substrate. According to the standard diffraction peak of TiN (JCPDS, No. 38-1420), C-LiFePO4/TiN also exhibited the characteristic diffraction peaks at 2θ = 36.9°, 43.1°, 62.6°, 74.1° and 77.9°, which were ascribed to the crystal planes of (111), (200), (220), (311) and (222) of the TiN substrate. TiN exhibited the crystal structure of the osbornite phase. So the C-LiFePO4/TiN electrode consisted of the olivine-type phase LiFePO4 electroactive material and osbornite phase TiN substrate material. Any other impurities were not observed in C-LiFePO4/TiN electrode. The chemical structure of the active ingredient of LiFePO4 kept stable during the carbonization process.
 |
| | Fig. 6 XRD pattern of (a) C-LiFePO4/TiN thin film and (b, c) the standard diffraction peaks of TiN and LiFePO4. | |
3.3. Raman spectrum analysis
Raman spectroscopy was used to investigate the carbon coating effect in C-LiFePO4 since its amorphous carbon cannot be detected well by XRD analysis. Fig. 7 shows the Raman spectra of LiFePO4 and C-LiFePO4. LiFePO4 exhibited characteristic Raman peaks in the range of 600–1100 cm−1, which included a strong Raman peak at 955 cm−1 and other weak Raman peaks at 625 cm−1, 996 cm−1 and 1065 cm−1. These peaks were assigned to ν1, ν4, ν3 and ν3 intramolecular stretching modes of the PO43− anion.33 It did not show a broad peak in the range of 1200–1800 cm−1. Comparatively, C-LiFePO4 exhibited a much weaker characteristic Raman peak at 955 cm−1, suggesting that the carbon coating on the surface of LiFePO4 could screen the LiFePO4 from Raman spectrum detection.34 Noticeably, two intensive broad Raman peaks were observed at 1346 cm−1 and 1593 cm−1, corresponding to the D band and the G band of the carbon, respectively.29 The observation of the D band and G band of the carbon indicates that the carbon had been well coated on LiFePO4 to from C-LiFePO4. In order to further analyze the above D and G bands of the carbon, the Raman spectrum was deconvoluted into four-Gaussian bands, whose peaks were located at 1279 cm−1 (Gaussian band 1), 1356 cm−1 (Gaussian band 2), 1458 cm−1 (Gaussian band 3) and 1588 cm−1 (Gaussian band 4), respectively. The Gaussian bands 2 and 4 were contributed by the sp2-type graphite-like structure. The Gaussian bands 1 and 3 were contributed by the sp3-type amorphous carbon structure. Therefore, the overall intensity ratio Isp2/Isp3 could be used to describe the degree of graphitization of carbon. In other words, the calculated intensity ratio of Isp2/Isp3 was an index of the disordering degree. Herein, Isp2 and Isp3 associated with the total areas of (Gaussian bands 2 and 4) and (Gaussian bands 1 and 3), respectively.34 The peak areas of the Gaussian 1, 2, 3 and 4 were 478.42, 8353.89, 3206.53 and 3214.84, respectively. The calculated value of Isp2/Isp3 was 3.14 for C-LiFePO4, indicating that most of the carbon existed in the form of graphite, while the others existed in the form of amorphous carbon.
 |
| | Fig. 7 Raman spectra of (a) LiFePO4 and (b) C-LiFePO4. | |
3.4. Electrochemical impedance spectroscopy analysis
The electrochemical impedance spectroscopy was used to evaluate the charge transfer and ion diffusion properties of the C-LiFePO4/TiN electrode. Fig. 8(A) shows the EIS Nyquist plots and the corresponding fitting curves of the LiFePO4/TiN and C-LiFePO4/TiN nanowire network electrodes in 0.5 M Li2SO4 aqueous solution at an electrode potential of 0 V. The enlarged plot at the high frequency region is shown in the inset. Usually, the electrochemical impedance spectra consist of a semicircle in the high frequency region and a straight line in the low-frequency region. C-LiFePO4/TiN exhibited a smaller semicircle diameter with the real axis compared to LiFePO4/TiN, indicating the smaller charge transfer resistance of C-LiFePO4/TiN. Fig. 8(B) shows the equivalent circuit of the above EIS Nyquist plots, which involves elements of the bulk solution resistance (Rs), charge transfer resistance (Rct), constant phase element (CPE) and Warburg diffusion element (W).35 The W value was related to the lithium-ion diffusion in the insertion–deinsertion process of the electroactive materials in Li2SO4 electrolyte solution. The fitting curves of the equivalent circuit were obtained using the Zview software. The good fitting results implied that the equivalent circuit model could reasonably reflect the occurrence of the electrochemical process. The impedance of CPE (ZCPE) can be expressed as the formula (2).| |  | (2) |
where ω is the angular frequency and i is the imaginary number; CPET is the capacitance when CPEP = 1; CPEP is the constant phase element exponent.
 |
| | Fig. 8 (A) EIS Nyquist plots of LiFePO4/TiN and C-LiFePO4/TiN electrodes and (B) the corresponding equivalent circuit. | |
The Warburg diffusion impedance (ZW) can be expressed as the formula (3).
| |  | (3) |
where
WR is the diffusion resistance (Warburg diffusion resistance);
WT is diffusion time constant and
WP is a fractional exponent between 0 and 1.
WT is equal to

, where
L and
D are the effective diffusion length and diffusion coefficient, respectively. The total electrochemical impedance (
Ztotal) of the equivalent circuit can be expressed as the
formula (4).
| |  | (4) |
Table 1 lists the fitting values of the equivalent circuit elements of LiFePO4/TiN and C-LiFePO4/TiN tested at an electrode potential of 0 V. Obviously, C-LiFePO4/TiN exhibited smaller values of Rs and Rct than LiFePO4/TiN. According to the fitted values listed in the Table 1, the Ztotal was determined to be 5.447 Ω for LiFePO4/TiN and 2.678 Ω for C-LiFePO4/TiN. It indicates that the carbon coating on the LiFePO4 could effectively improve the electrical conductivity of electrode materials. Our study indicated that LiFePO4/TiN and C-LiFePO4/TiN electrodes in the same electrolyte solution exhibited a shift of Rs values. The similar results were also reported that FePO4 electrode in the same electrolyte solution exhibited different Rs values.36 Herein, the Rs was related to not only the bulk solution resistance, but also the liquid junction resistance. The different ion migration rate usually caused the different liquid junction resistance. In this study, the Rs of C-LiFePO4/TiN was 1.824 Ω, while the Rs of LiFePO4/TiN was 2.103 Ω. Due to the existence of carbon, the value of Rs of C-LiFePO4/TiN was smaller than that of LiFePO4/TiN. The carbon coating on the LiFePO4 could increase the ion migration rate and decrease the liquid junction resistance, accordingly leading to a smaller Rs value. Our study indicated that both LiFePO4/TiN and C-LiFePO4/TiN had similar semicircles sharply in the high frequency region. The fitting value of Rct was 0.3645 Ω for LiFePO4/TiN and 0.2512 Ω for C-LiFePO4/TiN and, presenting a small decrease of charge transfer resistance due to the carbon coating. It is believed that highly conductive TiN nanowires could effectively improve the total conductivity of LiFePO4/TiN and C-LiFePO4/TiN composites to the similar level. The carbon coating still played a positive role to improve the charge transfer effect to a certain degree.
Table 1 Fitting values of the equivalent circuit elements of LiFePO4/TiN and C-LIFePO4/TiN tested at an electrode potential of 0 V
| Equivalent circuit elements |
Fitting values of different electrode materials |
| LiFePO4/TiN |
C-LiFePO4/TiN |
|
R
s (Ω) |
2.103 |
1.824 |
| CPET |
0.40058 |
0.0097889 |
| CPEP |
0.9844 |
0.94189 |
|
R
ct (Ω) |
0.3645 |
0.2512 |
|
W
R
|
0.5391 |
0.45538 |
|
W
T
|
0.003011 |
0.61681 |
|
W
P
|
0.29718 |
0.58246 |
Fig. 9(A) shows EIS Nyquist plots and the corresponding fitting curves of C-LiFePO4/TiN in 0.5 M Li2SO4 aqueous solution at an electrode potential of 0 V and 0.5 V. The enlarged plots at the high frequency region are shown in the inset. Two fitting curves showed the similar semicircles at the high frequency region and the similar straight lines at the low-frequency region, presenting a similar polarization process and diffusion process of the same C-LiFePO4/TiN electrode at different electrode potentials. Table 2 lists the fitting values of the equivalent circuit elements. A similar Rs value and a slightly smaller Rct value were obtained at 0.5 V when compared with 0 V. The Ztotal value was accordingly determined to be 2.678 Ω at 0 V and 2.645 Ω at 0.5 V. It indicates that the interfacial charge transfer was more effective at a higher electrode potential. However, the electrode potential seldom influenced the total electrochemical impedance to a certain extent. Fig. 9(B) shows the corresponding linear fitting curves of EIS Nyquist plots at the low frequency region. The slopes of both fitting straight lines were much larger than that of 45° straight line, indicating typical capacitor behavior.37 Comparatively, the slope of the straight line at 0.5 V was larger than that at 0 V. It demonstrates that the diffusion movement of Li+ was more feasible at a higher electrode potential.
 |
| | Fig. 9 (A) EIS Nyquist plots of the C-LiFePO4/TiN electrode at a potential of 0 V and 0.5 V; (B) the corresponding linear fitting curves of EIS Nyquist plots at the high frequency region. | |
Table 2 Fitting values of the equivalent circuit elements of C-LiFePO4/TiN tested at different potential
| Equivalent circuit elements |
Fitting values at different potential (V) |
| 0 V |
0.5 V |
|
R
s (Ω) |
1.824 |
1.826 |
| CPET |
0.0097889 |
0.015723 |
| CPEP |
0.94189 |
0.9993 |
|
R
ct (Ω) |
0.2512 |
0.2226 |
|
W
R
|
0.45538 |
0.30786 |
|
W
T
|
0.61681 |
0.32876 |
|
W
P
|
0.58246 |
0.60593 |
3.5. Cyclic voltammetry and galvanostatic charge–discharge analysis
To study the electrochemical properties of C-LiFePO4/TiN and LiFePO4/TiN, the electrochemical cyclic voltammetry and galvanostatic charge–discharge measurements were conducted using a three-electrode system in 0.5 M Li2SO4 electrolyte solution. Fig. 10(A) shows that the CV curves of LiFePO4/TiN and C-LiFePO4/TiN at the same scan rate of 100 mV s−1. The current density of C-LiFePO4/TiN was much larger than that of LiFePO4/TiN at the same potential. Fig. 10(B) shows the galvanostatic charge–discharge curves of LiFePO4/TiN and C-LiFePO4/TiN at a current density of 1.0 A g−1. The electrochemical capacitance was 314 F g−1 for LiFePO4/TiN and 972 F g−1 for C-LiFePO4/TiN, presenting a capacity improvement of 210%. These results indicate that C-LiFePO4/TiN had a higher conductivity and capacitance performance than LiFePO4/TiN. Equivalent series resistance (ESR), determined by the IR drop, is an important factor in evaluating the charge–discharge rate and the power density of the supercapacitor, which involves the resistance of the electrolyte solution, the intrinsic resistance of the electroactive material, the contact resistance of the interface electroactive material and the interface electroactive material/current collector.37 As shown in the Fig. 10(B), the value of the IR drop was 0.032 V for LiFePO4/TiN and 0.005 V for C-LiFePO4/TiN at the same current density of 1.0 A g−1. The quite low IR drop revealed very small ESR values for both electrode materials. Comparatively, the ESR of C-LiFePO4/TiN was also much smaller than that of LiFePO4/TiN. It means that conductive carbon played an important role in promoting electron transport between the electroactive material of LiFePO4 and the conductive substrate of TiN. The network structure of TiN nanowires shortened the ion diffusion path, facilitating the efficient access of electrolyte ions to the surface of electroactive material of C-LiFePO4. Accordingly, the C-LiFePO4/TiN had a better rate capability than LiFePO4/TiN.
 |
| | Fig. 10 (A) Cyclic voltammetry curves at a scan rate of 100 mV s−1 and (B) galvanostatic charge–discharge curves at a constant current density of 1.0 A g−1 for LiFePO4/TiN and C-LiFePO4/TiN. | |
Fig. 11(A and B) show the CV curves at different scan rates from 5 to 100 mV s−1 in a potential window of −1.0 to 0 V (vs. SCE). A near-rectangular shape of the curves indicated good capacitor behavior of the LiFePO4/TiN and C-LiFePO4/TiN nanowire network electrodes. The CV curves of LiFePO4/TiN and C-LiFePO4/TiN presented an almost symmetrical characteristic at zero current. The current response and the loop size of CV curves were usually related to the electrical conductivity and capacitance of the electrode materials, respectively. The current density of the C-LiFePO4/TiN was obviously larger than that of LiFePO4/TiN at the same scan rate and the same potential, implying a higher conductivity of the C-LiFePO4/TiN. The continuous increase of the scan rate led to further augmentation of the CV curves, indicating the rapid Li+ insertion–extraction reaction in C-LiFePO4/TiN.37 The shape of these CV curves did not significantly change as the scan rate increased from 5 to 100 mV s−1, revealing the ideal capacitive behaviors of the C-LiFePO4/TiN. It is believed that the lithium ion could well diffuse into the electroactive surface of the C-LiFePO4/TiN nanowire network, which accordingly conducted the Li+ insertion–extraction process. Thus, C-LiFePO4 exhibited good symmetrical and steady CV curves even at the high sweep rates.38
 |
| | Fig. 11 Cyclic voltammetry curves of (A) LiFePO4/TiN and (B) C-LiFePO4/TiN; galvanostatic charge–discharge curves of (C) LiFePO4/TiN and (D) C-LiFePO4/TiN; (E) capacitance curves of LiFePO4/TiN and C-LiFePO4/TiN. | |
Fig. 11(C and D) show the galvanostatic charge–discharge curves at different current densities. At current densities of 1, 2, 3, 5, 10 and 20 A g−1, the specific capacitance was determined to be 314, 262, 255, 225, 180, 140 F g−1 for LiFePO4/TiN and 972, 736, 679.8, 613.5, 545, 472.4 F g−1 for C-LiFePO4/TiN. Fig. 11(E) displays the electrochemical capacitance of LiFePO4/TiN and C-LiFePO4/TiN in dependence on the current density. At the same current density, the electrochemical capacitance of C-LiFePO4/TiN was obviously larger than that of LiFePO4/TiN. The capacitance of the C-LiFePO4/TiN decreased gradually with the increase of the current density. The C-LiFePO4/TiN exhibited capacitance decay in the initial stage, and then reached the stable level. The main contribution of the capacitance was ascribed to the reversible Faradaic process of LiFePO4, showing the higher specific capacitance at the lower current density. An additional contribution of the capacitance was related to the nanowire network structure and the conductive carbon, which increased the electrical conductivity and Li+ diffusion coefficient of LiFePO4.
The cycle life is an important factor in supercapacitor electrode materials. The continuous charge–discharge measurement was carried out to examine the cyclability of the C-LiFePO4/TiN nanowire network electrode. Fig. 12(A) shows the specific capacitance of C-LiFePO4/TiN electrode in terms of the cycle number at different current densities of 3, 5, 10, 15 A g−1. The corresponding stable capacitance was 580, 570, 475 and 457 F g−1 with a capacitance loss of 1.6%, 1.7%, 4.6%, and 4.1% after 45 charge–discharge cycles. The C-LiFePO4/TiN electrode kept the stable capacitance performance without obvious capacity decay in the initial cycles. Fig. 12(B) shows the variation of specific capacitance of LiFePO4/TiN and C-LiFePO4/TiN electrodes in terms of cycle times at a high current density of 20 A g−1. The capacitance loss was 9.5% for LiFePO4/TiN and 3.7% for C-LiFePO4/TiN after 400 charge–discharge cycles, presenting a slight decrease of the capacitance in the continuous charge–discharge process. Moreover, C-LiFePO4/TiN demonstrated the better electrochemical performance of specific capacitance and cycle stability than LiFePO4/TiN. It is believed that the conductive carbon and the nano-network structure of TiN substrate could improve the electrode/electrolyte impedance and favor the lithium-ion diffusion for C-LiFePO4/TiN. The high rate capability of conductive C-LiFePO4/TiN electrode also was beneficial for its high-power supercapacitor application. The excellent capacitance and rate-capability of the C-LiFePO4/TiN electrode was ascribed to its unique structural feature. Firstly, the TiN substrate with the highly electrical conductivity and nanoporous network structure promoted effective charge transport and electrolyte diffusion. Secondly, the conductive carbon was used as the good contact between the TiN current collector and the LiFePO4 nanoparticles. Much more electroactive material of LiFePO4 could contribute to the capacitance improvement. Last but not least, the open nanoporous network structure could favor abundant adsorption of lithium-ion and fast insertion–extraction of lithium-ion. Hence, the TiN–LiFePO4/C could act as a promising electrode material for lithium-ion supercapacitor.
 |
| | Fig. 12 (A) Cycle stability of the C-LiFePO4/TiN electrode at different current densities of 3, 5, 10, 15 A g−1; (B) long-term cycle stability of the LiFePO4/TiN and C-LiFePO4/TiN electrodes at high current density of 20 A g−1. | |
4. Conclusions
The C-LiFePO4/TiN with a nano-network structure was prepared by the facile hydrothermal synthesis, carbonization treatment and calcination treatment processes. TiN nanowires acted as the substrate and the current collector; the carbon acted as the electron transport channel between the LiFePO4 and the current collector and the LiFePO4 acted as the electroactive material. The C-LiFePO4/TiN exhibited a high capacitance of 972 F g−1 at the current density of 1.0 A g−1 and excellent cycle stability of 3.7% capacitance loss after 400 cycles at a high current density of 20 A g−1. The LiFePO4/TiN exhibited a capacitance of 314 F g−1 at the current density of 1 A g−1. The improved capacitance performance of LiFePO4 was ascribed to the carbon modification and the nano-network structure of TiN nanowires, which contributed to the improved conductivity and fast diffusion of electrolyte ions on the surface of the electrode. The C-LiFePO4/TiN nanowire network exhibited high capacitance, good cycle stability and high rate capability, presenting a promising application as the electrode material of lithium-ion supercapacitor.
Acknowledgements
The work was supported by National Natural Science Foundation of China (No. 21373047 and 20871029), the Program for New Century Excellent Talents in University of the State Ministry of Education (No. NCET-08-0119), and the Science & Technology Program of Suzhou City (No. ZXG2012026, SYN201208 and SYG201017).
Notes and references
- K. Tang, J. P. Sun, X. Q. Yu, H. Li and X. J. Huang, Electrochim. Acta, 2009, 54, 6565–6569 CrossRef CAS PubMed.
- J. J. Wang and X. L. Sun, Energy Environ. Sci., 2012, 5, 5163–5185 CAS.
- F. Croce, A. D'Epifanio, J. Hassoun, A. Deptula, T. Olczac and B. Scrosati, Electrochem. Solid-State Lett., 2002, 5, A47–A50 CrossRef CAS PubMed.
- K. S. Dhindsa, B. P. Mandal, K. Bazzi, M. W. Lin, M. Nazri, G. A. Nazri, V. M. Naik, V. K. Garg, A. C. Oliveira, P. Vaishnava, R. Naik and Z. X. Zhou, Solid State Ionics, 2013, 253, 94–100 CrossRef CAS PubMed.
- L. B. Song, X. H. Li, Z. X. Wang, H. J. Guo, Z. L. Xiao, F. Zhang and S. J. Peng, Electrochim. Acta, 2013, 90, 461–467 CrossRef CAS PubMed.
- Z. H. Li, D. M. Zhang and F. X. Yang, J. Mater. Sci., 2009, 44, 2435–2443 CrossRef CAS.
- G. X. Wang, L. Yang, Y. Chen, J. Z. Wang, S. Bewlay and H. K. Liu, Electrochim. Acta, 2005, 50, 4649–4654 CrossRef CAS PubMed.
- K. Hanai, T. Maruyama, N. Imanishi, A. Hirano, Y. Takeda and O. Yamamoto, J. Power Sources, 2008, 178, 789–794 CrossRef CAS PubMed.
- Y. S. Hu, Y. G. Guo, R. Dominko, M. Gaberscek, J. Jamnik and J. Maier, Adv. Mater., 2007, 19, 1963–1966 CrossRef CAS.
- L. J. Li, X. H. Li, Z. X. Wang, L. Wu, J. C. Zheng and H. J. Guo, J. Phys. Chem. Solids, 2009, 70, 238–242 CrossRef CAS PubMed.
- Y. R. Wang, Y. F. Yang, X. Hu, Y. B. Yang and H. X. Shao, J. Alloys Compd., 2009, 481, 590–594 CrossRef CAS PubMed.
- M. Konarova and I. Taniguchi, Mater. Res. Bull., 2008, 43, 3305–3317 CrossRef CAS PubMed.
- Y. Xie and Y. Zhao, Mater. Sci. Eng., C, 2013, 33, 5028–5035 CrossRef CAS PubMed.
- Y. Xie and Y. Meng, RSC Adv., 2014, 4, 41734–41743 RSC.
- Y. Xie, Y. Jin, Y. Zhou and Y. Wang, Appl. Surf. Sci., 2014, 133, 549–557 CrossRef PubMed.
- W. Wang, Y. Xie, C. Xia, H. Du and F. Tian, Microchim. Acta, 2014, 181, 1325–1331 CrossRef CAS.
- W. Wang, Y. Xie, Y. Wang, H. Du, C. Xia and F. Tian, Microchim. Acta, 2014, 181, 381–387 CrossRef CAS.
- Y. Xie and H. Du, J. Solid State Electrochem., 2012, 16, 2683–2689 CrossRef CAS PubMed.
- Y. Xie, D. Wang, Y. Zhou, H. Du and C. Xia, Synth. Met., 2014, 198, 59–66 CrossRef CAS PubMed.
- Y. Xie and X. Fang, Electrochim. Acta, 2014, 120, 273–283 CrossRef CAS PubMed.
- Y. Xie, Y. Wang and H. Du, Mater. Sci. Eng., B, 2013, 178, 1443–1451 CrossRef CAS PubMed.
- C. Xia, Y. Xie, Y. Wang, W. Wang, H. Du and F. Tian, J. Appl. Electrochem., 2013, 43, 1225–1233 CrossRef CAS.
- C. Xia, Y. Xie, W. Wang and H. Du, Synth. Met., 2014, 192, 93–100 CrossRef CAS PubMed.
- F. Tian, Y. Xie, H. Du, Y. Zhou, C. Xia and W. Wang, RSC Adv., 2014, 4, 41856–41863 RSC.
- H. Du, Y. Xie, C. Xia, W. Wang, F. Tian and Y. Zhou, Mater. Lett., 2014, 132, 417–420 CrossRef CAS PubMed.
- H. Du, Y. Xie, C. Xia, W. Wang and F. Tian, New J. Chem., 2014, 38, 1284–1293 RSC.
- C. W. Liu, J. An, R. S. Guo, Y. Li and L. Liu, J. Alloys Compd., 2013, 563, 33–38 CrossRef CAS PubMed.
- M. R. Yang, T. H. Teng and S. H. Wu, J. Power Sources, 2006, 159, 307–311 CrossRef CAS PubMed.
- Y. Q. Hu, M. M. Doeff, R. Kostecki and R. Finones, J. Electrochem. Soc., 2004, 151, A1279–A1285 CrossRef CAS PubMed.
- L. Wang, G. C. Liang, X. Q. Ou, X. K. Zhi, J. P. Zhang and J. Y. Cui, J. Power Sources, 2009, 189, 423–428 CrossRef CAS PubMed.
- S. H. Ju and Y. C. Kang, Mater. Chem. Phys., 2008, 107, 328–333 CrossRef CAS PubMed.
- J. F. Qian, M. Zhou, Y. L. Cao, X. P. Ai and H. X. Yang, J. Phys. Chem. C, 2010, 114, 3477–3482 CAS.
- C. M. Julien, K. Zaghib, A. Mauger, M. Massot, A. Ait-Salah, M. Selmane and F. Gendron, J. Appl. Phys., 2006, 100, 063511 CrossRef PubMed.
- Y. Jin, C. P. Yang, X. H. Rui, T. Cheng and C. H. Chen, J. Power Sources, 2011, 196, 5623–5630 CrossRef CAS PubMed.
- M. D. Levi and D. Aurbach, J. Electroanal. Chem., 1997, 421, 79–88 CrossRef CAS.
- S. M. Zhang, J. X. Zhang, S. J. Xu, X. J. Yuan and B. C. He, Electrochim. Acta, 2013, 88, 287–293 CrossRef CAS PubMed.
- Q. F. Wang, X. F. Wang, B. Liu, G. Yu, X. J. Hou, D. Chen and G. Z. Shen, J. Mater. Chem. A, 2013, 1, 2468–2473 CAS.
- K. X. Wang, Y. G. Wang, Y. R. Wang, E. Hosono and H. S. Zhou, J. Phys. Chem. C, 2009, 113, 1093–1097 CAS.
|
| This journal is © The Royal Society of Chemistry and the Centre National de la Recherche Scientifique 2015 |
Click here to see how this site uses Cookies. View our privacy policy here. 


 , where L and D are the effective diffusion length and diffusion coefficient, respectively. The total electrochemical impedance (Ztotal) of the equivalent circuit can be expressed as the formula (4).


