DOI:
10.1039/C4MT00244J
(Paper)
Metallomics, 2015,
7, 118-128
Endothelial responses of magnesium and other alloying elements in magnesium-based stent materials
Received
16th September 2014
, Accepted 17th October 2014
First published on 17th October 2014
Abstract
Biodegradable tailored magnesium (Mg) alloys are some of the most promising scaffolds for cardiovascular stents. During the course of degradation after implantation, all the alloying elements in the scaffold will be released to the surrounding vascular tissues. However, fundamental questions regarding the toxicity of alloying elements towards vascular cells, the maximum amount of each element that could be used in alloy design, or how each of the alloying elements affects vascular cellular activity and gene expression, are still not fully answered. This work systematically addressed these questions by revealing how application of different alloying elements commonly used in Mg stent materials influences several indices of human endothelial cell health, i.e., viability, proliferations, cytoskeletal reorganizations, migration, and the gene expression profile. The overall cell viability and proliferation showed a decreasing trend with increasing concentrations of the ions, and the half maximal effective concentrations (EC50) for each element were determined. When applied at a low concentration of around 10 mM, Mg had no adverse effects but improved cell proliferation and migration instead. Mg ions also altered endothelial gene expression significantly in a dose dependent manner. Most of the changed genes are related to angiogenesis and the cell adhesion signaling pathways. Findings from this work provide useful information on maximum safe doses of these ions for endothelial cells, endothelial responses towards these metal ions, and some guidance for future Mg stent design.
Introduction
There is increasing interest in the fabrication of biodegradable magnesium (Mg) alloys for cardiovascular stents because of their potential to eliminate late restenosis and thrombogenesis in current stent materials.1–8 Mg itself is considered biocompatible, and it plays an essential role in a lot of biological activities in the human body. However, the two major limitations of Mg are low corrosion resistance and insufficient mechanical strength. Alloying with other metal elements such as calcium (Ca), zinc (Zn), aluminum (Al), lithium (Li), zirconium (Zr), and rare earth elements (REEs) is an effective way to ameliorate such problems.9,10 For example, Mg–Zn, Mg–Zn–Ca, Mg–Al–Zn, and other Mg-REE alloys have been extensively investigated in the past decade.4,11–24 These alloys demonstrated a significant improvement in mechanical properties and corrosion resistance. In addition, the most noteworthy breakthrough in stent technology is the emerging of a bioresorbable drug-eluting magnesium-alloy scaffold (DREAMS) reported recently.25 The outcome from a clinical trial of this stent in the human body was very encouraging. All devices were successfully delivered in 46 patients with 47 lesions. After the implantation of stents, the patients were followed-up by angiographic and intravascular ultrasonography at 1, 6, 12, 24, and 36 months, respectively. Data showed that the lumen area restenosis rate was 43.38% at 6 months and 46.1% at 12 months. This study showed that Mg-based paclitaxel drug-eluting stents had the potential of success in clinical treatments.
Despite all the previous successes, one common and most challenging problem still exists in all the stents on the market – late restenosis. Mg scaffolds such as DREAMS have already improved the vascular compatibility significantly, but still had too much late lumen loss, not matching the clinical requirements in its current format.25 It is not because of the mechanical failure or too fast corrosion but mainly because of the vascular biocompatibility, the ultimate bottleneck in stent development. Reformation of a complete monolayer of endothelial cells without leakage (a.k.a., re-endothelialization) at the lesion site is the ultimate solution to such a problem.26–33 Re-endothelialization of the lesion requires the presence of healthy endothelial cells at the vicinity. Therefore, healthy endothelial responses from all the individual alloying elements, as well as from their mixture, are highly desirable.
The main alloying elements used for stent applications include Mg, Ca, Zn, Al, Li, strontium (Sr), Zr, and REEs, such as yttrium (Y), dysprosium (Dy), neodymium (Nd), and gadolinium (Gd). These Mg alloys displayed sufficient mechanical strength and corrosion resistance, but still could cause late restenosis which is mainly due to the lack of re-endothelialization at the lesion site. Optimizing the component ratio of alloying elements has the potential to minimize their toxic effect on endothelial health, thereby promoting the re-endothelialization process. However, it would be very hard to optimize the component ratio if the deleterious effects of each individual component, as well as the metal mixtures, on cells are unknown.
The performance of a stent material will be determined to a large extent by how it interacts with endothelial cells.34,35 The release of those alloying elements in the form of ions during the degradation process may induce toxic effects depending on the local concentration or on systemic accumulation. Moreover, available endothelial cytotoxicity data for all the individual elements are still sparse. A healthy population of endothelial cells is crucial for a complete re-endothelialization to take place. Therefore, it is essential to understand how each of these common alloying elements and various alloys affect endothelial cell activities, which is still largely missing in the literature. Thus, we studied the effects of different alloying elements commonly used in Mg stent materials (namely, Mg, Ca, Zn, Al, Y, Dy, Nd, and Gd) on human endothelial cell health, i.e., viability, proliferations, cytotoxicity, cytoskeletal reorganizations, migration, and gene expression profiles.
Experimental
Ion stock solution preparation
The chlorides of sodium (Na), Mg, Ca, Zn, Al, Y, Dy, Nd, and Gd (>99.99%, Sigma Aldrich, USA) were dissolved into deionized water at a concentration of 1 M (Na, Mg, Ca) and 0.01 M (the rest). The stock solutions were filtered using a double layer 0.8 μm filter (BD Biosciences, USA), and stored at 4 °C. Final ion solutions were made by mixing stock solution with endothelial culture medium (ECM, ScienCell, USA).
Cell culture
Human coronary aorta endothelial cells (HCAECs, ScienCell, USA) were expanded in ECM supplemented with 10% fetal bovine serum, 100 U ml−1 penicillin and 100 μg ml−1 streptomycin (ScienCell, USA) on fibronectin coated 75-flasks (BD Biosciences, USA) at 37 °C in a humidified incubator (Heracell 150i, Thermo Scientific, USA) with 5% CO2. Culture medium was changed every 2 days. Once 90% confluence reached, cells were treated with 5 ml 0.25% Trypsin-EDTA (Gibco, USA) for 3 min. After cells detached from the flask surface, 5 ml ECM was added and the solution was centrifuged at 500g for 5 min. The supernatant was removed and 1 ml ECM was used to suspend the cell pellet. Cells were counted using an automated cell counter (TC20, Bio-Rad, USA) and adjusted to final density. Primary cells at 3–5 passages were used in the following experiments with 3 biological replicates for each ion treatment.
Cell viability test
HCAECs were seeded in the 96-well cell culture plate (BD Biosciences, USA) with 5000 cells per well for 24 hours to allow cell attachment. ECM was replaced by ECM supplemented with different ion solutions and incubated for 24 hours. ECM with 10% DMSO (Life Technologies, USA) and ECM alone were positive and negative controls. Another blank reference containing the same concentration of ion solution without cells was used to exclude the interference of the ions. The 3-[4,5-dimethylthiazol-2-yl]-2,5-diphenyltetrezolium bromide (MTT, Invitrogen, USA) test was performed according to the manufacturer's protocol. Absorbance (A) was measured at 570 nm using a microplate reader (SpectraMax, Molecular Devices, USA). Cell viability was calculated by the following equation (except for the calcium group in which Ablank was not deducted):
| Viability = (Asample − Anegative − Ablank)/(Apositive − Anegative) |
Lactate dehydrogenase (LDH) release
HCAECs were seeded in a 96-well cell culture plate at 5000 cells per well and incubated for 24 h. Then ECM was replaced by ECM supplemented with different ion solutions. After 24 h of incubation, 100 μl culture media from each well were transferred to a new plate for the LDH (Roche Applied Science, USA) test. Absorbance was measured using a Microplate Reader (BioTek, USA) at 490 nm. Positive control and negative control were cell cultured with ECM supplemented with 2.5% dimethylsulfoxide (DMSO, Life Technologies, USA) and ECM, respectively. LDH release was calculated by the following equation:
| LDH = (Asample − Anegative)/(Apositive − Anegative) |
Cell proliferation test
A BrdU cell proliferation kit (Cell Signaling, USA) was used for the cell proliferation test. HCAECs were seeded in a 96-well cell culture plate at 5000 cells per well. After 24 hours, ECM was replaced by different ion solutions and incubated for 24 hours. The ion concentration was set up to the concentration at which cell viability was not significantly affected. The proliferation test was performed according to manufacturer's protocol. Absorbance was measured at 450 nm. Positive control and negative control were ECM without ion supplement and ECM without cells. The proliferation rate was calculated using the following equation:
| Proliferation = (Asample − Anegative)/(Apositive − Anegative) |
Cell migration
HCAECs were seeded in a 12-well cell culture plate (BD Biosciences, USA). A straight line in a cell monolayer was created by scratching the surface using a p200 pipette tip (Thermo Scientific, USA). Debris was removed by gently washing with Dulbecco's Phosphate Buffered Saline (DPBS, Invitrogen, USA) 3 times and cells were incubated with 3 ml ECM supplemented with different ion solutions. At 0, 6, and 24 hours, optical images were taken using a phase contrast microscope (Advanced Microscopy, USA). The width of the line at upper, middle and bottom positions was measured in Image-Pro Plus 6.0 (Media Cybernetics, USA). The recovery rate (RR) and recovery speed (RS) were calculated by following equations (n = 18):
| RR = (initial gap width − current gap width)/initial gap width |
Cytoskeleton staining
HCAECs were seeded in a 12-well cell culture plate and treated with ECM supplemented with different MgCl2 for 24 hours. An Image-iT Fix-Perm kit (Invitrogen, USA) was used to fix cells. Microfilament/F-actin was stained by Actin Green 488 Ready Probes Reagent (Invitrogen, USA). The cell nucleus was stained by the SlowFade Gold Anti-fade Reagent with DAPI (Invitrogen, USA). The microtubule was stained by mouse anti-β tubulin (Invitrogen, USA) followed by Alexa Fluor 546 rabbit anti-mouse IgG (Invitrogen, USA). Images were taken using an EVOS Inverted Fluorescent Microscope (Advanced Microscopy, USA). Fluorescent intensity of the cells was extracted by using ImageJ 1.49 software (NIH, USA). Contrast of the representative images was auto-adjusted using Image-Pro Plus 6.0.
Total RNA isolation
HCAECs were seeded in 100 mm culture dishes (BD Technologies, USA) and allowed to attach for 24 h. Then the cells were treated with ECM, ECM supplemented with 10 mM MgCl2, and ECM supplemented with 50 mM MgCl2, respectively, for 24 h. Cells were harvested and total RNA was extracted by using a RNeasy Mini Kit (Qiagen, USA) and subsequently quantified using a spectrophotometer (Nanodrop 2000, USA) with OD260/OD280 ratios between 1.9 and 2.1.
cDNA synthesis
A total of 600 ng RNA was used for reverse transcription using a RT2 First Strand Kit (Qiagen, USA). Reverse-transcription was performed in a thermo cycler (T100, Bio-Rad, USA). Then 91 μl RNase-free water was added to the 20 μl cDNA mix and stored at −20 °C in a freezer (Puffer Bubbard, Thermo Scientific, USA).
RT-PCR
HCAECs gene expression analysis was performed in a CFX96 Touch RT-PCR Detection System (Bio-Rad, USA) by using the RT2 Profiler PCR array (Qiagen, USA) for endothelial cells. The array includes 84 functional genes, 5 housekeeping genes, 3 reverse-transcription controls (RTC), and 3 positive PCR controls (PPC). 25 μl PCR components mix including cDNA, SYBR Green Mastermix and RNase-free water was dispensed to the RT2 Profiler PCR Array plate. After initial heat activation (95 °C, 10 min), cDNA was amplified as the following parameters: 95 °C for 15 s and 60 °C for 1 min. After the amplification, melting curve analysis was performed using the default melting curve program. Only the genes with one single melting peak were chosen for final analysis. Data was analyzed by Bio-Rad CFX Manager 3.1 (Biorad, USA). 2−ΔΔCt method was used to calculate gene fold changes.36
Statistical analysis
Data were presented as mean ± SD in all the figures. Statistical analysis was performed in Prisma 5.0 (GraphPad, USA) or SPSS 17.0 (SPSSInc, USA). For analysis of ion dose effects, a nonlinear fit for dose-response–inhibition in Prisma was used. An unpaired student's t-test was performed to compare the significance level of the treatment group with the control group. Multiple comparisons within one group were performed by using one-way ANOVA followed by post hoc analysis. The result is considered significantly different statistically if P < 0.05.
Results
Cell viability decreased with increasing ion concentrations
The normal metal ion concentrations in ECM as well as blood plasma were summarized in Table 1.37 The pH of the final ion solutions was measured using a pH meter (Eutech, USA) and no significant changes were observed. NaCl was used as a control to exclude the effect of chloride ions.
Table 1 Metal ion concentrations in ECM and blood plasma37
|
|
Ion concentration (mM) |
| Ions |
ECM |
Blood plasma |
| Na+ |
118.5 |
142.0 |
| K+ |
4.0 |
5.0 |
| Ca2+ |
1.6 |
2.5 |
| Mg2+ |
3.0 |
1.5 |
| Zn2+ |
0.000001 |
— |
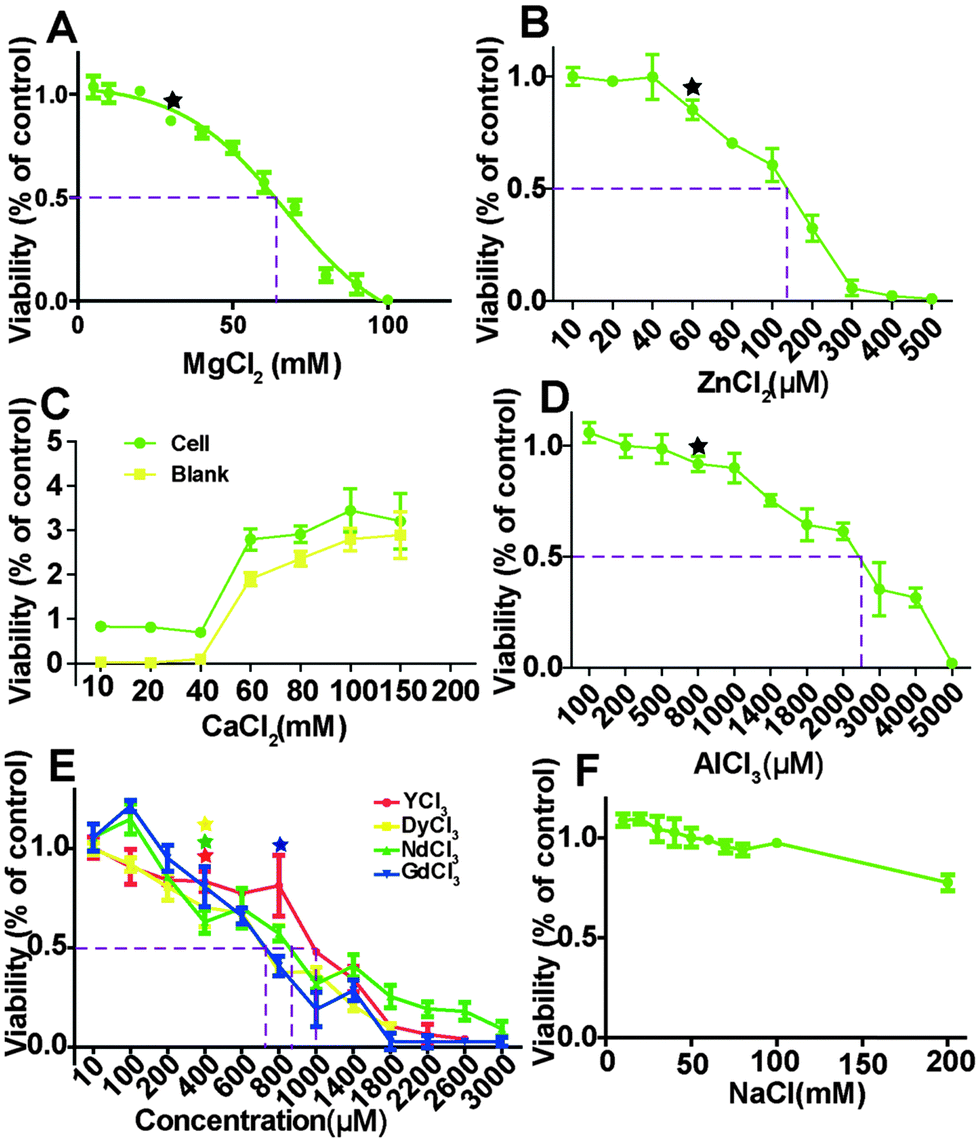
HCAECs were treated with different ion solutions for 24 hours and the relative MTT viability results are shown in Fig. 1. The overall cell viability decreased as ion concentrations increased except for the group treated with CaCl2. For the group of NaCl treatment, viability was not affected up to 100 mM and then decreased to 80.03 ± 0.2% at 200 mM (Fig. 1F). With the increase of Mg ion concentration from 8 mM to 103 mM, viability decreased from 105% to almost 0. The nonlinear fit (R2 = 0.97) for dose-response–inhibition showed that viability was not significantly affected when Mg2+ is less than 30 mM. The half maximal effective concentrations (EC50) for MgCl2, ZnCl2, and AlCl3 were about 66.7 mM, 130 μM and 2400 μM, respectively. The EC50 for the four REEs ranges from 710 to 990 μm. Moreover, when the CaCl2 concentration was higher than ∼60 mM, it could interfere with the MTT results (Fig. 1C).
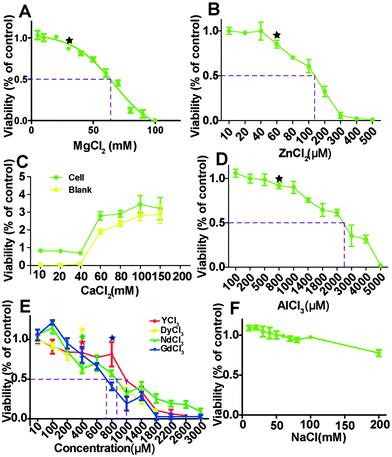 |
| | Fig. 1 MTT viability of HCAECs after treating with ECM supplemented with different metal chloride solutions for 24 h. The dashed lines indicated the half maximal effective concentration (EC50). Stars indicate that the cell viability was significantly decreased compared to control (n = 3, P < 0.05). | |
LDH release increased and then decreased with increasing ion concentrations
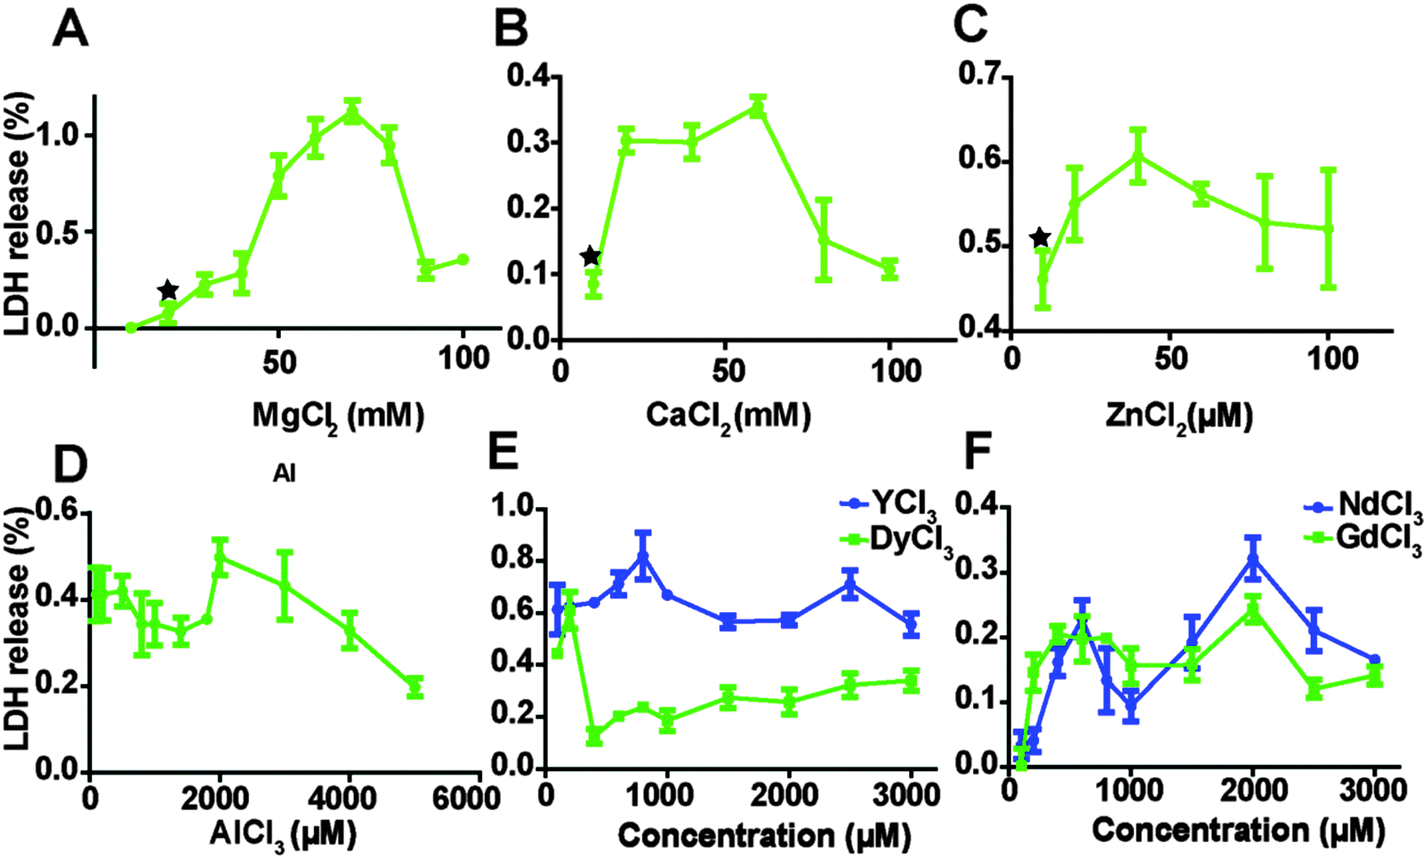
The relative amount of LDH released into cell culture media after endothelial cells were treated with MgCl2, CaCl2, ZnCl2 AlCl3 and REEs is shown in Fig. 2. As the concentration of MgCl2 increased from 10 mM to 70 mM, the relative quantity of released LDH increased from 0.6 ± 0.4% to 112.4 ± 5.6%, and then started to drop. The highest LDH release in the CaCl2 treated group was at the concentration of 60 mM. In the ZnCl2 treated group, LDH release showed the same tendency and the turning point was around 40 μM of ZnCl2. LDH release decreased first when concentrations of AlCl3 increased from 100 to 1800 μM, then it increased again and peaked at 2000 μM AlCl3 and then started to drop (Fig. 2D). In the REEs treated groups, the overall LDH release increased with increasing ion concentrations (Fig. 2E and F).
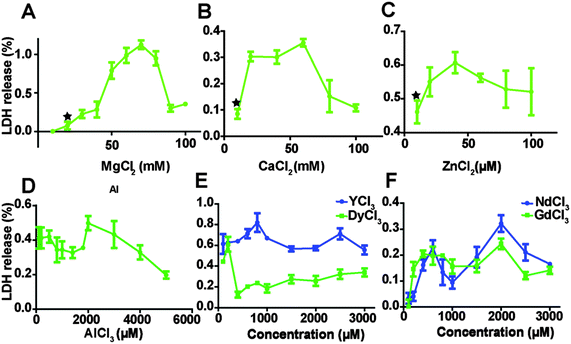 |
| | Fig. 2 LDH release from HCAECs after treating with ECM supplemented with the different ion solutions. Stars indicate that the LDH release was significantly increased compared to control (n = 3, P < 0.05). | |
Cell proliferation decreased with increasing ion concentrations
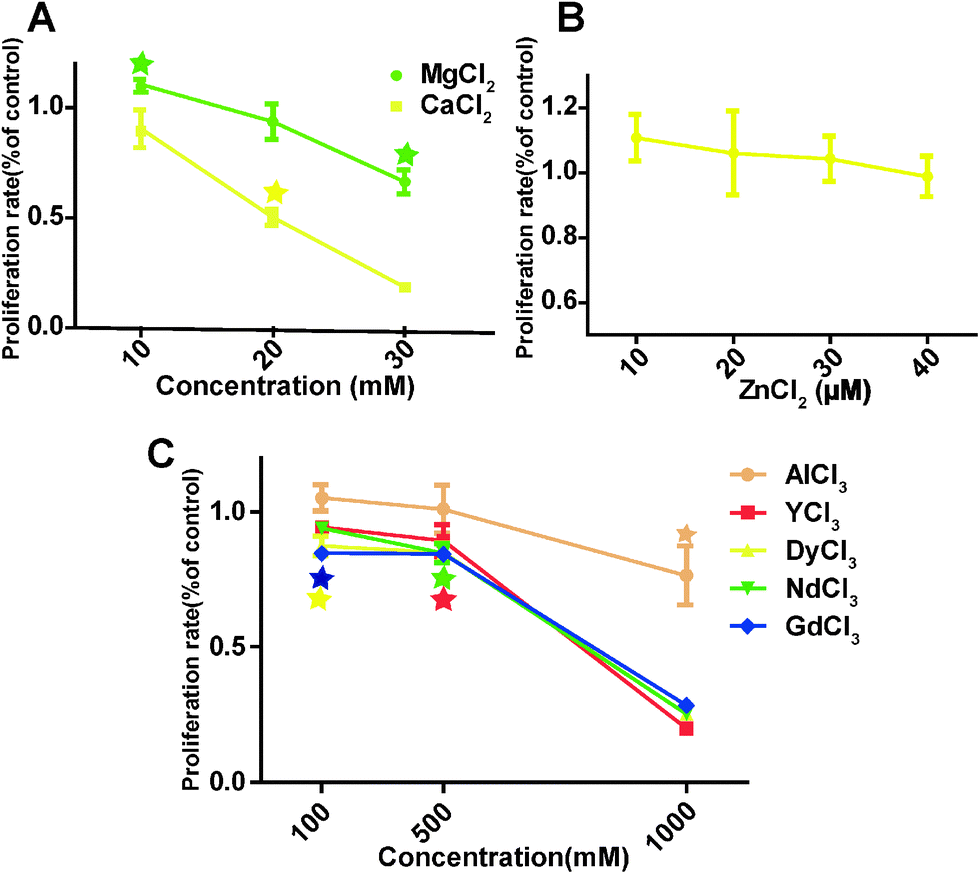
The overall HCAEC proliferation rate decreased as the concentrations of MgCl2 and CaCl2 increased (Fig. 3A). One interesting observation was that MgCl2 at 10 mM improved the proliferation rate to 114 ± 0.70%, significantly higher than the control group, while the proliferation rate of the 10 mM CaCl2 treated group was 90.5 ± 14.9% which is not significantly different from the control. The proliferation rate of cells treated with 10 μM ZnCl2 increased to 110.8 ± 12.5%, and then decreased slowly with the increase of ZnCl2 to 40 μM (Fig. 3B). For AlCl3, cell proliferation was significantly decreased at 1000 μM (Fig. 3C). REEs had much severe adverse effects on the cell proliferation compared with AlCl3. DyCl3 and GdCl3 significantly decreased the proliferation rate at 100 μM. In all REE treated HCAECs, cell proliferation declined gently with concentration upon increasing the concentration from 100 to 500 μM, and then decreased sharply from 500 to 1000 μM.
 |
| | Fig. 3 HCAECs proliferation rate measured by BrdU assay. Stars indicate that cell proliferation rates are significantly changed compared to control (n = 3, P < 0.05). | |
Mg ions at low concentrations enhanced cell migration
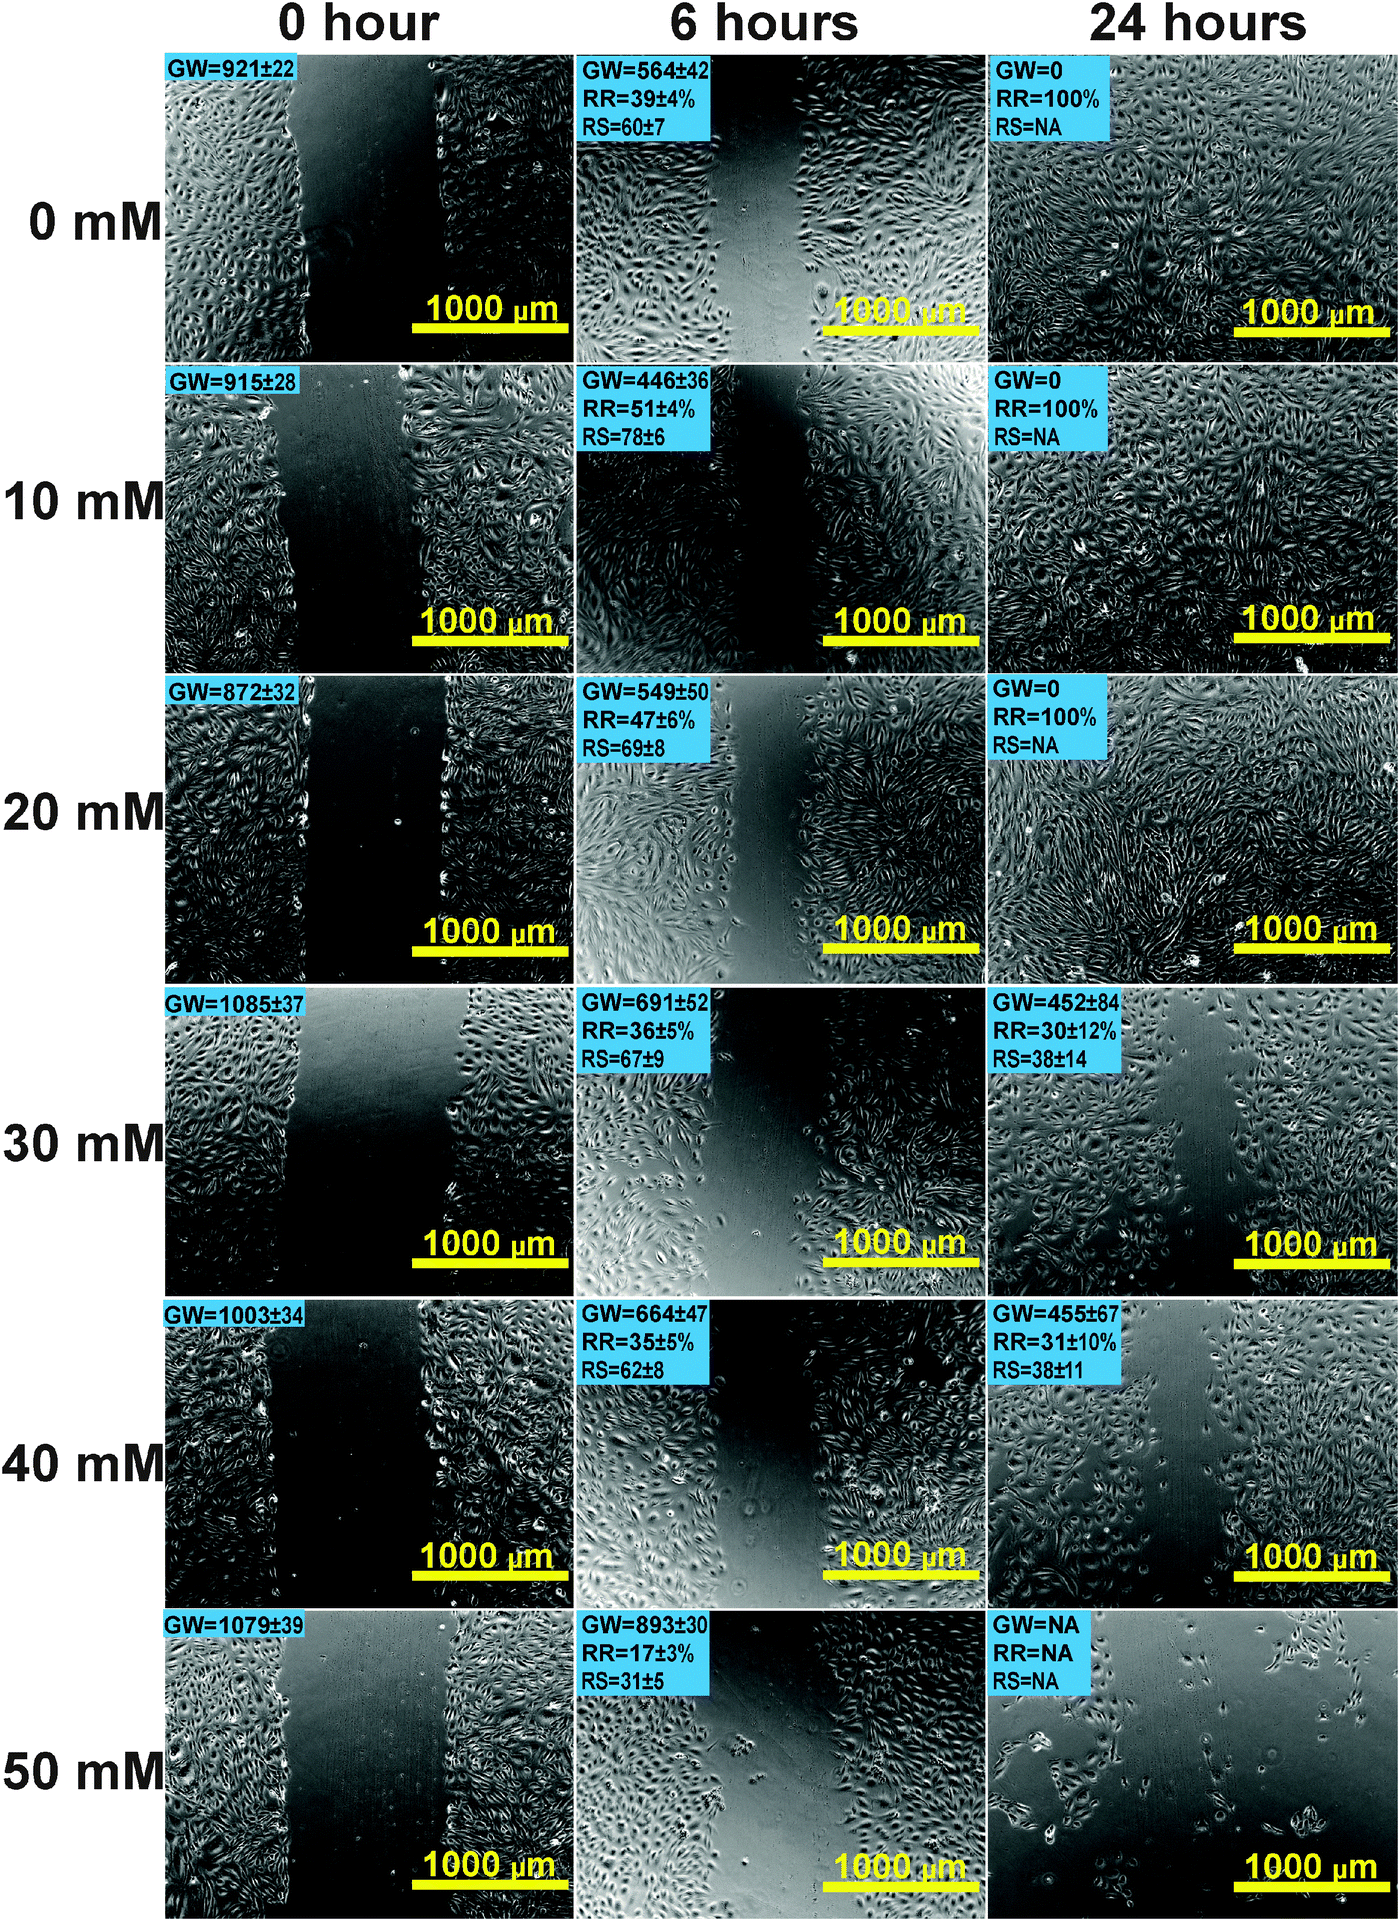
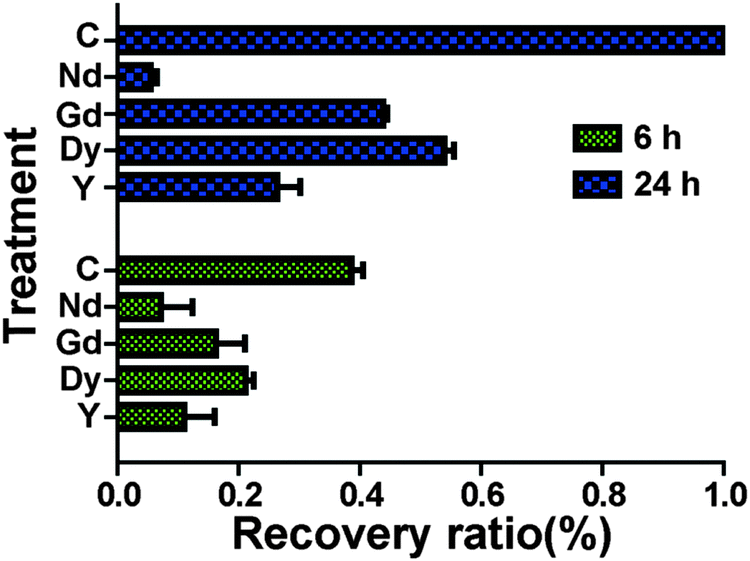
Scratch wound assay was used to test how MgCl2 and REEs affect cell migration and recovery. For the control group (Fig. 4), the recovery ratio (RR) was 39 ± 4% after 6 h and the wound completely healed after 24 h. For the group supplemented with 10 mM and 20 mM MgCl2, the simulated wound also completely healed after 24 h. The RSs and RRs were even significantly higher than those of the control group during the first 6 h. In the 30 mM and 40 mM groups, RR and RS were comparable to those of the control group at 6 h while they significantly decreased at 24 h. In the 50 mM group, not only the RR and RS significantly decreased at 6 h, but also a large amount of cells peeled off along the edge of the wound. The RR of cells treated with different REEs at 500 μM was shown in Fig. 5. All of the four REEs significantly decreased the cell RRs at 6 and 24 h. Nd showed the most deleterious effect among them.
 |
| | Fig. 4 Optical images of HCAECs migration at 0, 6 and 24 h by scratch wound assay. A straight line in a cell monolayer was created by scratching the surface with a p200 pipette tip. Cells were treated by ECM supplemented with gradient concentrations of MgCl2. The gap width (GW) of the line was calculated by Image Pro software. Recovery rate (RR) and recovery speed (RS) are shown on the top left corner of the image (n = 18, P < 0.05). | |
 |
| | Fig. 5 HCAECs recovery ratio after treating with individual REE (500 μM) for 24 h. All the groups were significantly different from each other except for NdCl3 and YCl3 at 6 h. C represents the control group treated with normal culture media (n = 18, P < 0.05). | |
Mg induced cytoskeletal reorganizations
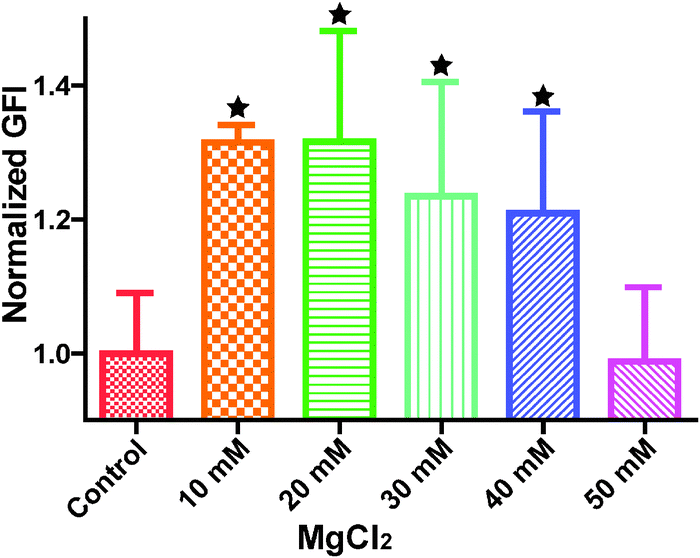
Cytoskeleton proteins, actin (green) and microtubule (red) structures are shown in Fig. 6. Cell morphology and the microtubule structure were not significantly affected with the ascending MgCl2 concentration. Some small green fluorescent dots were visible in all groups. Ventral stress fibers, which are actomyosin bundles connected to focal adhesions at both ends,38 were observed in all groups. At 10 mM and 20 mM MgCl2, an increased amount of thicker ventral stress fibers and nebulous fluorescence was displayed. Stress fibers were arranged along the edges of each cell and the microtubule network was surrounded by the actin stress fibers in the 30 mM group. There were some discontinuities within the intercellular cell-to-cell junctions as the MgCl2 concentration increased to 40 mM. The discontinuous areas got larger when MgCl2 increased to 50 mM. A few ventral stress fibers were visible and cells were fraught with nebulous green fluorescence in the case of the 50 mM group. Normalized actin fluorescent intensity per cell (Fig. 7) showed that total cellular actin significantly increased when supplement MgCl2 concentration was within 10 to 40 mM whereas actin quantity was not significantly different from that of the control group when MgCl2 increased to 50 mM.
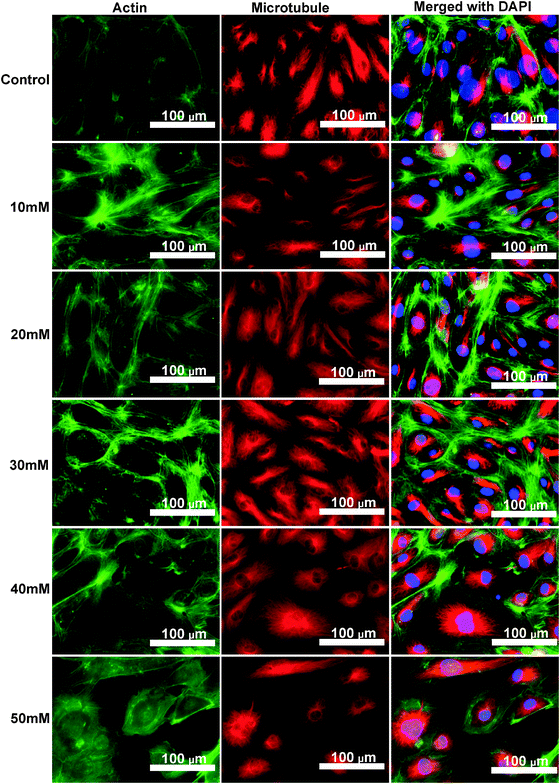 |
| | Fig. 6 Fluorescent images of HCAECs after treating with different concentrations of MgCl2 for 24 h. Cell nucleus (blue) was stained by Slow-fade Gold anti-fade Reagent with DAPI. Microtubule (red) was stained by mouse anti-β tubulin followed by Alexa Fluor 546 rabbit anti-mouse IgG. Microfilament (green) was stained by Actin Green 488 Ready Probes Reagent. | |
 |
| | Fig. 7 Normalized green fluorescence intensity (GFI) of HCAECs microfilament. Stars indicate that the GFIs were significantly different from the control (n = 12, P < 0.05). | |
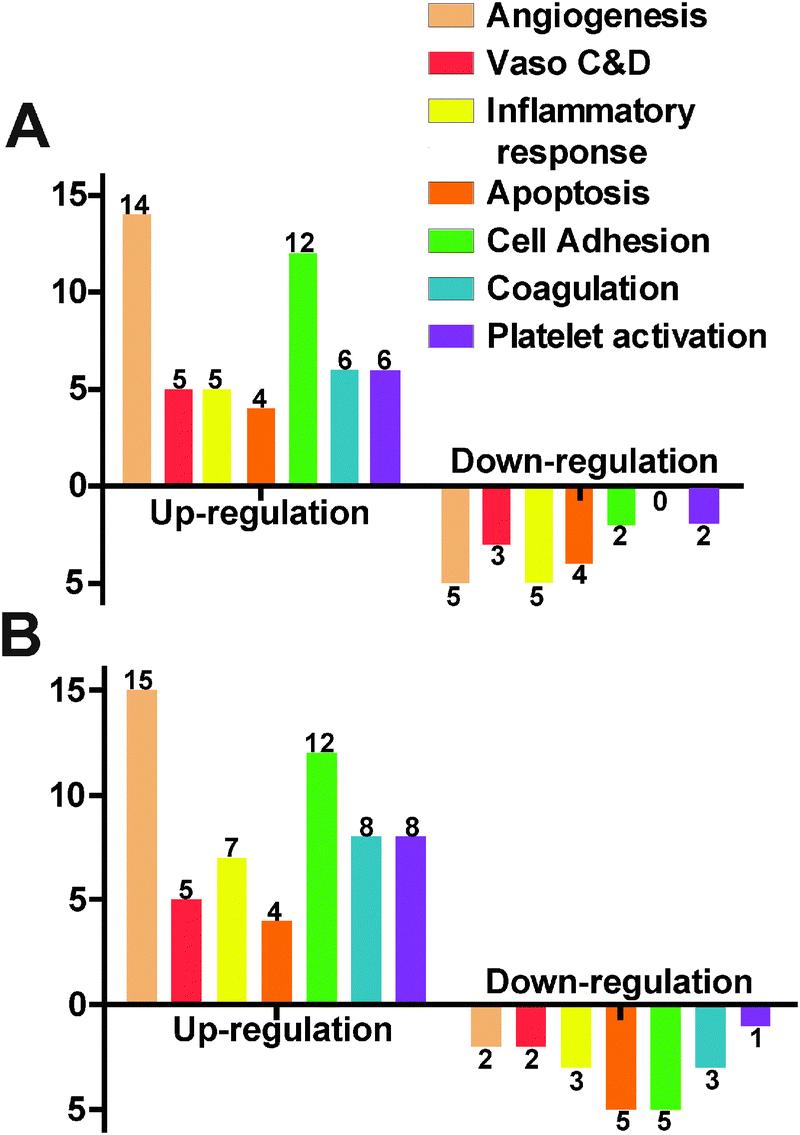
Mg induced significant alterations in the gene expression profile
We used a gene array for endothelial cells to examine the gene expression profile under the influence of Mg ions. In the 10 mM MgCl2 group, 12 genes were excluded due to the absence of the distinctive melting peak. Among the total of 72 detectable genes, 26 were up-regulated and 7 were down-regulated (Fig. 8A). The rest 39 didn't show significant change. Table 2 summarized some significantly changed genes under 10 mM of MgCl2 (n = 3, P < 0.01). The expression fold change of FGF1, FLT1, FN1, MMP1, NOS3, and PROCR was more than 2 times that of control. The majority of genes affected were related to angiogenesis and cell adhesion signaling pathways. As for the 50 mM MgCl2 group (Table 3), 31 genes were up-regulated and 9 genes were down-regulated. And 15 up-regulated genes are involved in the angiogenesis signaling pathway and 12 up-regulated genes are related to cell adhesion signaling pathway. AGTR1, ANXA5, CCL2, CCL5, FGF1, FN1, ITGAV, PLAT, and VCAM1 were up-regulated more than 2-fold higher than control. IL7, PF4, PTGIS, SELE, and SELL were down-regulated to less than 0.5-fold of control. Among them, FLT1, NOS3, MMP1 and PROCR were the most significantly affected genes (fold change > 2, P < 0.01) at 10 mM MgCl2 but interestingly, they did not show significant changes at 50 mM. FGF1 and FN1 were up-regulated at both concentrations.
 |
| | Fig. 8 HCAECs gene expression profile obtained by the RT-PCR profiling kit (including 84 functional genes) after treating with ECM supplemented with 10 mM MgCl2 (A) and 50 mM MgCl2 (B). Gene functions were classified into 7 different groups (Vaso C&D represents vasoconstriction & vasodilation). X-axis represents different gene functions and Y-axis represents the number of genes significantly changed. The bars above the X-axis are the up-regulated genes and below are the down-regulated genes (n = 3, P < 0.05). | |
Table 2 Gene expression changes of HCAECs (ECM supplemented with 10 mM MgCl2 with normal ECM as control)
| Gene |
Function |
Average fold changea |
|
Percentage of control, P < 0.01.
|
| ACE |
Angiogenesis |
1.978 |
| FGF1 |
Angiogenesis, cell adhesion |
2.415 |
| FLT1 |
Angiogenesis |
2.124 |
| FN1 |
Angiogenesis, inflammatory response, cell adhesion, coagulation, platelet activation |
2.383 |
| HMOX1 |
Angiogenesis, Vaso-C&D, inflammatory response, apoptosis |
1.799 |
| IL6 |
Angiogenesis, Vaso-C&D, inflammatory response, apoptosis |
0.624 |
| IL7 |
Apoptosis |
0.518 |
| ITGAV |
Cell adhesion |
1.762 |
| MMP1 |
Coagulation |
2.087 |
| NOS3 |
Angiogenesis, Vaso-C&D, platelet activation |
3.429 |
| PGF |
Angiogenesis |
1.337 |
| PROCR |
Coagulation |
2.264 |
| TIMP1 |
Coagulation, platelet activation |
1.779 |
| VEGFA |
Angiogenesis, cell adhesion, platelet activation |
1.360 |
Table 3 Gene expression changes of HCAECs (ECM supplemented with 50 mM MgCl2 with normal ECM as control)
| Gene |
Function |
Average fold changea |
|
Percentage of control, P < 0.01.
|
| AGTR1 |
Angiogenesis |
3.014 |
| ANXA5 |
Apoptosis, coagulation |
2.356 |
| CCL2 |
Angiogenesis |
4.290 |
| CCL5 |
Angiogenesis, inflammatory response, apoptosis |
8.413 |
| FGF1 |
Angiogenesis, cell adhesion |
3.486 |
| FN1 |
Angiogenesis, cell adhesion, inflammatory response, coagulation, platelet activation |
2.300 |
| IL7 |
Apoptosis |
0.403 |
| ITGAV |
Cell adhesion |
2.736 |
| PF4 |
Apoptosis, coagulation, platelet activation |
0.453 |
| PLAT |
Coagulation |
5.140 |
| PTGIS |
Vaso-C&D |
0.424 |
| SELE |
Inflammatory response, cell adhesion |
0.277 |
| SELL |
Cell adhesion, coagulation |
0.393 |
| TIMP1 |
Coagulation, platelet activation |
1.439 |
| VCAM1 |
Inflammatory response, cell adhesion |
3.436 |
Discussion
Endothelial cells form a semi-permeable endothelium monolayer which separates the blood components from the underneath tissues. It also plays an important role in immune response, coagulation, growth regulation, modulation of blood flow and production of the extracellular matrix.39 After the stent is deposited into the blood vessel, the surface of the stent will be in direct contact with the endothelial layer. In addition, re-endothelialization onto the inner layer of the stent is a very important step for the vascular reprogram. The interaction between the stent material and endothelial cells, therefore, is of great importance. Hence, we examined the responses of HCAECs after exposure to different individual alloying elements.
All alloying elements will be released from the material during the course of degradation. However, it is hard to mimic the real in situ concentrations of different ions for the in vivo scenarios. The concentration of degradation production could be much higher at the local microenvironment of the stent–endothelial interface than that in the blood stream or other tissues. Previous studies provided some information on the concentration of Mg ions after degradation of the alloys in vitro. For example, Mg2+ concentration in DMEM incubated with Mg–Ca alloy for 72 h was ∼57.96 mM40 and Mg2+ concentration in cell culture media after Mg–Nd–Zn–Zr alloy was co-cultured with human umbilical vein endothelial cells for 7 days was 9.53 mM.41 Therefore, we used a concentration range of 10–100 mM for Mg ions in our in vitro tests. Technically, the final Mg2+ concentration is the summation of 3 mM MgSO4 already existed in the ECM and additional supplemented MgCl2. Since Mg is the major component of the Mg-based alloy, the tested concentrations for other alloying elements Ca, Zn, Al and REEs were much lower.
MTT assay is frequently used to test how Mg-based alloys affect cell viability because of its convenience and reliability.5,12,42,43 MTT, a water soluble tetrazolium salt, is converted into soluble purple formazan by NAD(P)H dependent oxidoreducases within the metabolically active cells.44 The amount of formazan product can reflect the activity of those enzymes and cell viability. To rule out the potential interference from Cl− present in the solution, 10–200 mM NaCl solution was used and no significant effect on cell viability was observed up to 100 mM NaCl. Besides the direct effects of ions on cellular activities, pH and osmolality changes in the solution induced by the ions may also affect cells. We did not observe significant pH changes in all the final ion solutions we used. As for osmolality, similar results were observed except when MgCl2 concentration was higher than 66.7 mM. 66.7 mM MgCl2 solution has a similar osmolality to 100 mM NaCl. Therefore, both osmolality stress and Mg2+ ions may play a role in reduced cell viability when MgCl2 concentration is over 66.7 mM, the EC50 value in our case. Feyerabend et al. showed that the EC50 of MgCl2 on MG63 cells and human umbilical cord perivascular cells (HUCPCs) were 53 mM and 73 mM, respectively.45 The tolerance of HCAECs (EC50 of 66.7 mM) on MgCl2 is between that of MG63 cells and HUCPCs. The EC50 of ZnCl2 measured here for endothelial cells is ∼130 μM, comparable to that of the mouse macrophage cell line (∼203.89 μM).46 The slight differences between these measurements are probably because of different types of cells. The pH and Ca2+ may also interfere with MTT assay. Our test showed that the absorbance of the blank control without cells significantly increased when the Ca2+ concentration is higher than 60 mM. This false positive result is most likely caused by the aggregates of sodium dodecyl sulfate in solution with excess Ca2+.47 It is also mentioned by Fischer et al. that a highly alkaline environment may induce a false-positive result as well.40 Hence, the MTT test should be applied with caution in the situations where pH is highly alkaline or the alloy degradation products include Ca2+. The toxicity of REEs on cells is most likely caused by the displacement of Ca2+ ion from functional biomolecules as they have a similar radius as that of a Ca2+ ion.48 It was shown by Drynda et al. that REEs under 100 μg ml−1 (around 500 μM) did not lead to significant metabolic changes of smooth muscle cells.48 Feyerabend et al. also demonstrated that REEs under 1000 μM did not reduce human osteosarcoma cell line MG63 viability. All REEs ions had significant toxic effects on endothelial cell viability when their concentrations were higher than 400 μM, indicating that endothelial cells are more sensitive to REEs.
The effects of MgCl2, CaCl2, ZnCl2, AlCl3, and REEs on the HCAEC membrane were studied by LDH assay, which is also widely used to test the biocompatibility of Mg-based alloys.49–51 LDH, an indispensable cytoplasmic enzyme for all cells, is rapidly released to extracellular space upon damage of the plasma membrane. Han et al. reported that the decreased LDH level in cells treated by 20 μg ml−1 CuSO4 for 24 h is caused by LDH inactivation by Cu2+.52 Cells treated with MgCl2, CaCl2, ZnCl2 and AlCl3 all showed a decreased LDH tendency when the ion concentration is higher than certain thresholds. This may also be caused by the inactivation of LDH due to high ion concentration.
In comparison with LDH and MTT tests, BrdU is not dependent on direct enzymatic reaction so that the interference from Mg corrosion products is negligible. Based on this fact, some researchers believe that BrdU is a more appropriate test for cytotoxicity of Mg materials.53 It was also shown here that the cell proliferation rate by BrdU assay was more sensitive than the MTT test for some metal ions. For example, cell viability was not significantly affected at 30 mM MgCl2 (Fig. 1A) while the proliferation rate (Fig. 3) was significantly reduced to 62.67 ± 9.49%. Moreover, 20 mM CaCl2 demonstrated significant inhibition on the cell proliferation rate. This reduced proliferation is probably caused by ionic imbalance and production of reactive oxygen species (ROS). Ionic imbalance may lead to an altered signaling pathway related to the cell cycle, reduced enzymes activities and increased DNA replication errors. It is well known that metal corrosion products can induce ROS production.54,55 Extra ZnCl2 can induce serious mitochondrial dysfunction and remarkable intracellular ROS production.55 Depending on the level of ROS, it may increase the cell proliferation at a low level or cause damage to DNA and other biomacromolecules, leading to decreased proliferation or even cell apoptosis at a high level.56 Therefore, a higher cell proliferation rate (Fig. 3B) at the low ion concentration was likely caused by the lower amount of ROS induced by metal ions. With the increase of metal ion concentrations, the increasing ROS production caused the dampened proliferation. Also, Mg2+ is a cofactor for DNA polymerase and other important enzymes participating in DNA replication. A previous study reported by Maier et al. showed that 10 mM MgCl2 could stimulate endothelial proliferation,57 consistent with the BrdU proliferation result (114 ± 0.70%) here.
Endothelial cell migration is essential for both angiogenesis and endothelialization. As the re-endothelialization on the stent progresses, the chance of coagulant molecules or platelets attaching to the stent reduces. We used a scratch wound assay to study how Mg ions affect endothelial cell migration as it is a simple, cheap and very reliable method for the cell migration study.58–60 It is shown (Fig. 4) here that at 10 mM and 20 mM, MgCl2 increased the migration of endothelial cells within a few hours. This result is in line with a previous study by Banai et al. showing that 4 mM Mg2+ can stimulate capillary endothelial cell migration.61 This might be a very beneficial characteristic for Mg-based stent materials if the degradation product concentration is within this range. The exact mechanism responsible for this increased cell migration ability is not fully clear. One of the factors could be the fast assembling of the actin cytoskeleton into stress fibers, filopodia and lamellipodia.38 High Mg2+ concentration within a certain range may increase the intrinsic ATPase activity,58 which could boost the actin filament assembly during cellular filopodia and lamellipodia extension. Nitric oxide (NO) as an important cell migration and angiogenesis regulator may be another factor.62 In the 10 mM MgCl2 treated group, NO synthase III (NOS3) was up-regulated to 3.429 fold of control. Up-regulated NOS3 may lead to enhanced production of NO and further increase cell migration ability. In addition, ROS generated by NADPH oxidase may also play an important role in endothelial cell migration by stimulating some redox signaling pathways.58
However, a higher MgCl2 concentration of 50 mM not only decreased the endothelial cell migration rate but also led to the detachment of a large amount of cells along the edge of the scratched wound. This could be due to the weakened cell–cell junctions and cell–matrix adhesion. And it is supported by the fluorescent staining result (Fig. 6) where cell–cell connection was affected and some discontinuities between the cells could be observed when MgCl2 was above 40 mM. The changes in junction protein expression could be one of the reasons. Vascular endothelial cadherin, platelet endothelial cell adhesion molecule (PECAM), occludin, claudin, and endothelial cell selective adhesion molecule (ESAM) are the major transmembrane adhesive proteins at endothelial junctions.63 It was found that CDH5 (cadherin-5, type 2) was up-regulated to 1.56 ± 0.16 fold of control at 10 mM MgCl2 and 1.65 ± 0.05 fold of control at 50 mM (P < 0.05), respectively. Occludin and PECAM did not show significant change. Further investigation is needed to explain the detailed changes of cell-to-cell junctions and cell–matrix adhesion.
The gene expression profile is another important way to study how cells interact with biomedical materials. It could suggest the subtle cellular regulation changes when metabolic changes of cells are not detectable. MgCl2 at 10 mM and 50 mM had different effects on HCAEC gene expression in a concentration dependent manner. For example, the expression fold change of CCL2 and CCL5 were 4.290 and 8.413 (P < 0.01) respectively at 50 mM of MgCl2 indicating strong inflammatory chemokines regulation.64 Since Mg2+ is a ubiquitous cofactor for a lot of biomacromolecules, it plays a wide range of roles in the cell cycle and cell activities. Besides the direct effect of Mg2+ on enzymes, it is believed that increased Mg2+ could activate phosphorylation of some proteins followed by changes of cellular signaling pathways.65 The altered genes may have great potential to be used for a gene-eluting stent. For instance, if down-regulation of a certain gene causes the suppression of one cellular activity, it could compensate for such a negative effect induced by the biomaterial by delivery of the down-regulated gene through eluting. One example is the endothelial NOS gene (eNOS), and it was used in the gene-eluting stent.66 Results showed that this eNOS-eluting stent demonstrated better re-endothelialization and significant reduction in neointimal formation. Despite the fact that identifying the effective target genes and successfully delivering to the local tissue could be challenging, this is a very promising strategy for a new type of drug-eluting stent.
Nonetheless, the altered gene expression should not be interpreted as corresponding functional changes in the same way. More comprehensive studies on gene expression and protein expression are required to fully illustrate the underlying mechanisms. A Mg-alloy degradation product often is a complex mixture of all the alloying elements. There is no doubt that the effect of individual elements on endothelial cells is important. The combinative effect of the mixture of those alloying elements should be further studied in the future as well in order to better understand how the degradation products affect endothelial cell activity as a whole.
Conclusion
Biodegradable metals are promising candidates for cardiovascular and orthopedic applications. Mg-based stents are currently under clinical trials with encouraging outcomes. However, the biosafety and cellular responses of Mg and other alloying elements towards endothelial cells are still largely missing in the literature. The effects of commonly used elements in Mg stents on HCAECs were examined systematically for the first time, including cell viability, proliferation, and cytotoxicity. In addition, how Mg ions affect HCAECs cytoskeletal reorganization, migration and gene expression were also examined. All the tested elements showed an inhibitory effect on cell viability and proliferation in a dose-dependent manner. At low concentration, Mg2+ can not only stimulate the proliferation of HCAECs but also increase the migration rate of cells, potentially beneficial to re-endothelialization. More than 30 genes were significantly changed by Mg2+ and most of them are related to angiogenesis and cell adhesion signaling pathways. Findings from this study provide useful information on cell–metal interactions for novel Mg-based stents, and guidance for future Mg stent design.
Acknowledgements
We thank Ms D. Collins and Dr J. Waterman for experimental training, Mr W. F. Zhang for assistance on q-PCR experiment, and Ms L. M. Liu for assistance on data processing. This work was supported by National Institute of Health (SC2NS082475) and National Science Foundation Engineering Research Center-Revolutionizing Metallic Biomaterials (ERC-RMB) (NSF-0812348) at North Carolina A&T State University.
References
- L. Mao, G. Y. Yuan, J. L. Niu, Y. Zong and W. J. Ding, Mater. Sci. Eng., C, 2013, 33, 242–250 CrossRef CAS PubMed.
- Q. Ge, D. Dellasega, A. G. Demir and M. Vedani, Acta Biomater., 2013, 9.10, 8604–8610 CrossRef PubMed.
- J. Fan, X. Qiu, X. Niu, Z. Tian, W. Sun, X. Liu, Y. Li, W. Li and J. Meng, Mater. Sci. Eng., C, 2013, 33.4, 2345–2352 CrossRef PubMed.
- M. Bornapour, N. Muja, D. Shum-Tim, M. Cerruti and M. Pekguleryuz, Acta Biomater., 2013, 9, 5319–5330 CrossRef CAS PubMed.
- Z. Li, X. Gu, S. Lou and Y. Zheng, Biomaterials, 2008, 29, 1329–1344 CrossRef CAS PubMed.
- M. B. Kannan and R. Raman, Biomaterials, 2008, 29, 2306–2314 CrossRef CAS PubMed.
- F. Witte, J. Fischer, J. Nellesen, H.-A. Crostack, V. Kaese, A. Pisch, F. Beckmann and H. Windhagen, Biomaterials, 2006, 27, 1013–1018 CrossRef CAS PubMed.
- F. Witte, V. Kaese, H. Haferkamp, E. Switzer, A. Meyer-Lindenberg, C. Wirth and H. Windhagen, Biomaterials, 2005, 26, 3557–3563 CrossRef CAS PubMed.
- Z. Yang, J. Li, J. Zhang, G. Lorimer and J. Robson, Acta Metall. Sin. (Engl. Lett.), 2008, 21, 313–328 CrossRef CAS.
- D. Persaud-Sharma and A. McGoron, J. Biomimetics, Biomater., Tissue Eng., 2012, 12, 25–39 CrossRef PubMed.
- C. Liu, Y. Xin, G. Tang and P. K. Chu, Mater. Sci. Eng., A, 2007, 456, 350–357 CrossRef PubMed.
- X. Gu, Y. Zheng, Y. Cheng, S. Zhong and T. Xi, Biomaterials, 2009, 30, 484–498 CrossRef CAS PubMed.
- E. Zhang, D. Yin, L. Xu, L. Yang and K. Yang, Mater. Sci. Eng., C, 2009, 29, 987–993 CrossRef CAS PubMed.
- X. Gu, Y. Zheng, S. Zhong, T. Xi, J. Wang and W. Wang, Biomaterials, 2010, 31, 1093–1103 CrossRef CAS PubMed.
- A. C. Hanzi, I. Gerber, M. Schinhammer, J. F. Loffler and P. J. Uggowitzer, Acta Biomater., 2010, 6, 1824–1833 CrossRef CAS PubMed.
- T. Yan, L. Tan, D. Xiong, X. Liu, B. Zhang and K. Yang, Mater. Sci. Eng., C, 2010, 30, 740–748 CrossRef CAS PubMed.
- F. Seuss, S. Seuss, M. Turhan, B. Fabry and S. Virtanen, J. Biomed. Mater. Res., Part B, 2011, 99, 276–281 CrossRef CAS PubMed.
- S. Xu, K. Oh-Ishi, S. Kamado, F. Uchida, T. Homma and K. Hono, Scr. Mater., 2011, 65, 269–272 CrossRef CAS PubMed.
- S. Hou, R. Zhang, S. Guan, C. Ren, J. Gao, Q. Lu and X. Cui, Appl. Surf. Sci., 2012, 258, 3571–3577 CrossRef CAS PubMed.
- L. Mao, G. Yuan, S. Wang, J. Niu, G. Wu and W. Ding, Mater. Lett., 2012, 88, 1–4 CrossRef CAS PubMed.
- A. Srinivasan, P. Ranjani and N. Rajendran, Electrochim. Acta, 2012, 88, 310–321 CrossRef PubMed.
- C. Ye, Y. Zheng, S. Wang, T. Xi and Y. Li, Appl. Surf. Sci., 2012, 258, 3420–3427 CrossRef CAS PubMed.
- L. L. Han, Z. W. Mao, J. D. Wu, Y. Y. Zhang and C. Y. Gao, J. R. Soc., Interface, 2012, 9, 3455–3468 CrossRef CAS PubMed.
- W. R. Zhou, Y. F. Zheng, M. A. Leeflang and J. Zhou, Acta Biomater., 2013, 9.10, 8488–8498 CrossRef PubMed.
- M. Haude, R. Erbel, P. Erne, S. Verheye, H. Degen, D. Bose, P. Vermeersch, I. Wijnbergen, N. Weissman, F. Prati, R. Waksman and J. Koolen, Lancet, 2013, 381, 836–844 CrossRef CAS.
- I. Akin, H. Schneider, H. Ince, S. Kische, T. C. Rehders, T. Chatterjee and C. A. Nienaber, Herz, 2011, 36, 190–196 CrossRef CAS PubMed.
- S. Brugaletta, H. M. Garcia-Garcia, Y. Onuma and P. W. Serruys, Expert Rev. Med. Devices, 2012, 9, 327–338 CrossRef CAS PubMed.
- C. Di Mario, H. Griffiths, O. Goktekin, N. Peeters, J. Verbist, M. Bosiers, K. Deloose, B. Heublein, R. Rohde and V. Kasese, J. interv. cardiol., 2004, 17, 391–395 CrossRef PubMed.
- H. Hamid and J. Coltart, McGill journal of medicine: MJM: an international forum for the advancement of medical sciences by students, 2007, 10, 105–111 Search PubMed.
- G. Mani, M. D. Feldman, D. Patel and C. M. Agrawal, Biomaterials, 2007, 28, 1689–1710 CrossRef CAS PubMed.
- J. A. Ormiston and P. W. Serruys, Circ.: Cardiovasc. Interventions, 2009, 2, 255–260 CrossRef CAS PubMed.
- Y. H. Yun, Z. Y. Dong, N. Lee, Y. J. Liu, D. C. Xue, X. F. Guo, J. Kuhlmann, A. Doepke, H. B. Halsall, W. Heineman, S. Sundaramurthy, M. J. Schulz, Z. Z. Yin, V. Shanov, D. Hurd, P. Nagy, W. F. Li and C. Fox, Mater. Today, 2009, 12, 22–32 CrossRef CAS.
- Y. Zhang, C. Bourantas, V. Farooq, T. Muramatsu, R. Diletti, Y. Onuma, H. Garcia-Garcia and P. Serruys, Med. Devices: Evidence Res., 2013, 6, 37–48 CAS.
- N. Zhao, B. Workman and D. Zhu, Int. J. Mol. Sci., 2014, 15, 5263–5276 CrossRef CAS PubMed.
- M. Li, Y. Cheng, Y. Zheng, X. Zhang, T. Xi and S. Wei, Appl. Surf. Sci., 2012, 258, 3074–3081 CrossRef CAS PubMed.
- K. J. Livak and T. D. Schmittgen, Methods, 2001, 25, 402–408 CrossRef CAS PubMed.
- M. E. Iskandar, A. Aslani and H. Liu, J. Biomed. Mater. Res., Part A, 2013, 101, 2340–2354 CrossRef PubMed.
- S. Tojkander, G. Gateva and P. Lappalainen, J. Cell Sci., 2012, 125, 1855–1864 CrossRef CAS PubMed.
- B. E. Sumpio, J. Timothy Riley and A. Dardik, Int. J. Biochem. Cell Biol., 2002, 34, 1508–1512 CrossRef CAS.
- J. Fischer, D. Pröfrock, N. Hort, R. Willumeit and F. Feyerabend, Mater. Sci. Eng., B, 2011, 176, 1773–1777 CrossRef CAS PubMed.
- J. Zhang, N. Kong, Y. Shi, J. Niu, L. Mao, H. Li, M. Xiong and G. Yuan, Corros. Sci., 2014, 85, 477–481 CrossRef CAS PubMed.
- X. Lin, L. Tan, Q. Zhang, K. Yang, Z. Hu, J. Qiu and Y. Cai, Acta Biomater., 2013, 9, 8631–8642 CrossRef CAS PubMed.
- Y. Zhao, M. I. Jamesh, W. K. Li, G. Wu, C. Wang, Y. Zheng, K. W. Yeung and P. K. Chu, Acta Biomater., 2014, 10, 544–556 CrossRef CAS PubMed.
- M. V. Berridge, P. M. Herst and A. S. Tan, Biotechnol. Annu. Rev., 2005, 11, 127–152 CAS.
- F. Feyerabend, J. Fischer, J. Holtz, F. Witte, R. Willumeit, H. Drücker, C. Vogt and N. Hort, Acta Biomater., 2010, 6, 1834–1842 CrossRef CAS PubMed.
- W. Song, J. Zhang, J. Guo, J. Zhang, F. Ding, L. Li and Z. Sun, Toxicol. Lett., 2010, 199, 389–397 CrossRef CAS PubMed.
- M. Sammalkorpi, M. Karttunen and M. Haataja, J. Phys. Chem. B, 2009, 113, 5863–5870 CrossRef CAS PubMed.
- A. Drynda, N. Deinet, N. Braun and M. Peuster, J. Biomed. Mater. Res., Part A, 2009, 91, 360–369 CrossRef PubMed.
- R. M. Lozano, B. T. Pérez-Maceda, M. Carboneras, E. Onofre-Bustamante, M. C. García-Alonso and M. L. Escudero, J. Biomed. Mater. Res., Part A, 2013, 101, 2753–2762 CrossRef PubMed.
- H. S. Brar, J. P. Ball, I. S. Berglund, J. B. Allen and M. V. Manuel, Acta Biomater., 2013, 9, 5331–5340 CrossRef CAS PubMed.
- I. S. Berglund, H. S. Brar, N. Dolgova, A. P. Acharya, B. G. Keselowsky, M. Sarntinoranont and M. V. Manuel, J. Biomed. Mater. Res., Part B, 2012, 100, 1524–1534 CrossRef PubMed.
- X. Han, R. Gelein, N. Corson, P. Wade-Mercer, J. Jiang, P. Biswas, J. N. Finkelstein, A. Elder and G. Oberdörster, Toxicology, 2011, 287, 99–104 CrossRef CAS PubMed.
- J. Fischer, M. H. Prosenc, M. Wolff, N. Hort, R. Willumeit and F. Feyerabend, Acta Biomater., 2010, 6, 1813–1823 CrossRef CAS PubMed.
- R. Tsaryk, K. Peters, S. Barth, R. E. Unger, D. Scharnweber and C. J. Kirkpatrick, Biomaterials, 2013, 34, 8075–8085 CrossRef CAS PubMed.
- M. Horie, K. Fujita, H. Kato, S. Endoh, K. Nishio, L. K. Komaba, A. Nakamura, A. Miyauchi, S. Kinugasa and Y. Hagihara, Metallomics, 2012, 4, 350–360 RSC.
- R. A. Cairns, I. S. Harris and T. W. Mak, Nat. Rev. Cancer, 2011, 11, 85–95 CrossRef CAS PubMed.
- J. A. Maier, D. Bernardini, Y. Rayssiguier and A. Mazur, Biochim. Biophys. Acta, Mol. Basis Dis., 2004, 1689, 6–12 CrossRef CAS PubMed.
- L. Lamalice, F. Le Boeuf and J. Huot, Circ. Res., 2007, 100, 782–794 CrossRef CAS PubMed.
- A.-L. Pin, F. Houle, P. Fournier, M. Guillonneau, É. R. Paquet, M. J. Simard, I. Royal and J. Huot, J. Biol. Chem., 2012, 287, 30541–30551 CrossRef CAS PubMed.
- R. A. Alexander, G. W. Prager, J. Mihaly-Bison, P. Uhrin, S. Sunzenauer, B. R. Binder, G. J. Schütz, M. Freissmuth and J. M. Breuss, Cardiovasc. Res., 2012, 94, 125–135 CrossRef CAS PubMed.
- S. Banai, L. Haggroth, S. E. Epstein and W. Casscells, Circ. Res., 1990, 67, 645–650 CrossRef CAS.
- S. Dimmeler, E. Dernbach and A. M. Zeiher, FEBS Lett., 2000, 477, 258–262 CrossRef CAS.
- E. Dejana, Nat. Rev. Mol. Cell Biol., 2004, 5, 261–270 CrossRef CAS PubMed.
- G. Soria and A. Ben-Baruch, Cancer Lett., 2008, 267, 271–285 CrossRef CAS PubMed.
- H. Rubin, Magnesium Res., 2005, 18, 268–274 CAS.
- F. Sharif, S. O. Hynes, R. Cooney, L. Howard, J. McMahon, K. Daly, J. Crowley, F. Barry and T. O'Brien, Mol. Ther., 2008, 16, 1674–1680 CrossRef CAS PubMed.
|
| This journal is © The Royal Society of Chemistry 2015 |
Click here to see how this site uses Cookies. View our privacy policy here.