DOI:
10.1039/C4MB00381K
(Paper)
Mol. BioSyst., 2015,
11, 252-261
Heparin makes differences: a molecular dynamics simulation study on the human βII-tryptase monomer†
Received
28th June 2014
, Accepted 15th October 2014
First published on 15th October 2014
Abstract
Human β-tryptase, an enzyme with trypsin-like activity in mast cells, is an important target for the treatment of inflammatory and allergy related diseases. Heparin has been inferred to play a vital role in the stabilization of the tryptase structure and the maintenance of its active form. Up to now, the structure–function relationship between heparin and the βII-tryptase monomer has not been studied with atomic resolution due to the lack of a complex structure of tryptase and heparin. To this end, the exact effect of heparin bonding to the βII-tryptase monomer structure has been investigated using molecular docking and molecular dynamics (MD) simulation. The MD simulation results combined with MM-GB/SA calculations showed that heparin stabilized the β-tryptase structure mainly through salt bridge interaction. The averaged noncovalent interaction (aNCI) method was employed for the visualization of nonbonding interactions. A crucial loop, which is located in the core region of βII-tryptase monomer structure, has been found. Arg188 and Asp189 from this loop act as a salt bridge intermediary between 4-mer heparin and 0GX. The observation of a salt bridge between Asp189 and P1 groups of 0GX confirms the supposed interaction between these two groups. These two residues have been proved to be responsible for the direction of the P1 group of 0GX. Our study revealed that how heparin affected the activity of the human βII-tryptase monomer (hBTM) through salt bridge interactions. The knowledge of heparin binding characteristics and the key residue contributions in this study may enlighten further the inhibitor design of this enzyme and may also improve our understanding of inflammatory and allergy related diseases.
Introduction
In 1963, the phase ‘tryptase’ was introduced1 to illustrate trypsin-like activity for the first time which was detected in mast cells.2 Based on biochemical, immunological and structural properties, human tryptase can be subdivided into four isoforms, namely α, β, γ and δ. Among these four isoforms, β-tryptase is the main form of tryptase stored in mast cell granules and is not normally released into the circulation.3 Human β-tryptase is reported to have a strong correlation with inflammatory and allergic disorders, especially asthma and chronic obstructive pulmonary disease (COPD).4–7 To date, three identical β-tryptases have been identified: βI, βII and βIII. In 1998, the crystal structure of human βII-tryptase was solved for the first time, which revealed a tetramer structure where the monomer units were positioned at the corners of a flat rectangular frame.8 The active site of each monomer faced a continuous pore in the middle of the tetramer. This special topology of the tetramer explains its resistance to biological inhibitors, including α1-antitrypsin, antithrombin III (ATIII), α2-macroglobulin (α2M), bovine aprotinin and plant-derived inhibitors such as the soybean trypsin inhibitor (SBTI) and the lima bean trypsin inhibitor (LBTI).9
Since pursued as a therapeutic target for many years,10 β-tryptase has attracted widespread interest due to its vital role in allergic and inflammatory actions. Three classes of small organic inhibitors for β-tryptase have been reported.11–15 The first class contains a reactive functional group that can form a covalent bond with catalytic serine in the active pocket. The second class contains a basic P1 group. The basic P1 group can be a benzylamine or benzamidine. These basic P1 groups play an important role in the β-tryptase binding. This group interacts with Asp189 of β-tryptase mainly through nonbonding interactions. The Asp189 locates at the bottom of the binding pocket. The designation of tryptase relates to its strong preference for cleaving substrates at the C-terminal side of positive Arg and Lys residues. Through electrostatic interaction between Asp189 and Arg or Lys, Asp189 helps to direct the substrates and facilitates the cleaving reactions. The 0GX contains a positive P1 group. It was suggested that the P1 group can form a salt bridge with the aspartic acid residue at 189 in β-tryptase.16,17 By this kind of interaction, the P1 group binds to the active pocket of tryptase where it intends to bind substrates. Thus, the enzyme's activity is inhibited. The second class of tryptase inhibitor accessed the active pocket easier than substrates. That is how the second class inhibitor inhibits the activity of tryptases. The second class of inhibitors is the most popular in number and is available for almost all the β-tryptase. The third class of inhibitors contains a non-basic P1 group that does not have a direct nonbinding interaction with Asp189.
For a long time, the active tryptase was exclusively tetrameric. Recently, several experimental studies18–21 have suggested that tryptase could also exist as an active monomer with properties that were clearly distinct from those of the tetrameric counterpart. Ignacio Fajardo and Gunnar Pejler reported that the formation of active monomers was promoted at neutral pH and was also strongly favored by body temperature and low concentrations of heparin.21 Heparin is a kind of oligosaccharide. This negatively charged molecule can stabilize active form of β-tryptase upon cell activation.3 Heparin binding to hBTM may induce conformational changes and affect the activity of this enzyme. However, the exact mechanism by which heparin actives the monomer is still not clear.18 Besides, the heparin–tryptase complex structure is difficult to obtain. All the tryptase crystal structures from Protein Data Bank were without heparin. The lack of a complex of heparin and human βII-tryptase hinders the understanding of the heparin activation pathway.
Despite the experiments on human β-tryptase proteins, the molecular origin and the structural motif to explain heparin's indispensable role have not been studied at the atomic-level. To this end, we have investigated the atomic-level structural characterization of hBTM both with and without heparin. Molecular docking has been proven to be a useful tool to get complexes of protein and small molecules especially when these complexes are difficult to obtain through experimental strategies.22–24 Molecular dynamics (MD) simulations can be used as an effective way to study the conformational changes on the atomic level.23,25,26 In the current study, molecular docking was used to obtain a heparin–βII-tryptase monomer complex. MD simulations for the βII-tryptase monomer structures both with and without heparin were carried out. The aims of the work are to figure out how heparin stabilizes hBTM. We try to figure out how heparin affects the inhibition of hBTM. Our work provides detailed atomistic insights into the structure–function relationships of the βII-tryptase monomer and heparin and may also improve the designing of new inhibitors of βII-tryptase.
Computational method
Initial structures
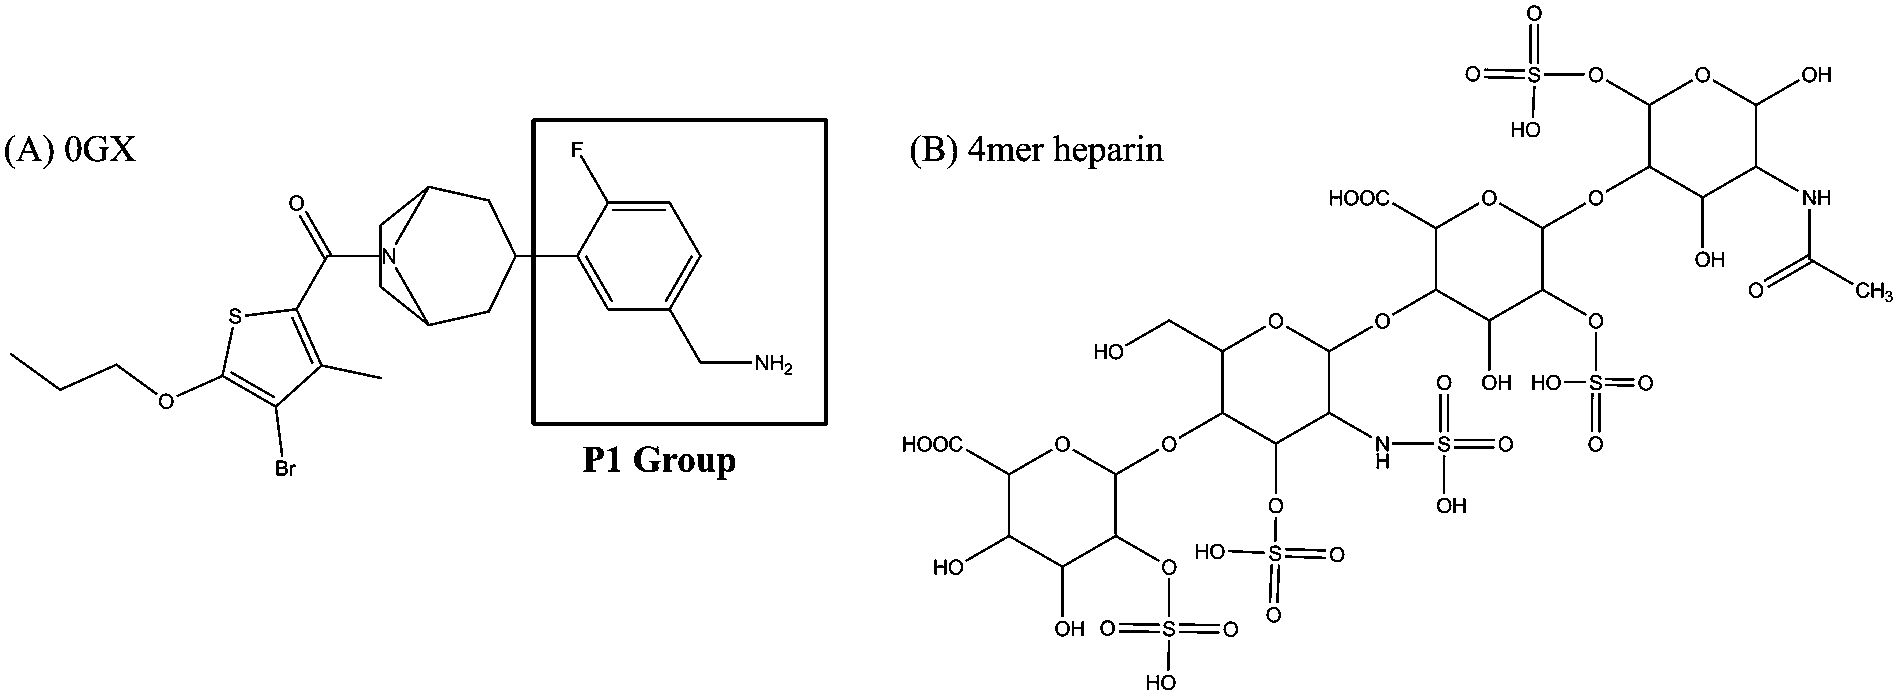
The crystal structure of human βII-tryptase complex with its inhibitor 0GX was retrieved from the RCSB Brookhaven Protein Data Bank (PDB entry: 3V7T),10 which was served as the starting structure for the following docking calculations. The chemical structure of inhibitor 0GX is shown in Fig. 1A, which contains a basic P1 group. The crystal structure complex with inhibitor 0GX was obtained under a rather high salt concentration. This high salt concentration was used to compensate for the absence of heparin. In order to simulate the human βII tryptase monomer (hBTM for short) in its real condition, the substrate-free form of hBTM was created. That is, only chain A (243 residues) without inhibitor 0GX was retained. Discovery Studio 2.527 software package was used to refine and repair the monomer structure. Ignacio Fajardo and Gunnar Pejler reported that the formation of active monomers of human β-tryptase was promoted at neutral pH.21 The protonation states of ionizable residues were determined at pH = 7.0 using H++ server,28 which can predict the pKa value of protein residues at a given pH. Based on the calculated pKa values, His59, His178 and His253 were assigned to be fully protonated at both nitrogens. The rest of the histidines were protonated at ε nitrogen.
 |
| | Fig. 1 The chemical structures of small molecules used in this study. (A) The 0GX inhibitor; (B) the 4-mer heparin. | |
There are two main aspects that heparin can affect tryptase's structure.3 For one thing, long chains of heparin (about 20 unit monosaccharides) are responsible for cross-linking an individual tryptase monomer. For the other, the highly charged nature of heparin can bring a lot of electrostatic interactions into the tryptase system. In 2006, Jenny Hallgren reported that heparin of octasaccharide size (8-mer unit heparin) were the smallest size capable of binding to tryptase.3 The tetrameric tryptase is a homotetramer. Thus, 4-mer heparin was used in this study in order to investigate how this negatively charged molecule affects the structure of the βII-tryptase monomer. The substrate-free form of hBTM was refined by a short time period molecular dynamic (MD) simulation. The refined substrate-free form of hBTM structure was served as the starting point of following docking calculations.
The initial coordinate of 4-mer heparin was obtained from Drug Bank (http://www.drugband.ca) with accession number DB1109. The initial structure of inhibitor 0GX was extracted from 3VT7. The chemical structure of 4-mer heparin and 0GX are shown in Fig. 1. The five sulfo groups of 4-mer heparin are assumed to be in their deprotonation state. By means of the B3LYP29,30 density functional method using the Gaussian0931 package of program, geometry optimizations for 4-mer heparin and 0GX molecules were performed using the 6-31G(d) basis set. The refined structures will be used in the following docking study.
Molecular docking
In vivo, the hBTM must first bind with heparin to stabilize its monomer structure and subsequently inhibitor 0GX can bind with the hBTM–heparin complex. In order to simulate the hBTM in its real condition, docking calculations were performed as follows: based on the substrate-free form of hBTM, the 4-mer heparin molecule was first docked into the hBTM. Then inhibitor 0GX was docked into the active pocket of the hBTM–heparin complex.
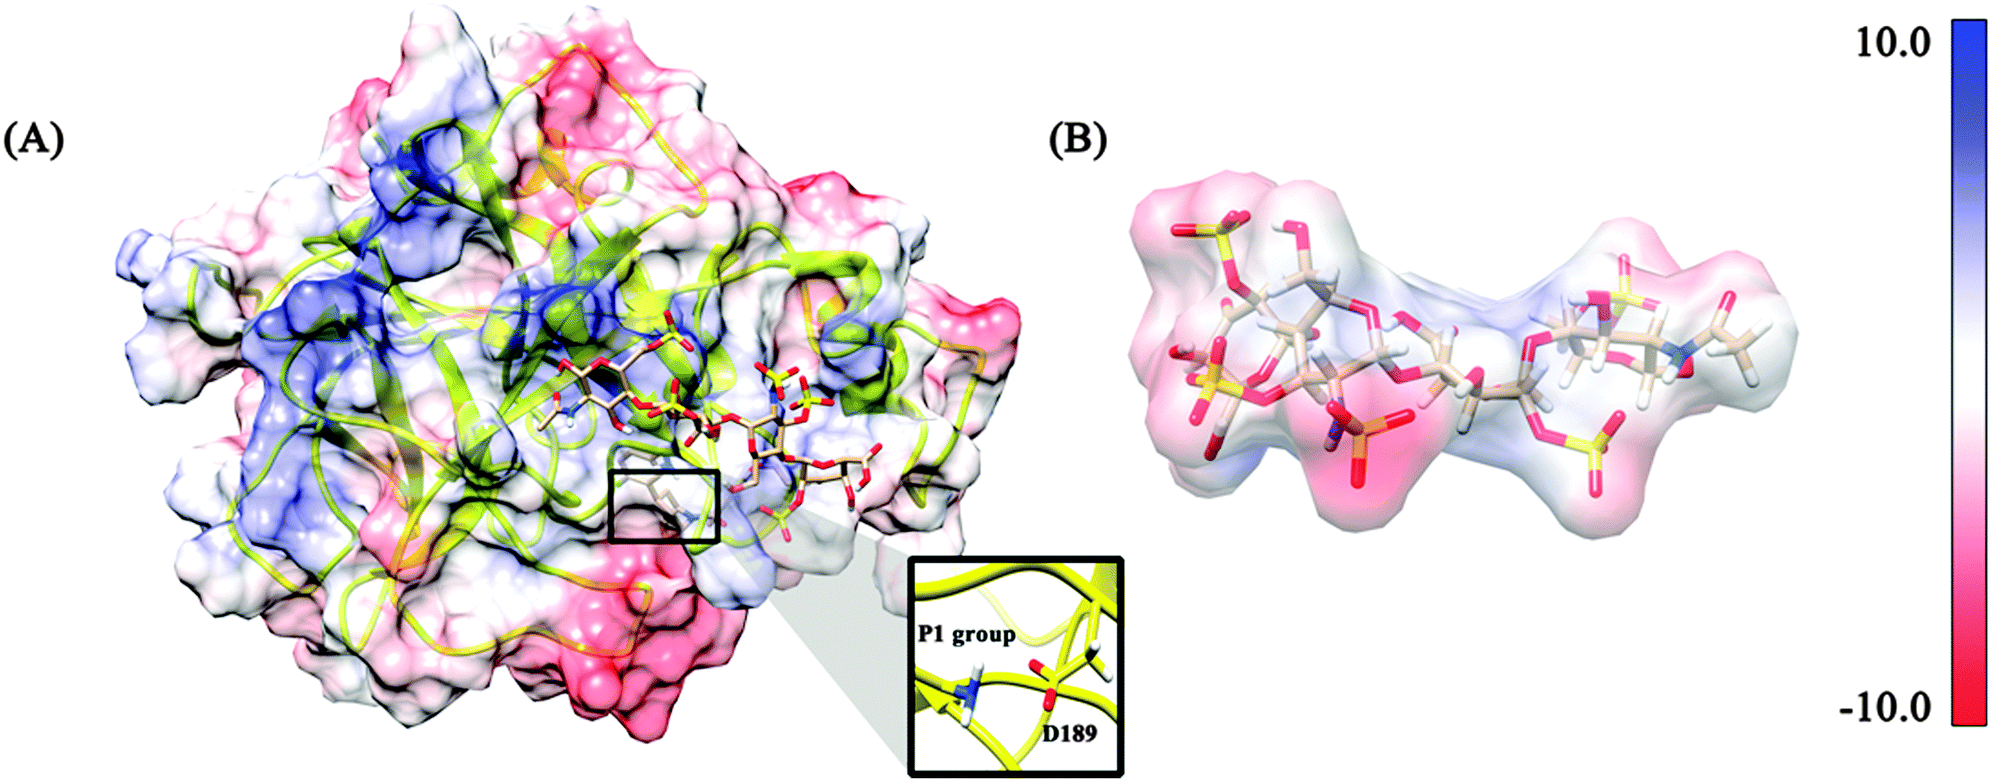
Molecular docking was performed using the AutoDock4.2 software package,32 which is designed to predict how small molecules, such as substrates or drug candidates, bind to a receptor of known 3D structure. As shown in Fig. 2, there is a positive charge region on the hBTM surface. 4-mer heparin is a highly negatively charged molecule as can be seen in Fig. 3B. As mentioned before, Asp189 is related to substrate or inhibitor binding. Heparin can keep the monomer of tryptase in its active form.18 The ways in which heparin activates the monomer of tryptase may be relative to Asp189. Lys162, Arg187, Arg188 and Arg224 locate around Asp189 and all these residues belong to the positively charged region. Therefore, it is quite rational to use the central coordinates of these residues as the docking box central coordinate. On the basis of the heparin–hBTM complex structure, the inhibitor 0GX was subsequently docked into the active pocket. The central coordinates of Asp189 were chosen as the docking box central coordinates.
 |
| | Fig. 2 Molecular surface of the crystal structure of hBTM colored by electrostatic potential. Yellow ribbons represent the overall crystal structure. The positive potentials are represented by red color and the negative potentials are colored by blue. | |
 |
| | Fig. 3 The final docking pose of 4-mer heparin and hBTM. The 4-mer heparin is represented in the stick mode. (A) The docking pose of the complex with the monomer structure in the electrostatic potential surface coloring manner. (B) The 4-mer heparin with its electrostatic potential surface coloring manner. | |
The 0GX and 4-mer heparin were docked into the human β-tryptase structure employing the Auto Dock tools (ADT).32 The nonpolar hydrogen atoms were merged and only the polar hydrogens remained. The Gasteiger charges were added to the receptor and 4-mer heparin molecules. A box size of 40 × 40 × 40 Å3 with a grid spacing of 0.375 Å was defined around the binding site of β-tryptase so that it contained all the residues that are critical for interacting with 4-mer heparin. The grid map around the binding site of β-tryptase was generated by the probe atoms employing the Auto Grid program. Each grid in the map represents the potential energy of a probe atom in the presence of all the atoms of the receptor molecule. The 4-mer heparin molecule was docked at the binding site of β-tryptase. The Lamarckian Genetic Algorithm (LGA) was used for docking study. One hundred runs with 15![[thin space (1/6-em)]](https://www.rsc.org/images/entities/char_2009.gif) 000000 maximum evaluations and 270000 generations were used for docking simulation. The docking pose is shown in Fig. 3A. The lowest binding energy for hBTM–heparin docking pose was −5.72 kcal mol−1 and the lowest binding energy for 0GX–hBTM–heparin docking pose was −7.21 kcal mol−1. This docking complex was chosen as the starting structure for the following MD simulations.
000000 maximum evaluations and 270000 generations were used for docking simulation. The docking pose is shown in Fig. 3A. The lowest binding energy for hBTM–heparin docking pose was −5.72 kcal mol−1 and the lowest binding energy for 0GX–hBTM–heparin docking pose was −7.21 kcal mol−1. This docking complex was chosen as the starting structure for the following MD simulations.
0GX was docked into the active pocket of the substrate free form of hBTM in order to create the inhibitor–hBTM complex system. The docking parameters were the same as the aforementioned docking process. The lowest binding energy for this docking pose was −2.32 kcal mol−1.
Molecular dynamic (MD) simulation
MD simulation for the substrate-free form of hBTM, inhibitor-containing hBTM (Nonhep) and its complex with 4-mer heparin (Hep) were carried out in AMBER11 MD package33 and the ff99SB force field.34 The force field parameters of the inhibitor molecule 0GX and 4-mer heparin were supplied by the general AMBER force field35 (GAFF) in Antechamber36 module of AMBER11. To keep the whole system neutral, sodium ions (Na+) were added using a coulomb potential grid. Then each of the two systems was solvated with the TIP3P water model37 in a truncated octahedron box with a 10 Å distance around the solute. The whole systems were submitted to 2000 steps of steepest decent minimization followed by 3000 steps of conjugate gradient minimization. Subsequently, the systems were heated from 0 to 300 K for 1000 ps in the canonical ensemble (NVT ensemble), applying harmonic restraints with a force constant of 10.0 kcal mol−1 Å−2 on the protein and small molecules. A Langevin thermostat was adopted. And then, the two systems were equilibrated in a NPT ensemble under constant pressure (1.0 bar) for 2000 ps. The relaxation time for a barostat bath was set to 2.0 ps. Finally, a total of 100 ns were simulated for each system under NPT ensemble conditions using periodic boundary conditions and particle-mesh Ewald38 (PME) for long range electrostatics.20 ns MD simulation was carried out for the substrate free form of hBTM in order to refine the crystal structure using the same parameters set mentioned above. Short range interactions were cut off at 10.0 Å, and bonds involving hydrogen were held fixed using SHAKE. The time step was set to 2 fs.
MD trajectory analysis
Trajectories generated from MD simulations were analyzed using AmberTools1.5. The root-mean-square deviation (RMSD) value is a useful estimation for quantifying conformational changes of the same proteins. In this study, Cα-RMSD was calculated for all systems. To evaluate local structure fluctuation of helixes and β-sheets, the hydrogen bond population was calculated. Hydrogen bonds were determined via the distance between the heavy atoms using a cutoff of 3.0 Å and the angle between the acceptor and donor atoms using a cutoff of 120°. The distance cut off for the salt bridge is set to 4.5 Å. 100 ns MD simulations were performed for the two systems, which can generate 50000 snapshots. Cluster analysis is the task of grouping a set of snapshots. In this method, snapshots in the same group (named a cluster) are more similar to each other than to those in other groups (clusters). The cluster analysis of protein conformations was carried out using averagelinkage as the clustering algorithm, and backbone atom RMSD as the distance metric. This averagelinkage algorithm is recommended in all cluster algorithms.39 Clustering analysis can be summarized as follows: under the averagelinkage algorithm, the distance from one cluster to another is defined as the average of all distances between individual points of the two clusters. At each iteration step, the two closest clusters are merged. This merging continues until the desired number of cluster is obtained (here is 5). VMD,40 Chimera41 and PyMOL42 software were employed to visualize the trajectories and to depict structural representations.
The average noncovalent interaction (aNCI) analysis
The NCI (non-covalent interactions) index provides a visual way to detect weak interactions in chemical systems. This method is on the basis of the analysis of the electron density, ρ, and its reduced gradient, s, where
and permits highlighting interactions characterized by a low density regime. The analysis of the second derivatives of the density along the main axis of variation allows distinguishing between different interaction types. In particular, nonbonded interactions, such as steric repulsion, are identified by the positive sign (λ2 > 0) of the second eigenvalue, λ2, of the electron density Hessian matrix; bonding interactions, such as hydrogen bonds, are characterized by a negative sign (λ2 < 0); van der Waals interactions present a negligible density overlap which gives λ2 ≅ 0.
In order to analyze noncovalent interactions in thermally fluctuating systems, for instance, trajectories generated by molecular dynamics simulations, a new definition of NCI is needed. The averaged noncovalent interaction (aNCI) method developed by Weitao Yang43 was employed here for the visualization of nonbonding interactions especially for salt bridge interaction. Using a promolecular44,45 density, the aNCI method can characterize a large system with a low computational cost and with meaningful results. The visualization of nonbonding interaction was carried out with the help of Multiwfn3.3 software package.46 In order to generate 1000 snapshots for aNCI analysis for Hep and Nonhep systems, a short time period MD was implemented. The starting structures were chosen from the most popular structures of clustering analysis for each of the two systems. The parameter set was the same as the aforementioned MD simulation. 2 ns production run was carried out for each two systems which generated 1000 snapshots. VMD was employed to depict the results of aNCI analysis.
Principal component analysis
Principal component analysis (PCA) is used for spacing a protein's conformational space into essential subspace containing several degrees of freedom that describe the motions of the proteins.47 PCA uses a covariance matrix constructed with structures sampled from MD simulations. By diagonalization of a covariance matrix of coordinates of the systems, the motions of a structure along the trajectory are determinate. To obtain the dominant motion over a MD simulation, a trajectory would be projected along the direction described by a selected eigenvector. Through calculation two largest projections on the average structure, the primary moving direction of the protein can be obtained. PCA was performed using ProDy48 software. Three-dimensional structural snapshots were visualized by employing VMD and its plugin NWWiz.40,48
MM-GB/SA calculations
The MM-GB/SA methods23,25,26,49 implemented in AMBER 1133 were applied to calculate the binding free energy between the ligand with the enzyme.50 The binding free energy (ΔGbind) in MM-GB/SA between a ligand (L) and a receptor (R) to form a complex RL was calculated as| | | ΔGbind = Gcomplex − (Greceptor + Gligand) | (1) |
| | | EMM = Eint + Eele + Evdw | (3) |
In eqn (2), the EMM, Gsol, and TS represent molecular mechanics component in the gas phase, the stabilization energy due to salvation, and a vibrational entropy term, respectively. EMM is given as a sum of Eint, Eele, and Evdw which are internal, Coulomb and van der Waals interaction terms, respectively. Solvation energy, Gsol, is separated into an electrostatic solvation free energy (GGB) and a nonpolar solvation free energy (GSA). The former can be obtained by the Generalized Born (GB) method. The latter is considered to be proportional to the molecular solvent accessible surface area (SASA).51 The binding free energies were obtained by averaging over the values calculated for 3000 snapshots from the last 30 ns of the trajectories at 5 ps intervals for the complex structure.
Result and discussion
Constructed the docking mode of the 4-mer-heparin–βII-tryptase monomer complex
Heparin plays a vital role in stabilizing the active form of human β-tryptase, no matter in tetrameric or monomeric form.3 It's a pity that all structures of human β-tryptase deposited in Protein Data Bank are crystallized without heparin. In this study, in order to obtain the exact complex structure of inhibitor (0GX)–heparin–hBTM, docking calculations were carried out. Based on the refined substrate free form of hBTM, 4-mer heparin was first docked into the heparin binding region. The lowest binding energy for the 4-mer heparin–hBTM complex is −5.73 kcal mol−1. This docking pose was employed as the starting point of the next docking calculation for 0GX. The lowest binding energy (−7.21 kcal mol−1) docking pose for the 0GX–heparin–hBTM complex was shown in Fig. 3. It is worth noting that the close distance between the P1 group of 0GX and Asp189 may indicate a nonbonded interaction. The final docking pose for the 0GX–heparin–hBTM complex structure is shown in Fig. 3. The 4-mer-heparin molecule bound to the positively charged region of the βII-tryptase monomer. The 0GX–hBTM and 0GX–heparin–hBTM complexes generated by docking calculations are used as the starting point for the subsequent MD simulations.
The overall structural features of Hep and Nonhep system
Root-mean-square deviations (RMSDs) provide insights into the conformational changes of the structure by comparing changes in the positions of the atoms with a reference structure. RMSDs were calculated with respect to the initial frame which was generated by MD simulations for the complex structures with and without 4-mer heparin. The RMSD plot is shown in Fig. 4. The structure of the Hep system remained quite stable with respect to the initial structure during the whole simulation time. The RMSD plot for the Nonhep system fluctuated quite fiercely in the simulation time period especially during the last 20 ns. This indicates that the Nonhep system structure undergoes certain conformational changes. The differentiation of structures in Hep and Nonhep systems might affect the inhibitation ability of 0GX.
 |
| | Fig. 4 Calculated root-mean-square deviations (RMSD) of the backbone atoms referenced to the corresponding starting structure. Blue lines represent the Hep system and red lines represent the Nonhep system. | |
Root-mean-square fluctuation (RMSF) offers details on fluctuations of each residue over simulations time. High values indicate large flexibility of certain residues. Residues with higher RMSF values are labeled in Fig. 5. As shown in Fig. 5, the residues of the βII-tryptase monomer shows larger flexibility when 4-mer heparin is not present. Asp50, Gly123 and Thr168 with a higher RMSF value belong to different regions of the βII-tryptase monomer. Gly123 came from a loop region that is near to the binding area of 4-mer heparin, while these residues showed small flexibility in the Hep system. This may be due to the formation of certain nonbonding interactions between 4-mer heparin and the residues of this region. Thr168 in Nonhep system exhibit the highest RMSF value over 5 Å. This implies that there may be some big conformational changes in the region where Thr168 is located.
 |
| | Fig. 5 Root-mean-square fluctuations (RMSF) of the Hep and Nonhep system during 100 ns MD simulations. Flexible residues are labelled: Asp50, Glu118 to Gly123 and Thr168. | |
Salt bridges gives heparin an amazing role in the Hep system
Nonbonding interactions, such as a hydrogen bond, hydrophobic interaction and salt bridges, are well known to play a vital role in the structural and functional aspect of biological molecules. In this regard, hydrogen bonds between inhibitor 0GX and its adjacent residues are monitored over the simulation time. The hydrogen bond analysis results for Hep and Nonhep system were shown in Table 1, Table S1 (ESI†) and Fig. 6. In the Nonhep system, Ser195, Ser190 and Gly216 have important contributions to 0GX binding through the formation of hydrogen bonds in approximately 23.31%, 14.97% and 10.27% frames, respectively. From Table 1, we know that the 0GX inhibitor forms hydrogen bonds with its adjacent residues mainly through its P1 group. When 4-mer heparin was present (that is in the Hep system), all the hydrogen bonds which are capable of binding 0GX disappeared. Though the hydrogen bonds in the Hep system disappeared, the RMSD plot of inhibitor 0GX indicated that no big conformational changes happened to 0GX in the Hep system during the whole simulation time, as shown in Fig. S1 (ESI†). As mentioned previously, the 4-mer heparin is a highly negatively charged molecule. Electrostatic interaction like a salt bridge might exist between heparin and its adjacent residues. Thus, salt bridges with a distance cut off of 4.5 Å in a Hep and Nonhep system were monitored and the results are shown in Table 2 and Table S2 (ESI†).
Table 1 Properties of hydrogen bonds between 0GX and its adjacent residues, including occupied, distance and angle
| H-bond |
Donor and acceptor |
Occupied (%) |
Distance (Å) |
Angle (°) |
| (a) Tryptase without 4-mer heparin |
| 1 |
0GX@F-195@HG |
23.31 |
3.04 |
34.27 |
| 2 |
190@O-0GX@H28 |
14.97 |
3.15 |
32.44 |
| 3 |
216@O-0GX@H27 |
10.27 |
3.14 |
22.53 |
|
|
| (b) Tryptase with 4-mer heparin |
| 1 |
0GX@O-88@HE22 |
20.63 |
3.248 |
43.01 |
| 2 |
189@O-0GX@H28 |
5.99 |
3.221 |
54.35 |
 |
| | Fig. 6 Percentage occupancy of hydrogen bonds in different systems. All these hydrogen bonds are monitored during the last 30 ns of each system. (A) Hydrogen bonds 4-mer heparin formed with its adjacent residues. (B) Hydrogen bonds between inhibitor 0GX and its adjacent residues in the Hep system. (C) Hydrogen bonds between inhibitor 0GX and its adjacent residues in the Nonhep system. | |
Table 2 Salt bridge occupancies of crucial residues between inhibitor and HBTM
|
|
Salt bridge |
Occupied (%) |
| With heparin |
Without heparin |
| 1 |
D189@OD2-X244@H27 |
100.00 |
NA |
| 2 |
D189@OD2-X244@H28 |
100.00 |
NA |
| 3 |
D189@OD1-X244@H27 |
100.00 |
NA |
| 4 |
D189@OD1-X244@H28 |
100.00 |
NA |
As shown in Table 2, four salt bridges formed between the carboxy group of Asp189 and the P1 group of inhibitor 0GX. These four salt bridges maintained throughout the whole simulation time period. These results confirm existence of the supposed salt bridge.16,17 When the 4-mer heparin was not present, these four salt bridges disappeared. A large number of salt bridges were also found between Arg188 and 4-mer heparin as shown in Table S2(d) (ESI†). In the Hep system, Arg188 helped to maintain a proper distance between Asp189 and the P1 group of 0GX. This proper distance ensured the formation of a salt bridge between Asp189 and the P1 group of 0GX. In order to visualize nonbonding interactions between P1 group and its adjacent residues, aNCI analysis was carried out for the Hep and Nonhep system using Multiwfn3.3 software package and the results are shown in Fig. 7. For the Hep system, a stable electrostatic interaction was detected around the two hydrogen atoms of the P1 group (blue colored surface in figure). While for the Nonhep system, such electrostatic interaction was not found around the P1 group. Instead, weak VDW interactions were observed near the P1 group (light green colored surface). These results were consistent with the aforementioned salt bridge analysis.
 |
| | Fig. 7 The visualization of nonbonding interaction around the P1 group of 0GX in the Hep and Nonhep system. The surfaces are colored on a blue–green–red scale, ranging from −0.25 to 0.25. Blue indicates strong attractive interaction, red indicates strong nonbonded overlap and green indicates dispersion interaction. | |
The salt bridge occupancies for residues around Thr168 in the Hep and Nonhep system are shown in Table S2(a) and (b) (ESI†). In the Nonhep system, these residues totally formed fourteen salt bridges. That is, the salt bridge for the Nonhep system is localized interaction within this region. In the Hep system, there were only six salt bridges in the region where Thr168 was located. RMSF calculation revealed that residues around Thr168 exhibited more flexibility in the Nonhep system than in the Hep system. Taken the different salt bridge occupancies of these residues in two systems into consideration, the localized salt bridge interaction in the region where Thr168 located made these residues more flexible. In the Hep system, the localized salt bridge interactions decreased when heparin was present. From this point of view, heparin binding to the βII-tryptase monomer can stabilize the monomer structure. Lys150 in the Hep system formed a lot of salt bridges with 4-mer heparin as shown in Table S2(c) (ESI†). These interactions held fixed this residue. From the salt bridge analysis results for Hep and Nonhep system, we can conjecture that heparin maintained the overall structure of hBTM.
Clustering analysis for Hep and Nonhep systems
In order to get a deeper insight into the structural details of Hep and Nonhep systems, clustering analysis of the structures was carried out. Each trajectory was divided into five clusters using the averagelinkage algorithm. In these five clusters, five snapshots were chosen to be the representative structures of clusters and named as follows: C0, C1, C2, C3 and C4. C0 represents the initial structure.
In the Hep system, the most popular cluster is C0 containing 52.5% of the total population. This result implies that the overall structure of the Hep system remains quite stable during the last 30 ns of simulation time. In the Nonhep system, the most popular cluster is C0 containing 57.9%. In order to verify the structural differentiation between each representative structure and the crystal structure, C0 of the Hep system, C0 of the Nonhep system were superimposed to the crystal structure. The results are shown in Table 3 and Fig. 8. Hep C0 has the lowest RMSD value, 0.660 Å. This suggests that the Hep system maintain a good overall structural feature compared to crystal structure during the simulation time. And this also implies that when 4-mer heparin is present, the function of βII-tryptase monomer is similar to the crystal structure. As shown in Fig. 8, the remarkable structural variance of Nonhep C0 and crystal structure lies in the region where Thr168 located. This structural variance may due to the absence of 4-mer heparin.
Table 3 Populations of representative structures and their RMSD values compared to the crystal structure
| Structure |
Population (%) |
RMSD to crystal structure (Å) |
| Hep C0 |
52.5 |
0.660 |
| Nonhep C0 |
57.9 |
0.956 |
 |
| | Fig. 8 Comparisons of the clustering analysis structures and the crystal structure. The crystal structure is colored in gray. Hep C0, Nonhep C2 and Nonhep C4 are colored in yellow, green and blue, respectively. | |
A loop region has been identified responsible for the orientation of the P1 group through salt bridges
The P1 group of the 0GX inhibitor is of great importance in the second class of tryptase inhibitors and the orientation of this group may affect the overall activity of inhibitor. Fig. 9 shows the details of the P1 group in different structures of the βII-tryptase monomer. The P1 group in Hep C0 possessed a similar orientation as in the crystal structure while the P1 group in Nonhep C0 faced the opposite direction. In order to better describe the orientation of P1 group, a dihedral is define using four atoms, named H27, N2, C23 and C22 as shown in Fig. 9. This dihedral angle in Hep and Nonhep systems was monitored over the whole simulation time and the results are shown in Fig. 10. The dihedral angle value of the Hep system was around −50° during the whole simulation time period while the dihedral angle value for the Nonhep system fluctuated fiercely throughout the simulation time.
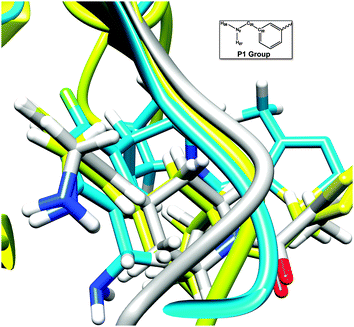 |
| | Fig. 9 A close view of the P1 group in three different structures. Gray for the crystal structure, yellow for the Hep system and blue for the Nonhep system. | |
 |
| | Fig. 10 Dihedral changes (psi) for the P1 group in Hep (blue lines) and Nonhep (red lines) during 100 ns MD simulations. | |
The different dihedral values of the P1 group in Hep and Nonhep systems are probably due to 4-mer heparin. Just as mentioned before, heparin is a highly negatively charged molecule and a vast number of salt bridges formed between this molecule and its adjacent residues including Arg188 as shown in Table S2(d) (ESI†). Four salt bridges formed between Asp189 and the P1 group of 0GX of the inhibitor. The occupancy varied evidently when 4-mer heparin was present or not. Arg188 together with Asp189 are in a loop region which is deep inside the core region of βII-tryptase monomer. This loop region was found to be responsible in the orientation of the P1 group through salt bridge interaction in the presence of 4-mer heparin. Thus, we can conjecture that heparin helps to direct the P1 group of 0GX inhibitor into a correct orientation through the loop region where Arg188 and Asp189 are located. The correct orientation facilitate the 0GX binding to the protein and this closely binding pattern between 0GX and protein may enhance the performance of the 0GX inhibitor. The finding of this loop region may be useful for further inhibitor design of human β-tryptase.
Relative motion of hBTM structure
To quantitatively identify the relative motion of the structures, especially for the previously mentioned loop region of Hep and Nonhep systems, PCA was carried out for each system. In general, the two most principal components (named PC1 and PC2) represent more than 50% of the overall fluctuations for Hep and Nonhep system. In order to clearly demonstrate the motion of βII-tryptase monomer, the structural variation along the first principal component is shown in Fig. 11. It is easy to find the remarkable motions in the two systems points on different parts of the structures. For Nonhep, the most distinctive is the movement of the region where Thr168 located and the heparin binding region. The above analysis reveals that the absence of 4-mer heparin makes the region where Thr168 located and the heparin bonding region very flexible and disordered. The PCA analysis indicates that the region where Thr168 is located in the Nonhep system moved up towards the outside of βII-tryptase monomer and heparin bonding region moved down. These two different direction movements can make the structure unstable, affect the conformation of the active site and may lead to the decrease of enzyme's activity.
 |
| | Fig. 11 A porcupine plot in stereo showing the βII-tryptase monomer with cones signifying the first eigenvector movements. | |
The collective motion for the special loop region is also noteworthy. In general, the motion of the loop region in the Hep system is bigger than in the Nonhep system. The loop region swings between the heparin binding region and the 0GX binding region in the Hep system while in the Nonhep system this kind of motion is not observed. This swing mode collective motion for Hep and Nonhep systems is show in Fig. S2 (ESI†). The swinging mode of the loop region in the Hep system might be responsible for the conduction of the salt bridge interaction. A lot of salt bridge interactions are brought into the Hep system upon heparin binding. With the help of the swinging mode motion of the loop region, the salt bridge interaction is transferred to the P1 group of 0GX. Thus, the salt bridge interactions brought about by heparin can affect the orientation of the P1 group. PCA analysis shows that when 4-mer heparin is present, no notable movements were observed and the structure of the Hep system maintains a perfect overall structural feature compared to the crystal structure. The special loop region moved in a way, in which salt bridge interactions can conduct to the P1 group of 0GX. This confirms the vital role which 4-mer heparin plays in the stabilization of the hBTM structure.
Binding free energy aspect for Hep and Nonhep systems
To describe the inhibitation ability of 0GX, MM-GB/SA calculations and energy decomposition were performed. A total of 3000 snapshots were extracted from the last 30 ns trajectory for binding free energy analysis. The results for Hep and Nonhep system are listed in Table 4.
Table 4 Binding free energy (kcal mol−1) and its components for the heparin–β-tryptase monomer and the β-tryptase monomer
| System |
ΔEele |
ΔEvdw |
ΔGGB |
ΔGSASA |
ΔGMM-GB/SAa |
−TΔS |
ΔGTOTb |
|
ΔGMM-GB/SA = ΔEele + ΔEvdw + ΔGGB + ΔGSASA.
ΔGTOT = ΔGMM-GB/SA − TΔS. ΔG = RTlnKi, ΔGexp = −10.22 kcal mol−1. |
| Hep |
−11.90 ± 2.56 |
−31.90 ± 2.76 |
14.51 ± 2.45 |
−5.75 ± 0.43 |
−35.60 ± 2.90 |
28.15 ± 2.56 |
−10.70 ± 2.11 |
| Nonhep |
−2.42 ± 3.83 |
−36.87 ± 3.50 |
14.80 ± 2.56 |
−3.35 ± 0.59 |
−27.84 ± 3.76 |
23.77 ± 3.53 |
−4.07 ± 2.87 |
Using the competitive inhibition equation, Ki = IC50/(1 + [S]/Km), the Ki value of inhibitor 0GX to β-tryptase was determined by Guyan Liang.10 Based on the Ki value the corresponding ΔG value of experimental value was obtained. As shown in Table 4, the calculated binding free energy for the Hep system is very close to the ΔGexp value. While the higher binding free energy for the Nonhep system indicated that 0GX molecule bound loosely to hBTM protein.
Conclusions
The application of the molecular docking strategy and MD simulation has become indispensable in computational area of particular emphasis with regard to receptor–ligand interactions.23,25,52 In order to find out the vital role heparin plays in the βII-tryptase monomer, molecular docking method was used and the complex of 4-mer heparin–βII-tryptase monomer was thus obtained. The complex structure of 4-mer heparin and the βII-tryptase monomer has been proposed for the first time. We have investigated the atomic-level structural variations between the monomer structure of human βII-tryptase with and without 4-mer heparin to understand the molecular origin for the stabilization of protein structure by heparin. Compared to the Nonhep system, the main form of nonbonding interaction in the Hep system is not the hydrogen bond interaction. The positively charged property of heparin makes salt bridges to be the main form of nonbonding interaction in the Hep system. These salt bridges stabilized the βII-tryptase monomer structure and kept the P1 group of 0GX facing a favourable way, in which the inhibitor 0GX represented its best inhibition ability. The result of the salt bridge confirms the supposed salt bridge.16,17 A crucial loop region which is responsible for conducting the salt bridge interaction between heparin and inhibitor 0GX was found. Arg188 and Asp189 from this loop acted as a salt bridges intermediary between 4-mer heparin and 0GX have been proved to be responsible for the direction of the P1 group of 0GX. Thus, we figure out how heparin affects the activity of hBTM. Moreover, the MM-GB/SA calculations for the Hep system has a similar tendency with the experiment results10 which may indicate that βII-tryptase monomer is indeed in its active form when 4-mer heparin was present. Based on our results, heparin itself is of great importance in stabilization of the monomer structure and maintaining the activity of this protein. Our present study provides important insights into the structure–function relationships between heparin and the βII-tryptase monomer and the heparin activation βII tryptase monomer mechanism, which could contribute to further inhibitor design of this enzyme and may also improve our understanding of inflammatory and allergy related diseases.
Acknowledgements
This work is supported by Natural Science Foundation of China (Grant No. 21273095, 20903045, 21203072).
Notes and references
- D. Lagunoff and E. Benditt, Ann. N. Y. Acad. Sci., 1963, 103, 185–198 CrossRef CAS PubMed.
- G. Glenner and L. Cohen, Nature, 1960, 185, 846–847 CrossRef CAS.
- J. Hallgren and G. Pejler, FEBS J., 2006, 273, 1871–1895 CrossRef CAS PubMed.
- J. Clark, W. Moore and R. Tanaka, Drugs Future, 1996, 21, 811–816 CAS.
- A. Norris, Expert Opin. Invest. Drugs, 2004, 13, 739–741 CrossRef CAS PubMed.
- W. Tremaine, A. Brzezinski, J. Katz, D. Wolf, T. Fleming, J. Mordenti, L. Strenkoski-Nix and M. Kurth, Aliment. Pharmacol. Ther., 2002, 16, 407–413 CrossRef CAS.
- K. Rice and P. Sprengeler, Curr. Opin. Drug Discovery Dev., 1999, 2, 463–474 CAS.
- P. J. B. Pereira, A. Bergner, S. Macedo-Ribeiro, R. Huber, G. Matschiner, H. Fritz, C. P. Sommerhoff and W. Bode, Nature, 1998, 392, 306–311 CrossRef CAS PubMed.
- S. C. Alter, J. A. Kramps, A. Janoff and L. B. Schwartz, Arch. Biochem. Biophys., 1990, 276, 26–31 CrossRef CAS.
- G. Liang, Y. M. Choi-Sledeski, P. Shum, X. Chen, G. B. Poli, V. Kumar, A. Minnich, Q. Wang, J. Tsay and K. Sides, Bioorg. Med. Chem. Lett., 2012, 22, 1606–1610 CrossRef CAS PubMed.
- G. Caughey, W. Raymond, E. Bacci, R. Lombardy and R. Tidwell, J. Pharmacol. Exp. Ther., 1993, 264, 676–682 CAS.
- J. M. Clark, W. M. Abraham, C. E. Fishman, R. Forteza, A. Ahmed, A. Cortes, R. L. Warne, W. R. Moore and R. D. Tanaka, Am. J. Respir. Crit. Care Med., 1995, 152, 2076–2083 CrossRef CAS PubMed.
- K. D. Rice, R. D. Tanaka, B. A. Katz, R. P. Numerof and W. R. Moore, Curr. Pharm. Des., 1998, 4, 381–396 CAS.
- L. E. Burgess, B. J. Newhouse, P. Ibrahim, J. Rizzi, M. A. Kashem, A. Hartman, B. J. Brandhuber, C. D. Wright, D. S. Thomson and G. P. Vigers, Proc. Natl. Acad. Sci. U. S. A., 1999, 96, 8348–8352 CrossRef CAS.
- C. R. Hopkins, M. Czekaj, S. S. Kaye, Z. Gao, J. Pribish, H. Pauls, G. Liang, K. Sides, D. Cramer and J. Cairns, Bioorg. Med. Chem. Lett., 2005, 15, 2734–2737 CrossRef CAS PubMed.
- K. D. Combrink, H. B. Gülgeze, N. A. Meanwell, B. C. Pearce, P. Zulan, G. S. Bisacchi, D. G. Roberts, P. Stanley and S. M. Seiler, J. Med. Chem., 1998, 41, 4854–4860 CrossRef CAS PubMed.
- M. T. Stubbs, R. Morenweiser, J. Stürzebecher, M. Bauer, W. Bode, R. Huber, G. P. Piechottka, G. Matschiner, C. P. Sommerhoff and H. Fritz, J. Biol. Chem., 1997, 272, 19931–19937 CrossRef CAS PubMed.
- J. Hallgren, D. Spillmann and G. Pejler, J. Biol. Chem., 2001, 276, 42774–42781 CrossRef CAS PubMed.
- C. P. Sommerhoff, W. Bode, G. Matschiner, A. Bergner and H. Fritz, Biochim. Biophys. Acta, 2000, 1477, 75–89 CrossRef CAS.
- J. Hallgren, S. Lindahl and G. Pejler, J. Mol. Biol., 2005, 345, 129–139 CrossRef CAS PubMed.
- I. Fajardo and G. Pejler, Biochem. J., 2003, 369, 603–610 CrossRef CAS PubMed.
- J. Qin, B. Lei, L. Xi, H. Liu and X. Yao, Eur. J. Med. Chem., 2010, 45, 2768–2776 CrossRef CAS PubMed.
- Y. Wang, Q.-C. Zheng, J.-L. Zhang, Y.-L. Cui, Q. Xue and H.-X. Zhang, J. Mol. Model., 2013, 19, 5213–5223 CrossRef CAS PubMed.
- Y. Xu, Y. L. Cu, Q. C. Zheng, H. X. Zhang and C. C. Sun, Chem. J. Chin. Univ., 2013, 34, 1226–1232 CAS.
- Q. Xue, J.-L. Zhang, Q.-C. Zheng, Y.-L. Cui, L. Chen, W.-T. Chu and H.-X. Zhang, Langmuir, 2013, 29, 11135–11144 CrossRef CAS PubMed.
- Y.-L. Cui, Q.-C. Zheng, J.-L. Zhang, Q. Xue, Y. Wang and H.-X. Zhang, J. Chem. Inf. Model., 2013, 53, 3308–3317 CrossRef CAS PubMed.
-
D. Studio, Accelrys Inc, San Diego, CA, USA, 2009 Search PubMed.
- J. C. Gordon, J. B. Myers, T. Folta, V. Shoja, L. S. Heath and A. Onufriev, Nucleic Acids Res., 2005, 33, W368–W371 CrossRef CAS PubMed.
- A. D. Becke, J. Chem. Phys., 1993, 98, 5648–5652 CrossRef CAS PubMed.
- C. Lee, W. Yang and R. G. Parr, Phys. Rev. B: Condens. Matter Mater. Phys., 1988, 37, 785 CrossRef CAS.
-
G. Scuseria, M. Robb, J. Cheeseman, G. Scalmani, V. Barone, B. Mennucci, G. Petersson, H. Nakatsuji, M. Caricato and X. Li, Wallingford, CT, 2009.
- G. M. Morris, R. Huey, W. Lindstrom, M. F. Sanner, R. K. Belew, D. S. Goodsell and A. J. Olson, J. Comput. Chem., 2009, 30, 2785–2791 CrossRef CAS PubMed.
-
D. e. Case, T. Darden, T. Cheatham Iii, C. Simmerling, J. Wang, R. Duke, R. Luo, R. Walker, W. Zhang and K. Merz, University of California, San Francisco, 2010, p. 142.
- V. Hornak, R. Abel, A. Okur, B. Strockbine, A. Roitberg and C. Simmerling, Proteins: Struct., Funct., Bioinf., 2006, 65, 712–725 CrossRef CAS PubMed.
- J. Wang, R. M. Wolf, J. W. Caldwell, P. A. Kollman and D. A. Case, J. Comput. Chem., 2004, 25, 1157–1174 CrossRef CAS PubMed.
- J. Wang, W. Wang, P. A. Kollman and D. A. Case, J. Mol. Graphics Modell., 2006, 25, 247–260 CrossRef CAS PubMed.
- W. L. Jorgensen, J. Chandrasekhar, J. D. Madura, R. W. Impey and M. L. Klein, J. Chem. Phys., 1983, 79, 926–935 CrossRef CAS PubMed.
- T. Darden, D. York and L. Pedersen, J. Chem. Phys., 1993, 98, 10089–10092 CrossRef CAS PubMed.
- J. Shao, S. W. Tanner, N. Thompson and T. E. Cheatham, J. Chem. Theory Comput., 2007, 3, 2312–2334 CrossRef CAS.
- W. Humphrey, A. Dalke and K. Schulten, J. Mol. Graphics, 1996, 14, 33–38 CrossRef CAS.
- E. F. Pettersen, T. D. Goddard, C. C. Huang, G. S. Couch, D. M. Greenblatt, E. C. Meng and T. E. Ferrin, J. Comput. Chem., 2004, 25, 1605–1612 CrossRef CAS PubMed.
-
W. L. DeLano, 2002.
- P. Wu, R. Chaudret, X. Hu and W. Yang, J. Chem. Theory Comput., 2013, 9, 2226–2234 CrossRef CAS PubMed.
- M. Spackman and E. Maslen, J. Phys. Chem., 1986, 90, 2020–2027 CrossRef CAS.
- A. M. Pendás, V. Luana, L. Pueyo, E. Francisco and P. Mori-Sanchez, J. Chem. Phys., 2002, 117, 1017–1023 CrossRef PubMed.
- T. Lu and F. Chen, J. Comput. Chem., 2012, 33, 580–592 CrossRef CAS PubMed.
- A. Amadei, A. Linssen and H. J. Berendsen, Proteins: Struct., Funct., Bioinf., 1993, 17, 412–425 CrossRef CAS PubMed.
- A. Bakan, L. M. Meireles and I. Bahar, Bioinformatics, 2011, 27, 1575–1577 CrossRef CAS PubMed.
- X. Wang, P. Pan, Y. Li, D. Li and T. Hou, Mol. BioSyst., 2014, 10, 1196–1210 RSC.
- J. M. J. Swanson, R. H. Henchman and J. A. McCammon, Biophys. J., 2004, 86, 67–74 CrossRef CAS.
- T. J. Hou, W. Zhang, D. A. Case and W. Wang, J. Mol. Biol., 2008, 376, 1201–1214 CrossRef CAS PubMed.
- Y. L. Cui, J. L. Zhang, Q. C. Zheng, R. J. Niu, Y. Xu, H. X. Zhang and C. C. Sun, Chem. – Eur. J., 2013, 19, 549–557 CrossRef CAS PubMed.
Footnote |
| † Electronic supplementary information (ESI) available: The RMSD plots of inhibitor 0GX of Hep and Nonhep systems and the properties of nonbonding interactions. See DOI: 10.1039/c4mb00381k |
|
| This journal is © The Royal Society of Chemistry 2015 |
Click here to see how this site uses Cookies. View our privacy policy here.