 Open Access Article
Creative Commons Attribution 3.0 Unported Licence
Connecting gene expression data from connectivity map and in silico target predictions for small molecule mechanism-of-action analysis†
Aakash Chavan
Ravindranath‡
a,
Nolen
Perualila-Tan‡
b,
Adetayo
Kasim
c,
Georgios
Drakakis
a,
Sonia
Liggi
a,
Suzanne C.
Brewerton
d,
Daniel
Mason
a,
Michael J.
Bodkin
d,
David A.
Evans
d,
Aditya
Bhagwat
e,
Willem
Talloen
f,
Hinrich W. H.
Göhlmann
f,
QSTAR Consortium§
,
Ziv
Shkedy
*b and
Andreas
Bender
*a
aUnilever Centre for Molecular Science Informatics, Department of Chemistry, University of Cambridge, Lensfield Road, Cambridge CB2 1EW, UK. E-mail: ab454@cam.ac.uk
bInteruniversity Institute for Biostatistics and Statistical Bioinformatics, Universiteit Hasselt, Agoralaan 1, B3590 Diepenbeek, Belgium
cDurham University, UK
dEli Lilly U.K., Erl Wood Manor, Windlesham, Surrey GU206PH, UK
eOpen Analytics, 2600, Antwerp, Belgium
fJanssen Pharmaceutical Companies of Johnson and Johnson, 2340, Beerse, Belgium
First published on 16th September 2014
Abstract
Integrating gene expression profiles with certain proteins can improve our understanding of the fundamental mechanisms in protein–ligand binding. This paper spotlights the integration of gene expression data and target prediction scores, providing insight into mechanism of action (MoA). Compounds are clustered based upon the similarity of their predicted protein targets and each cluster is linked to gene sets using Linear Models for Microarray Data. MLP analysis is used to generate gene sets based upon their biological processes and a qualitative search is performed on the homogeneous target-based compound clusters to identify pathways. Genes and proteins were linked through pathways for 6 of the 8 MCF7 and 6 of the 11 PC3 clusters. Three compound clusters are studied; (i) the target-driven cluster involving HSP90 inhibitors, geldanamycin and tanespimycin induces differential expression for HSP90-related genes and overlap with pathway response to unfolded protein. Gene expression results are in agreement with target prediction and pathway annotations add information to enable understanding of MoA. (ii) The antipsychotic cluster shows differential expression for genes LDLR and INSIG-1 and is predicted to target CYP2D6. Pathway steroid metabolic process links the protein and respective genes, hypothesizing the MoA for antipsychotics. A sub-cluster (verepamil and dexverepamil), although sharing similar protein targets with the antipsychotic drug cluster, has a lower intensity of expression profile on related genes, indicating that this method distinguishes close sub-clusters and suggests differences in their MoA. Lastly, (iii) the thiazolidinediones drug cluster predicted peroxisome proliferator activated receptor (PPAR) PPAR-alpha, PPAR-gamma, acyl CoA desaturase and significant differential expression of genes ANGPTL4, FABP4 and PRKCD. The targets and genes are linked via PPAR signalling pathway and induction of apoptosis, generating a hypothesis for the MoA of thiazolidinediones. Our analysis show one or more underlying MoA for compounds and were well-substantiated with literature.
1 Introduction
Understanding protein target and off-target effects of bioactive compounds is a critical challenge in the field of drug discovery. These effects are of great importance as bioactive compounds that indicate a certain therapeutic effect could cause inadvertent phenotypic effects by binding to unexpected protein targets, thus resulting in disruption of compound efficacy.1 The mechanism of action (MoA) of compounds could provide insight into inadvertent phenotypic effects. Although many attempts have been made to understand MoA, this still remains a challenge in the field.2Existing methods used to understand the MoA of compounds involve analysing chemical structures, transcriptional responses following treatment and text mining. Phenotypic readouts have also been recently used to explore MoA.3,4 Studies by Young et al. show that integrated analysis of phenotypic screening features and ligand targets could identify MoA.5 Other studies scrutinizing gene expression profiles also have given insight into drug MoA and further prediction of drug targets.6 Applications using gene expression profiles to observe several genes and signalling pathways concurrently enrich the understanding of underlying mechanisms. Many researchers have focused their interest on the delineation of gene expression profiles, in order to identify those key genes and gene clusters whose expressions alter disease state.7,8 These gene alteration patterns are identified in order to underpin the mechanism of disease.
In order to experimentally determine gene expression variations as described above, microarray techniques have been developed to measure almost any change in biological activity that can be reflected in an altered gene expression pattern.9,10 Using such high-end technology, compound effects can be measured to provide extensive understanding on the effect that genomic scale alterations have at a cellular level. This technique is capable of simultaneously providing information on the expression of a few thousand genes at a time.11 Microarrays facilitate the discovery of novel and unexpected functions of genes. This method is very well established and has a wide range of applications such as the identification of novel disease subtypes, development of new diagnostic tools and identification of underlying mechanisms of disease or drug response.12,13 In addition, gene expression profiles also help in identifying therapeutic protein targets understanding gene function, as well as establishing diagnostic, prognostic and predictive markers of disease.14
Due to the advances in the genome studies, there is a wealth of microarray data that has been deposited in public databases such as Expression Atlas, which is a subset of ArrayExpress.15,16 Other public databases such as Connectivity Map (CMap) consist of drug-like compounds tested for gene expression in four cell lines. However, it is largely unknown how a compound exactly modulates gene expression and only a few data analysis approaches exist. One of the commonly used approaches in comparing gene signatures is the Kolmogorov–Smirnov statistical method, which was used in the CMap study.17,18 The CMap study aims to construct large libraries of drug and gene signatures and provides a pattern-matching tool that detects signature similarities in order to establish a relationship between disease and therapeutic MoA. The libraries were used to design the method that compares gene signatures to diseases in the database and predict the connection; the MoA. Due to the ability of finding connections and similarities between the genes, disease and drugs, the results are termed connectivity maps. The database consists of 1309 diverse bioactive compounds on four different cell lines, where nearly 800 of the compounds are currently available in the market.17,18 Another study based on the CMap data was carried out by Iorio et al., where they developed an automated approach to exploit the similarity in gene expression profiles following drug treatment. A drug network was constructed in order to relate compounds based upon gene expression ranking from the CMap tool. The drug MoA was determined based upon the collective population3 Khan et al. and the hypothesis that chemical structures of drugs (encoded in 3D) impact the drug response. This resulted in specific patterns of gene expression, which established a statistical relationship between the occurrences of patterns in both chemical and biological space.19 The work of Gardner et al. shows that Genetic Networks and MoA of compounds could be interpreted by gene expression profiles to study the SOS pathway in Escherichia coli.20
Iskar et al. used the CMap data to analyse drug-induced differential gene expression of drug targets in three cell lines. Different sets of drug features, such as chemical similarity and Anatomical Therapeutic Chemical (ATC, based on therapeutic and chemical properties of the compound MoA), were used to show that homogeneous gene expression profiles were reliable with mean centring. The chemical structural similarity, measured by the tanimoto coefficient, indicated that coefficients greater than 0.85 show similar biological responses and tend to have similar gene expression profiles. The same is also seen with compounds that share the same ATC code. Furthermore, Iskar et al. quantified the concept of a feedback loop using computationally normalized data and scoring methods applicable to gene expression readouts. From the Search Tool for Interactions of Chemicals (STITCH), 4849 CMap arrays and 40![[thin space (1/6-em)]](https://www.rsc.org/images/entities/char_2009.gif) 656 drug target association provided 1290 drug-target relations.21,22 The studies also showed that nearly 8% of the drug-induced targets were differentially regulated. They also identified unknown drug-induced target expression changes, some of which could be linked to the development of drug tolerance in patients.6,23
656 drug target association provided 1290 drug-target relations.21,22 The studies also showed that nearly 8% of the drug-induced targets were differentially regulated. They also identified unknown drug-induced target expression changes, some of which could be linked to the development of drug tolerance in patients.6,23
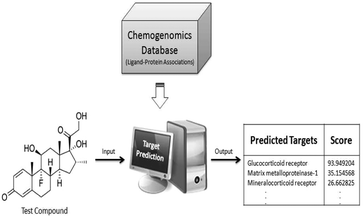
In our study, we propose a new approach which aims to link chemical space to protein target and gene expression space, thus providing a better insight into the MoA of compound clusters. To achieve this goal, there is a need for additional data from which the link between compounds and protein target space can be formed. Public chemogenomics databases such as ChEMBL and PubChem contain large amounts of bioactivity data that aid in machine learning approaches. These approaches extrapolate from knowledge to classify new and orphan ligands for potential protein targets, or off-targets, based upon the similarity of the chemical structures. The target prediction algorithm based upon the Nave Bayesian classifier was employed to predict probable protein targets for compounds without target information (Fig. 1).24,25 The resulting prediction provides each test compound with probable protein targets and their respective scores, representing the likelihood of binding to 477 protein targets.25,26 Target prediction approaches have been recently applied in a variety of areas,27 such as the elucidation of MoA of compounds used in traditional medicine (including ayurvedic and Chinese medicine28) and are also used in examining ADR.29 However, to the best of our knowledge, this is the first study employing in silico target prediction in the context of gene expression data analysis.
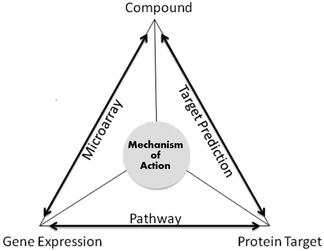
In addition, protein targets do not influence gene expression changes directly; they work through signalling cascades. Pathway databases provide information for linking genes and protein targets. Databases such as KEGG and GO have been used in the study to rationalise the findings.30 Repositories (KEGG and GO) have information relating to a wide range of organisms, which makes it flexible enough to integrate information from different databases and thus to study the functionality of recently discovered genes.31 As shown in Fig. 2, the MoA relationships were established in the following way; compound and gene expression via microarray data, compound and protein target via the target prediction algorithm and protein target and gene expression (CMap) via pathway information. Hence, for a given gene expression readout without knowledge of the protein targets modulated, our approach gives an understanding into the MoA of the compounds. By studying three particular clusters benzoquinone antineoplastic antibiotics, antipsychotic drugs and antidiabetic and anti-inflammatory drugs, we were able to find evidence of compounds perturbing certain genes and proteins thus triggering one or more pathways. Hence, giving insights into the possible MoA of the compounds.
2 Materials and methods
2.1 Gene expression data
2.2 Target prediction data
In this equation, the probability of a compound belonging to class ω given descriptor f is calculated. P(C = ω) is the priori probability of class ω and P(D = f) is a priori probability of the features, f. P(D = f|C = ω), is the key value in this equation, which is the likelihood of the feature f given the class ω. This probability is estimated by the NB classifier from the training set (discussed below), which assumes that the features are independent of each other for a given class. It has been observed before that the NB classifier is still an effective classifier in cases where features are correlated. In machine learning practices, a training set is employed for the classifier to learn from the examples and make predictions for the unseen dataset; the test set. The classifier is trained on a large benchmark dataset of bioactive compounds retrieved from the publicly available ChEMBL database, which is a repository of small bio-active molecules extracted from scientific literature. The training dataset covers 477 human protein targets with around 190![[thin space (1/6-em)]](https://www.rsc.org/images/entities/char_2009.gif) 000 protein–ligand associations, based upon the reported bioactivities (Ki/Kd/IC50/EC50) being equal or better than 10 μM with a confidence score of 8 or 9. These rules for extracting compounds ensured reliable compound-target associations for training the model. The target prediction algorithm performance was evaluated by 5-fold cross validation.26
000 protein–ligand associations, based upon the reported bioactivities (Ki/Kd/IC50/EC50) being equal or better than 10 μM with a confidence score of 8 or 9. These rules for extracting compounds ensured reliable compound-target associations for training the model. The target prediction algorithm performance was evaluated by 5-fold cross validation.26
2.3 Clustering of compounds
The first stage of analysis comprises the clustering of compounds into groups exhibiting a high degree of both intra-cluster similarity and inter-cluster dissimilarity, according to the target prediction scores. The distance between compounds was based upon the Tanimoto coefficient, which is a widely used and well-established distance measure for binary values.35 Our implementation is an agglomerative hierarchical clustering approach. Each compound is absorbed into increasingly large clusters until the dataset is expressed as a single cluster composed of all compounds. The previously generated binary profile matrix was then used to compute the similarity between each compound bioactivity profile. The hierarchical clustering method employed here generates strictly nested structures, which can be presented graphically using dendrograms.2.4 Feature selection
Feature selection was performed by applying Fisher's exact test, target-by-target, with the given cluster of compounds as one group and the rest of compounds as the other group. To integrate the gene expression data in the analysis, genes that were regulated by a particular cluster of compounds of interest were chosen.36 The Linear Models for Microarray Data (Limma) method was used to assess differential expression.37,38The Benjamini–Hochberg false discovery rate (BH-FDR) method was used to adjust for multiplicity. Protein targets and genes were ranked based upon their adjusted p-values.39
2.5 Pathway analysis
Once the lists of genes and protein targets had been obtained, a pathway analysis was conducted in order to interpret the biological function of the selected subset of genes/protein targets.3 Results and discussion
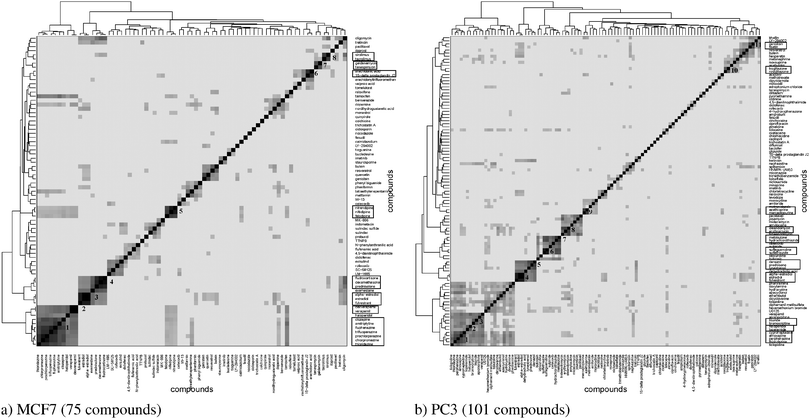
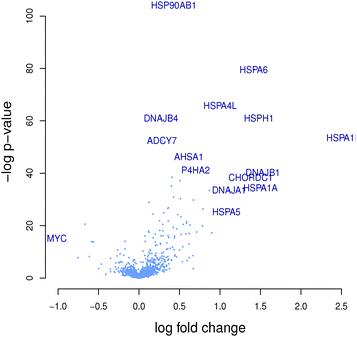
The hierarchical clustering of compounds according to the similarity of their target prediction profiles, based upon the 477 ChEMBL targets, is presented in Fig. 3 for the MCF7 and PC3 cell lines. Several interesting target-based compound clusters (with Tanimoto coefficient > 0.5) are identified in each cell line; 8 from MCF7 and 11 from PC3 (numbered in their respective heatmaps). The target prediction data depends upon the structural make-up of the compounds; hence a compound cluster observed in one cell line will also hold for another line, given that all member compounds are present in both cell lines. This is the case for cluster 3 of MCF7 and cluster 4 of PC3, which contain the same set of compounds; estradiol, alpha-estradiol and fulvestraat. The number of predicted targets found for each compound present in MCF7 and PC3 cell lines is shown in Fig. S1 (ESI†).This study hypothesises that compounds stimulating similar targets will also trigger similar genes and pathways. Each compound set is expected to be associated with a number of genes (differentially expressed between the subset of compounds in the cluster and the rest of the compounds in the set). In this paper, heatmaps and volcano plots are used for the visualisation of predicted active protein targets and differentially expressed genes, respectively, for a given compound cluster of interest.
In the next step, pathway analysis is used to deduce the MoA of the compound cluster. Many statistical approaches have been developed for pathway analysis.45 For the analysis presented in this paper, two approaches have been used; the first is a pathway-oriented approach in which KEGG and GO pathways are retrieved for the gene and protein target sets for sub-clusters of interest and common pathways are studied; and the second is gene set enrichment analysis using MLP in which the focus is on coordinated differential expression of a set of functionally related genes.
This analysis flow is illustrated for 3 of the 19 identified clusters in the following sections. Results for the other homogeneous target-prediction-based sub-clusters are summarised in Tables S1 for MCF7 and S2 for PC3 (ESI†). The MoA for 6 of the 8 MCF7 clusters and 6 of the 11 PC3 clusters, are established using our integrated approach.
3.1 Benzoquinone antineoplastic antibiotic
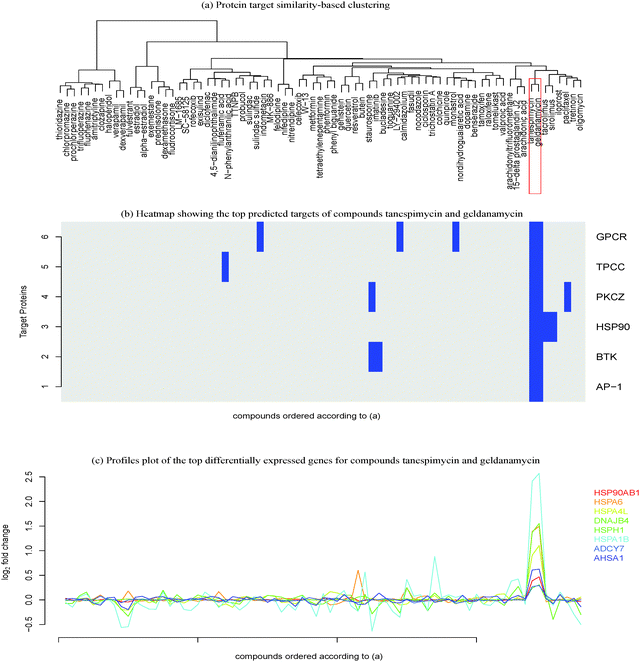
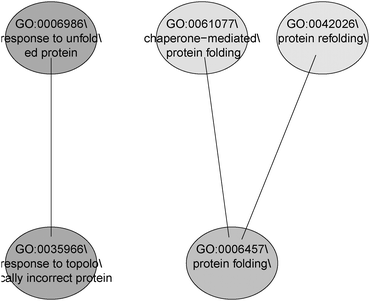
In the studied cluster, the pathway “response to the unfolded protein” (GO:006986) was found to be an overlapping pathway involving the predicted protein target heat shock protein HSP90 alpha and the genes HSP90AB1, HSPA6, HSPA4L, DNAJB4, HSPA1B and DNAJB1. Literature has also shown that HSP90 inhibition is associated with the activation of unfolded protein response. Moreover, the compound geldanamycin is a known inhibitor of HSP90, thus modulating the unfolded protein response.49
Similarly, the overlap between HSP protein and the genes HSP90B1, HSPA1B, HSPA1A and HSP90AA1 show response to the KEGG pathway “antigen processing and presentation”. The genes and proteins in the overlap are known to be involved in these pathways (Table S1, ESI†). A study carried out by Albert50 also supports our finding that HSP plays a role in antigen processing and presentation, where these proteins are released during cell death in order to bind to cell surface receptors of the antigen-presenting cells (Table 1).
| Pathway | Target | Genes |
|---|---|---|
| Response to unfolded protein | Heat shock protein 90 alpha | HSP90B1 |
| HSPA6 | ||
| HSPA4L | ||
| DNAJB4 | ||
| HSPA1B | ||
| Antigen processing and presentation | Heat shock protein 90 alpha | HSP90B1 |
| HSPA1B | ||
| HSPA1A | ||
| HSP90AA1 | ||
![[thin space (1/6-em)]](https://www.rsc.org/images/entities/b_char_2009.gif) p-value (MLP) method.
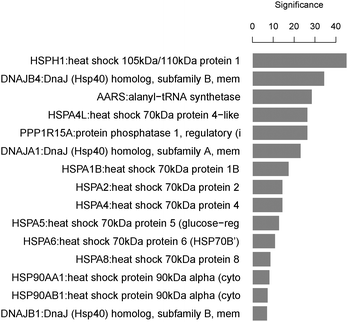
GO and KEGG public pathway databases lack updated annotations from the literature.51 MLP analysis bridges this gap by identifying significantly affected biological processes or gene sets consisting of functionally related genes. The top 5 set of significant GO terms according to their structure in the ontology are displayed in Fig. 6. The MLP results agree with those from the pathway search and literature on the pathway “response to unfolded protein”, which is on the top gene set in the analysis.49 The pathway search provides information on known existing gene-pathway links, whereas MLP analysis shows statistically enriched pathways that are significant (with or without available literature evidence). While the pathway search makes use of top differentially expressed genes, providing 5 genes linked to this pathway, the MLP analysis can provide an enriched set of genes biologically linked through the “response to unfolded protein” pathway. Using the LIMMA p-values as the input, the HSP and DNAJ-related genes are shown to dominate this gene set (Fig. 7).
p-value (MLP) method.
GO and KEGG public pathway databases lack updated annotations from the literature.51 MLP analysis bridges this gap by identifying significantly affected biological processes or gene sets consisting of functionally related genes. The top 5 set of significant GO terms according to their structure in the ontology are displayed in Fig. 6. The MLP results agree with those from the pathway search and literature on the pathway “response to unfolded protein”, which is on the top gene set in the analysis.49 The pathway search provides information on known existing gene-pathway links, whereas MLP analysis shows statistically enriched pathways that are significant (with or without available literature evidence). While the pathway search makes use of top differentially expressed genes, providing 5 genes linked to this pathway, the MLP analysis can provide an enriched set of genes biologically linked through the “response to unfolded protein” pathway. Using the LIMMA p-values as the input, the HSP and DNAJ-related genes are shown to dominate this gene set (Fig. 7).
The MLP method therefore provides statistically significant genes and also the significance of each gene in the pathway of interest. The gene set enrichment analysis is a good start when there is limited pathway information, in understanding the MoA of compounds.
3.2 Antipsychotic drugs
A cluster based on the MCF7 cell line consists of well-known antipsychotic drugs (amitriptyline, clozapine, thioridazine, chlorpromazine, trifluoperazine, prochlorperazine and fluphenazine), which share the predicted protein targets muscarinic, histamine, dopamine and adrenergic receptors and cytochrome P450 2D6 (Fig. S3, ESI†). Antipsychotics drugs are known to be promiscuous therefore identifying selective protein targets are difficult.52 Fig. S2 (ESI†) displays the top genes regulated by the compounds which include genes INSIG1, IDI1, SQLE, MSMO1, etc. The protein target CYP2D6, a member of the enzyme family Cytochromes P450 (CYP), is known to metabolise drugs53 and to play a key role in the synthesis of steroid, cholesterol and prostacyclins.54,55 Literature studies have shown that CYP2D6 greatly influences the metabolism of antipsychotics drugs.56 Pathway analysis information was also added to relate the MoA of the antipsychotics. A search of an overlapping pathway was executed on the antipsychotic cluster, where genes INSIG-1, LDLR and protein target CYP2D6 were observed to overlap with “steroid metabolic process pathway”. This observation complies with the study by Polymeropoulos et al., in which it was shown that genes INSIG-1 and LDLR were up-regulated by antipsychotic drugs that also influenced the steroid biosynthesis.57 While these genes show significance for the antipsychotic drugs, they remain unperturbed for the other compound sub-clusters. The neighbouring compound cluster (verapamil and dexverapamil) of calcium channel binders are known to have antipsychotic effects, thus large numbers of similar targets are predicted.58,59 The genes (IDI1, SQLE, MSMO1, INSIG1, MNT, SRSF7, HMGCS1 and CCR1) also have similar gene perturbation on this sub-cluster.Furthermore, MLP indicated that the “steroid metabolic process” pathway was significantly enriched in the antipsychotic sub-cluster. Enrichment was also observed for the pathways “cholesterol biosynthesis process”, “sterol biosynthesis process”, “cholesterol metabolic process”, “sterol metabolic process” and “steroid biosynthesis process” (Fig. S4, ESI†). The gene Dhcr24, as shown in the Fig. S5 (ESI†), is predicted to be highly significant on the “cholesterol biosynthetic process” and is known to code for the protein cholesterol-synthesizing enzyme seladin-1, which agrees with the study by Crameri et al.60,61 Another gene in the list, G6PD, was also known to regulate the pathway through protein sterol regulatory element-binding proteins (SREBP).62 Studies by Iskar et al. have shown that the genes LDLR, INSIG1, IDI1, SQLE and HMGCS1 are responsible for the “cholesterol metabolic process”23 (Fig. S5, ESI†), which is in accordance with our results. As stated by Polymeropoulos et al. “activation of antipsychotics by genes associated with lipid homeostasis is not just a common off-target effect of these drugs but rather the common central mechanism by which they achieve their antipsychotic activity.”57
In the compounds clustered based upon protein target similarity, compounds verepamil and dexverepamil shared protein targets such as the hydroxytryptamine receptor, the adrenergic receptor, the histamine H1 receptor, the dopamine receptor and the muscarinic acetylcholine receptor M4. Although they share similar protein targets, the intensity of gene expression profiles were different indicating that the method can clearly distinguish between close sub-clusters and thus suggesting differences in their MoA. SREBP and cholesterol-synthesizing enzyme seladin-1 were not predicted by the target prediction algorithm, as they were out of the applicability domain.
3.3 Antidiabetic and anti-inflammatory drugs
A PC3 cell line cluster (Table S2, ESI†) comprising of thiazolidinediones (rosiglitazone and troglitazone drugs) was found to have both antidiabetic and anti-inflammatory effects.63,64In silico target prediction algorithm indicated that these compounds were likely to bind to the peroxisome proliferator activated receptor gamma (PPAR-gamma), peroxisome proliferator activated receptor alpha (PPAR-alpha) and acyl CoA desaturase. Spiegelman has shown the MoA of antidiabetic thiazolidinediones to induce activation of PPAR gamma and thus regulate genes involved in glucose and lipid metabolism.65 Gene expression profiles of genes FABP4 and ANGPTL4 have fold changes of 3 and 1 respectively. Studies have shown that antidiabetic thiazolidinediones are ligands for the nuclear receptor PPAR, which exert their anti-hyperglycaemic effects by regulation of the PPAR responsive genes and also that gene FABP4 is rapidly up-regulated upon PPAR gamma ligand administration; this confirms our finding of this gene showing high fold change.15,66 A study by Pal et al. showed that the gene ANGPTL4 is responsible for epidermal differentiation mediated via the PPAR protein.67During overlap pathway analysis, genes FABP4 and ANGPTL4 were found to share pathway “PPAR signalling” with proteins PPAR-gamma, PPAR-alpha and acyl CoA desaturase. Confirming our observation, antidiabetic thiazolidinediones in pathway hsa03320 of the KEGG database induce “PPAR signaling pathway” by perturbing genes FABP4 and ANGPTL4 and PPAR proteins. This indicates that the MoA of antidiabetic thiazolidinediones involves PPAR signalling.
There was overlap of the pathway “induction of apoptosis” with gene PRKCD and protein target PPAR-gamma. In the study by Heath2008, thiazolidinediones were shown to have potential for inducing apoptosis in cancer cells by binding to protein PPAR-gamma.68 In our study on thiazolidinediones, we also observed that gene PRKCD is down-regulated substantially when compared to other compounds in the dataset showing selectivity for this particular gene. Hence suggesting gene PRKCD to be involved in the MoA for thiazolidinediones.
3.4 Other compound clusters
Of the 8 and 11 compound clusters identified in the respective MCF7 and PC3 cell lines, our approach was able to link the genes and targets via pathway(s) for 6 compound clusters in each cell line. Some of the links (compound-genes, compound-target and genes-pathway-target), however, lacked literature support (Tables S1 for MCF7 and S2 for PC3, ESI†). The target prediction similarity data also produces many singletons, which are compounds that do not share any targets with remaining compounds in the set, thus providing a limited number of clusters to be investigated.4 Conclusions
Combining target-based compound similarity with corresponding gene expression information provides a better understanding of compound cluster behaviour, both on the bioactivity level and on the transcriptional level. Ideally, any target-driven compound cluster can be investigated using this analysis flow, but it is more logical to prioritize clusters with compounds that share at least half of the targets. This compound cluster selection requires choosing an arbitrary cut-off for the Tanimoto similarity score, which is 0.5 in this case. Studies by Hert et al. and Martin et al. show mean nearest neighbour similarity across different activity classes are between 0.3 and 0.7, and therefore 0.5 is a reasonable value to describe similarity.69,70 Increasing this cut-off value would mean filtering out other compound clusters for the next level of analysis, while decreasing this value would allow for more compound clusters to be analysed. However, in practice, the choice largely depends on which compound sets are of most interest to the researcher.Analysis was performed upon all selected homogeneous target-driven compound clusters, but focus was placed on the MoA of three compound clusters; benzoquinone antineoplastic antibiotics, antipsychotic drugs and antidiabetic and anti-inflammatory drugs.
Analysis of the benzoquinone antineoplastic antibiotic drug sub-cluster gave insight into their MoA through the HSP genes and the HSP90-alpha protein. Further pathway study directed us to the underlying MoA though “antigen processing and presentation” and “response to the unfolded protein”. In the sub-cluster study of antipsychotic drugs, our integrated approach was able to narrow down the MoA of the compound to protein target CYP2D6 and genes INSIG-1 and LDLR. In addition, the pathway analysis confirmed the MoA through “steroid metabolic process pathway”. Furthermore, in the antidiabetic and anti-inflammatory drugs sub-cluster, the MoA of the compounds was found to involve genes FABP4 and ANGPTL4 and protein PPAR and pathway analysis confirmed “PPAR signalling” as being involved in the underlying MoA of these compounds. All these analysis were confirmed by literature evidence. Note that these studied compound clusters (antipsychotic drugs, antidiabetic and anti-inflammatory drugs) along with other CMap compounds, were selected to represent a broad range of activities not necessarily related to oncology, and were profiled only in cancer cell lines due to practical limitations. An assessment of the extent of the results to be cell line specific is therefore not feasible here.
Although a large amount of information is present in public databases, KEGG and GO lack annotations.51 MLP analysis thus provided the statistical information required to enrich genes in the pathways of interest. This approach enabled us to gain valuable insight into known MoA of compounds and also provides a means by which new (or previously unestablished) MoA can be discovered.
This paper therefore presents a pragmatic approach to dataset integration, involving relatively few stages of statistical analysis. The method was designed to capture the different associations (if they exist) between compounds, genes and targets, in order to gain insight regarding the MoA of compounds. This approach is not only limited to the use of gene expression and target prediction data, however; the technique can be more generally used to find links between two datasets measured against the same set of observations. The technique may also be improved by integrating more sophisticated similarity functions, which could more accurately predict the clustering of compounds based upon the affinity to common targets and thus provide an even more powerful predictive tool.
Acknowledgements
We would like to gratefully acknowledge the Institute for the Promotion of Innovation by Science and Technology in Flanders (IWT) for providing us with the O&O grant 100988: QSTAR – Quantitative structure transcriptional activity relationship. We would like to thank IWT and Janssen Pharmaceutica NV for jointly funding PhD projects of Aakash Chavan Ravindranath and Nolen Perualila-Tan. Ziv Shkedy and Nolen Perualila-Tan gratefully acknowledge the support from the IAP Research Network P7/06 of the Belgian State (Belgian Science Policy). Georgios Drakakis thanks Lilly and EPSRC for funding his PhD. Sonia Liggi and Daniel Mason thanks Unilever for funding. Dr Andreas Bender thanks Unilever for funding and the European Research Council for a Starting Grant (ERC-2013-StG-336159 MIXTURE).References
- M. L. MacDonald, J. Lamerdin, S. Owens, B. H. Keon, G. K. Bilter, Z. Shang, Z. Huang, H. Yu, J. Dias and T. Minami, et al. , Nat. Chem. Biol., 2006, 2, 329–337 CrossRef CAS PubMed.
- S. Tian, Y. Li, D. Li, X. Xu, J. Wang, Q. Zhang and T. Hou, J. Chem. Inf. Model., 2013, 53, 1787–1803 CrossRef CAS PubMed.
- F. Iorio, R. Tagliaferri and D. di Bernardo, J. Comput. Biol., 2009, 16, 241–251 CrossRef CAS PubMed.
- Y. Feng, T. J. Mitchison, A. Bender, D. W. Young and J. A. Tallarico, Nat. Rev. Drug Discovery, 2009, 8, 567–578 CrossRef CAS PubMed.
- D. W. Young, A. Bender, J. Hoyt, E. McWhinnie, G.-W. Chirn, C. Y. Tao, J. A. Tallarico, M. Labow, J. L. Jenkins and T. J. Mitchison, et al. , Nat. Chem. Biol., 2007, 4, 59–68 CrossRef PubMed.
- M. Iskar, M. Campillos, M. Kuhn, L. J. Jensen, V. van Noort and P. Bork, PLoS Comput. Biol., 2010, 6, e1000925 Search PubMed.
- M. Maienschein-Cline, J. Zhou, K. P. White, R. Sciammas and A. R. Dinner, Bioinformatics, 2011, 28, 206–213 CrossRef PubMed.
- D. N. Arnosti and M. M. Kulkarni, J. Cell. Biochem., 2005, 94, 890–898 CrossRef CAS PubMed.
- A. L. Tarca, R. Romero and S. Draghici, Am. J. Obstet. Gynecol., 2006, 195, 373–388 CrossRef CAS PubMed.
- D. Amaratunga, J. Cabrera and Z. Shkedy, Exploration and Analysis of DNA Microarray and Other High-Dimensional Data, Wiley, 2nd edn, 2014 Search PubMed.
- P. Breyne, R. Dreesen, B. Cannoot, D. Rombaut, K. Vandepoele, S. Rombauts, R. Vanderhaeghen, D. Inzé and M. Zabeau, Mol. Genet. Genomics, 2003, 269, 173–179 CAS.
- T. D. Gallardo, G. B. John, L. Shirley, C. M. Contreras, E. A. Akbay, J. M. Haynie, S. E. Ward, M. J. Shidler and D. H. Castrillon, Genetics, 2007, 177, 179–194 CrossRef CAS PubMed.
- X. Li, S. Rao, Y. Wang and B. Gong, Nucleic Acids Res., 2004, 32, 2685–2694 CrossRef CAS PubMed.
- D. Nikolova, H. Zembutsu, T. Sechanov, K. Vidinov, L. Kee, R. Ivanova, E. Becheva, M. Kocova, D. Toncheva and Y. Nakamura, Oncol. Rep., 2008, 20, 105–121 CAS.
- M. Kapushesky, T. Adamusiak, T. Burdett, A. Culhane, A. Farne, A. Filippov, E. Holloway, A. Klebanov, N. Kryvych and N. Kurbatova, et al. , Nucleic Acids Res., 2011, 40, D1077–D1081 CrossRef PubMed.
- A. Brazma, H. Parkinson, U. Sarkans, M. Shojatalab, J. Vilo, N. Abeygunawardena, E. Holloway, M. Kapushesky, P. Kemmeren, G. G. Lara, A. Oezcimen, P. Rocca-Serra and S.-A. Sansone, Nucleic Acids Res., 2003, 31, 68–71 CrossRef CAS PubMed.
- J. Lamb, E. D. Crawford, D. Peck, J. D. Modell, I. C. Blat, M. J. Wrobel, J. Lerner, J.-P. Brunet, A. Subramanian, K. N. Ross, M. Reich, H. Hieronymus, G. Wei, S. Armstrong, S. J. Haggarty, P. A. Clemons, R. Wei, S. A. Carr, E. S. Lander and T. R. Golub, Science, 2006, 313, 1929–1935 CrossRef CAS PubMed.
- J. Lamb, Nat. Rev. Cancer, 2007, 7, 54–60 CrossRef CAS PubMed.
- S. A. Khan, A. Faisal, J. P. Mpindi, J. A. Parkkinen, T. Kalliokoski, A. Poso, O. P. Kallioniemi, K. Wennerberg and K. Samuel, BMC Bioinf., 2012, 13, 1471–2105 CrossRef PubMed.
- T. S. Gardner, D. di Bernardo, D. Lorenz and J. J. Collins, Science, 2003, 301, 102–105 CrossRef CAS PubMed.
- M. Kuhn, C. von Mering, M. Campillos, L. J. Jensen and P. Bork, Nucleic Acids Res., 2008, 36, D684–D688 CrossRef CAS PubMed.
- M. Kuhn, D. Szklarczyk, A. Franceschini, M. Campillos, C. von Mering, L. J. Jensen, A. Beyer and P. Bork, Nucleic Acids Res., 2010, 38, D552–D556 CrossRef CAS PubMed.
- M. Iskar, G. Zeller, P. Blattmann, M. Campillos, M. Kuhn, K. H. Kaminska, H. Runz, A.-C. Gavin, R. Pepperkok, V. van Noort and P. Bork, Mol. Syst. Biol., 2013, 9, 662 CrossRef CAS PubMed.
- T. Klabunde, Br. J. Pharmacol., 2007, 152, 5–7 CrossRef CAS PubMed.
- A. Koutsoukas, B. Simms, J. Kirchmair, P. J. Bond, A. V. Whitmore, S. Zimmer, M. P. Young, J. L. Jenkins, M. Glick, R. C. Glen and A. Bender, J. Proteomics, 2011, 74, 2554–2574 CrossRef CAS PubMed.
- A. Koutsoukas, R. Lowe, Y. Kalantarmotamedi, H. Y. Mussa, W. Klaffke, J. B. O. Mitchell, R. C. Glen and A. Bender, J. Chem. Inf. Model., 2013, 53, 1957–1966 CrossRef CAS PubMed.
- B. Chen, K. J. McConnell, N. Wale, D. J. Wild and E. M. Gifford, Bioinformatics, 2011, 27, 3044–3049 CrossRef CAS PubMed.
- F. Mohd Fauzi, A. Koutsoukas, R. Lowe, K. Joshi, T.-P. Fan, R. C. Glen and A. Bender, J. Chem. Inf. Model., 2013, 53, 661–673 CrossRef CAS PubMed.
- M. Takarabe, M. Kotera, Y. Nishimura, S. Goto and Y. Yamanishi, Bioinformatics, 2012, 28, i611–i618 CrossRef CAS PubMed.
- H. Ogata, S. Goto, K. Sato, W. Fujibuchi, H. Bono and M. Kanehisa, Nucleic Acids Res., 1999, 27, 29–34 CrossRef CAS.
- L. du Plessis, N. Skunca and C. Dessimoz, Briefings Bioinf., 2011, 12, 723–735 CrossRef CAS PubMed.
- S. Hochreiter, D.-A. Clevert and K. Obermayer, Bioinformatics, 2006, 22, 943–949 CrossRef CAS PubMed.
- W. Talloen, D. Clevert, S. Hochreiter, D. Amaratunga, L. Bijnens, S. Kass and H. Göhlmann, Bioinformatics, 2007, 23, 2897–2902 CrossRef CAS PubMed.
- G. V. Paolini, R. H. B. Shapland, W. P. van Hoorn, J. S. Mason and A. L. Hopkins, Nat. Biotechnol., 2006, 24, 805–815 CrossRef CAS PubMed.
- P. Willett, J. Barnard and G. Downs, J. Chem. Inf. Model., 1998, 38, 983–996 CrossRef CAS.
- R. A. Fisher, J. Roy. Statist. Soc., 1922, 85, 87–94 CrossRef.
- G. K. Smyth, J. Michaud and H. S. Scott, Bioinformatics, 2005, 21, 2067–2075 CrossRef CAS PubMed.
- G. K. Smyth, Stat. Appl. Genet. Mol. Biol., 2004, 3, 397–420 Search PubMed.
- Y. Benjamini and Y. Hochberg, J. Roy. Statist. Soc. Ser. B, 1995, 57, 289–300 Search PubMed.
- S. Liggi, G. Drakakis, A. E. Hendry, K. M. Hanson, S. C. Brewerton, G. N. Wheeler, M. J. Bodkin, D. A. Evans and A. Bender, Mol. Inf., 2013, 32, 1009–1024 CrossRef CAS.
- S. Liggi, G. Drakakis, A. Koutsoukas, I. CortesCiriano, P. MartnezAlonso, T. E. Malliavin, A. Velazquez-Campoy, S. C. Brewerton, M. J. Bodkin, D. A. Evans, R. C. Glen, J. A. Carrodeguas and A. Bender, Future Med. Chem., 2013 DOI:10.1186/1758-2946-5-S1-P15.
- N. Raghavan, D. Amaratunga, J. Cabrera, A. Nie, J. Qin and M. McMillian, J. Comput. Biol., 2006, 13, 798–809 CrossRef CAS PubMed.
- N. Raghavan, A. De Bondt, W. Talloen, D. Moechars, H. W. H. Göhlmann and D. Amaratunga, Bioinformatics, 2007, 23, 3032–3038 CrossRef CAS PubMed.
- D. Lin, Z. Shkedy, D. Yekutieli, D. Amaratunga and L. Bijnens, Modeling Dose-response Microarray Data in Early Drug Development Experiments Using R, Order Restricted Analysis of Microarray Data, Springer, 2012 Search PubMed.
- H. Göhlmann and W. Talloen, Gene Expression Studies Using Affymetrix Microarrays, Chapman and Hall/CRC, 2009, pp. 1314–1315 Search PubMed.
- S. Modi, A. Stopeck, H. Linden, D. Solit, S. Chandarlapaty, N. Rosen, G. D'Andrea, M. Dickler, M. E. Moynahan, S. Sugarman, W. Ma, S. Patil, L. Norton, A. L. Hannah and C. Hudis, Clin. Cancer Res., 2011, 17, 5132–5139 CrossRef CAS PubMed.
- T. Taldone, A. Gozman, R. Maharaj and G. Chiosis, Curr. Opin. Pharmacol., 2008, 8, 370–374 CrossRef CAS PubMed.
- B. Chen, W. H. Piel, L. Gui, E. Bruford and A. Monteiro, Genomics, 2005, 86, 627–637 CrossRef CAS PubMed.
- E. L. Davenport, H. E. Moore, A. S. Dunlop, S. Y. Sharp, P. Workman, G. J. Morgan and F. E. Davies, Blood, 2007, 110, 2641–2649 CrossRef CAS PubMed.
- M. L. Albert, Nat. Rev. Immunol., 2004, 4, 223–231 CrossRef CAS PubMed.
- P. Khatri, M. Sirota and A. J. Butte, PLoS Comput. Biol., 2012, 8, e1002375 CAS.
- J. Brown and Y. Okuno, Chem. Biol., 2012, 19, 23–28 CrossRef CAS PubMed.
- T. Lynch and A. Price, Am. Fam. Physician, 2007, 76, 391–396 Search PubMed.
- D. W. Nebert and D. W. Russell, Lancet, 2002, 360, 1155–1162 CrossRef CAS.
- J. B. Schenkman, J. Steroid Biochem. Mol. Biol., 1992, 43, 1023–1030 CrossRef CAS.
- P. Dorado, R. Berecz, E. Peas-Lled, M. Cceres and A. Llerena, Curr. Drug Targets, 2006, 7, 1671–1680 CrossRef CAS.
- M. H. Polymeropoulos, L. Licamele, S. Volpi, K. Mack, S. N. Mitkus, E. D. Carstea, L. Getoor, A. Thompson and C. Lavedan, Schizophr. Res., 2009, 108, 134–142 CrossRef PubMed.
- B. Umukoro, Afr. J. Med. Med. Sci., 2010, 39, 61–66 Search PubMed.
- G. Palit, A. Kalsotra, R. Kumar, C. Nath and M. P. Dubey, Eur. J. Pharmacol., 2001, 421, 139–144 CrossRef.
- A. Crameri, E. Biondi, K. Kuehnle, D. Lütjohann, K. M. Thelen, S. Perga, C. G. Dotti, R. M. Nitsch, M. H. Mohajeri and M. D. Ledesma, EMBO J., 2006, 25, 432–443 CrossRef CAS PubMed.
- A. Wechsler, A. Brafman, A. Faerman, I. Björkhem and E. Feinstein, Science, 2003, 302, 2087 CrossRef CAS PubMed.
- J. D. Horton, J. L. Goldstein and M. S. Brown, J. Clin. Invest., 2002, 109, 1125–1131 CrossRef CAS.
- N. Mahindroo, C. F. Huang, Y. H. Peng, C. C. Wang, C. C. Liao, T. W. Lien, S. K. Chittimalla, W. J. Huang, C. H. Chai, E. Prakash, C. P. Chen, T. A. Hsu, C. H. Peng, I. L. Lu, L. H. Lee, Y. W. Chang, W. C. Chen, Y. C. Chou, C. T. Chen, C. M. V. Goparaju, Y. S. Chen, S. J. Lan, M. C. Yu, X. Chen, Y. S. Chao, S. Y. Wu and H. P. Hsieh, J. Med. Chem., 2005, 48, 8194–8208 CrossRef CAS PubMed.
- L. G. D. Fryer, A. Parbu-Patel and D. Carling, J. Biol. Chem., 2002, 277, 25226–25232 CrossRef CAS PubMed.
- B. M. Spiegelman, Diabetes, 1998, 47, 507–514 CrossRef CAS.
- I. Szatmari, A. Pap, R. Ruhl, J.-X. Ma, P. A. Illarionov, G. S. Besra, E. Rajnavolgyi, B. Dezso and L. Nagy, J. Exp. Med., 2006, 203, 2351–2362 CrossRef CAS PubMed.
- M. Pal, M. J. Tan, R.-L. Huang, Y. Y. Goh, X. L. Wang, M. B. Y. Tang and N. S. Tan, PLoS One, 2011, 6, e25377 CAS.
- H. Elrod and S. Sun, PPAR Res., 2008, 704165, DOI:10.1155/2008/704165.
- J. Hert, M. J. Keiser, J. J. Irwin, T. I. Oprea and B. K. Shoichet, J. Chem. Inf. Model., 2008, 48, 755–765 CrossRef CAS PubMed.
- Y. C. Martin, J. L. Kofron and L. M. Traphagen, J. Med. Chem., 2002, 45, 4350–4358 CrossRef CAS PubMed.
Footnotes |
| † Electronic supplementary information (ESI) available. See DOI: 10.1039/c4mb00328d |
| ‡ These authors contributed equally to this work. |
| § http://qstar-consortium.org; see ESI† for the members of the QSTAR Consortium. |
| This journal is © The Royal Society of Chemistry 2015 |

