
 Open Access Article
 This Open Access Article is licensed under a
 Creative Commons Attribution 3.0 Unported Licence
Highly efficient single cell arraying by integrating acoustophoretic cell pre-concentration and dielectrophoretic cell trapping†
Soo Hyeon
Kim‡
ab,
Maria
Antfolk‡
c,
Marina
Kobayashi
ab,
Shohei
Kaneda
ab,
Thomas
Laurell
*cd and
Teruo
Fujii
*ab
aInstitute of Industrial Science, The University of Tokyo, Japan. E-mail: tfujii@iis.u-tokyo.ac.jp; Tel: +81 3 5452 6211
bCREST, Japan Science and Technology Agency, Japan
cLund University, Sweden. E-mail: thomas.laurell@bme.lth.se; Tel: +46 46 222 7540
dDongguk University, South Korea
First published on 6th October 2015
Abstract
To array rare cells at the single-cell level, the volumetric throughput may become a bottleneck in the cell trapping and the subsequent single-cell analysis, since the target cells per definition commonly exist in a large sample volume after purification from the original sample. Here, we present a novel approach for high throughput single cell arraying by integrating two original microfluidic devices: an acoustofluidic chip and an electroactive microwell array. The velocity of the cells is geared down in the acoustofluidic chip while maintaining a high volume flow rate at the inlet of the microsystem, and the cells are subsequently trapped one by one into the microwell array using dielectrophoresis. The integrated system exhibited a 10 times improved sample throughput compared to trapping with the electroactive microwell array chip alone, while maintaining a highly efficient cell recovery above 90%. The results indicate that the serial integration of the acoustophoretic pre-concentration with the dielectrophoretic cell trapping drastically improves the performance of the electroactive microwell array for highly efficient single cell analysis. This simple and effective system for high throughput single cell arraying with further possible integration of additional functions, including cell sorting and downstream analysis after cell trapping, has potential for development to a highly integrated and automated platform for single-cell analysis of rare cells.
Introduction
Analysis of rare cells, e.g. circulating tumor cells (CTCs) and circulating fetal cells, holds promise for the diagnosis and prognosis of many cancers, and non-invasive prenatal diagnosis. For instance, counting the number of CTCs in peripheral blood makes it possible to monitor the therapeutic effect of a treatment and to give prognosis without tissue biopsies.1 Microfluidic devices are suitable for sorting and analyzing rare cells and enable processing of complex cellular fluids. Several groups have been developing microfluidic devices for continuous flow-based rare cell isolation using the physical properties,2–6 biochemical properties7,8 or dielectric properties9–11 of rare cells. Although previous methods using microfluidic devices successfully demonstrated separation of rare cells, the separated cells have to be collected and arrayed for downstream analysis. The rare cells should preferably be analyzed at the single-cell level for the improvement of the understanding of cellular heterogeneity, and for clinical applications. For instance, characterization of individual CTCs would help to profile a disseminated tumor at the molecular level, and to further guide diagnostic and therapeutic strategies since CTCs may be shed from different locations within tumors, and even from metastases.12A microfluidic approach has been employed to array single cells using additional forces, i.e. hydrodynamic force,13,14 gravity15 or dielectrophoresis.16 Recently, highly improved single-cell arraying efficiency was realized by optimizing flow profiling.17 However, there are some practical problems of the method – trapped cells can be easily deformed due to a hydrodynamic pressure and microfluidic channels can be easily clogged since the dimension of the channel is comparable with that of the target cells. In order to overcome the drawbacks of the method, we have developed a microfluidic device containing an electroactive microwell array (EMA) for trapping single cells using dielectrophoresis (DEP) followed by on-chip single-cell analysis.18 Although we successfully demonstrated the feasibility of the EMA device for on-chip single-cell analysis,18,19 the main drawbacks of the EMA chip for single cell analysis laid in the difficulty to analyze large sample volumes in a short time period, since the optimal inlet flow rate of the EMA chip was 2 μL min−1. Higher flow velocities in the EMA device prevent efficient trapping of the target cells, yielding a lower cell recovery.
A practical problem on the rare cell analysis is that the isolated target cells are usually suspended in a large sample volume as shown in Table S1 in the ESI.† For instance, collected rare cells, sorted by Dean flow fractionation, were suspended in a 3 times larger volume of buffer.3 In this case, if 10 cells exist in 1 mL of blood sample, 10 cells would be suspended in 3 mL of buffer after isolation. Although centrifugation is widely used to concentrate a sample, centrifugation of a sample with a low cell number will increase the risk of critical sample losses since a pellet of sample is too small to be seen or even no pellet forms at all with such a low number of cells,20 and may induce a possible damage to cell viability21 as well as cell function22 because of the strong centrifugal forces acting on a cell. Moreover, during the sample transfer process from the tube to the device for downstream analysis, the small number of cells could be nonspecifically bound on a surface of a centrifugal tube or a pipet tip.
An effective strategy to overcome this would be to decrease the volume flow rate in the device while maintaining a high flow rate at the inlet of the microsystem. Microfluidic devices have previously been demonstrated to decrease the sample volume using gravity,23 hydrodynamic forces,24,25 electrical forces,26–29 magnetic forces30 and acoustophoresis.31 Although the methods efficiently decrease the volume of the samples, there is a lack of continuous flow-based systems yielding high concentration factors while maintaining a high recovery and throughput.20 Recently, we have developed an acoustofluidic chip to concentrate dilute cells into a smaller volume with concentration factors of several orders of magnitude of dilute samples.20 The chip focuses the cells in a confined liquid volume by utilizing acoustic standing waves formed in the microchannel. The chip allows us to drastically decrease the volume flow rate of the sample, prior to entering the EMA device, by collecting the cells focused in the channel center while discarding the cell-free liquid volume along the channel sides.
Here, we present a novel approach for high throughput arraying of single cells supplemented in a large sample volume by integrating two original microfluidic devices: 1) an acoustofluidic chip for sample pre-concentration and 2) an EMA chip for single-cell arraying. The integration was achieved by directly bonding the sample outlet of the acoustofluidic chip to the inlet of the EMA chip to deliver a focused cell stream into the EMA chip. First, we improved the inherent cell trapping efficiency of the EMA to accommodate trapping of single cells, where the cell trapping efficiency of the older version was 10%.18 The inherent cell trapping efficiency of the EMA was improved up to 98 ± 1.7% for the inlet flow rate of 4 μL min−1 by modifying the geometry of the microwell array, while moderate trapping efficiencies of 64 ± 5.3% and 23 ± 3.8% were observed with the higher flow rates of 10 and 20 μL min−1, respectively, without pre-concentration. Next, the feasibility of the integrated system was demonstrated by arraying diluted DU145 cells, a human prostate cancer cell line, after acoustophoretic pre-concentration. The integrated system showed a good recovery of 96 ± 0.8%, 96 ± 3.7%, 88 ± 6% and 65 ± 13% for the high inlet flow rates of 20, 40, 60 and 100 μL min−1, respectively. We successfully improved sample throughput by implementing an acoustic pre-concentration step prior to entering the EMA chip which allowed a 10-fold increase of the system throughput without any impact on the cell recovery.
Design of the device
Acoustofluidic device
Acoustophoresis utilizes ultrasound standing waves to focus cells and particles into the pressure node or anti-node by the primary acoustic radiation force, Frad, approximated asFrad = 4πa3ϕkyEac![[thin space (1/6-em)]](https://www.rsc.org/images/entities/char_2009.gif) sin(2kyy) sin(2kyy) | (1) |
 | (2) |
In the acoustofluidic chip, dilute cells are focused into the microchannel centre in two dimensions. The wavelength of the ultrasound is matched to the width and height of the microchannel, forming both horizontal and vertical ultrasound standing waves operated at two different frequencies. The two-dimensional focusing is crucial for the ability to obtain high concentration factors. When focusing the cells in two dimensions, they will all be collected in the fastest moving central fluid regime in the laminar flow profile. This ensures a fast transit through the outlet region where the microfluidic channel widens. In this location, the channel width no longer corresponds to the frequency of the applied ultrasound. Instead, other resonance modes and vigorous acoustic streaming zones can be found, yielding unpredictable particle trajectories that divert slower moving particles along the channel walls, from their original trajectory. When two-dimensional focusing (levitation) is active, these artifacts can be efficiently circumvented.20
Electroactive microwell array
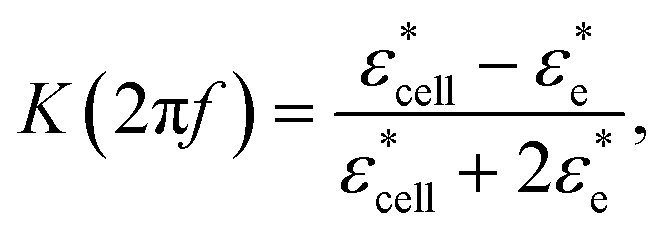
An electroactive microwell array utilizes dielectrophoresis (DEP) to attract the cells to the bottom of the microwells. The time-averaged DEP force, FDEP, acting on a spherical cell of radius a can be approximated as| FDEP = 2πεea3Re[K(2πf)]∇|Ee|2, | (3) |
 | (4) |
To attract the cells into the microwells using DEP, each electroactive microwell has patterned electrodes at the bottom of the microwell. The distance between the electrodes is 10 μm, which is smaller than the diameter of the target cells. A thin insulation layer (4 μm in thickness, made with a negative-type photoresist) was coated on the electrodes to block the electric fields except for the area where the microwells are patterned. The diameter of the microwell is 22 μm. A polydimethylsiloxane (PDMS) microfluidic channel is formed on the EMA substrate for the efficient delivery of target cells.
Integration of the devices
Two original microfluidic devices, the acoustofluidic chip for sample pre-concentraion and the EMA chip for single-cell analysis, were integrated to improve the sample throughput capability (Fig. 1A). For the integration, the sample outlet of the acoustofluidic chip was directly connected with the inlet of the EMA chip by plasma activation of the surfaces and direct bonding of the PDMS-based EMA chip to the glass surface of the acoustofluidic chip. The cells, introduced into the inlet of the acoustofluidic chip, were focused in two-dimensions in the centre of the channel. The main stream of the acoustofluidic chip with the focused cells flowed into the EMA chip and cell-free fractions of the flow stream in the acoustofluidic chip were discarded into the waste outlet. Since only a small fraction of the main stream with cells flowed into the EMA chip (gearing down the flow rate), we could operate the EMA chip at an optimal flow rate (Qo) with respect to the DEP trapping efficiency even at a high inlet flow rate (Qi), which allowed high throughput collection of dilute cell suspensions. The cells flowing into the EMA chip were trapped into the microwells in an array with the DEP force at the single-cell level. | ||
| Fig. 1 Integration of the acoustofluidic chip and the EMA chip. (A) Schematic image of the integration. The target cells introduced from the inlet of the acoustofluidic chip are focused at the center of the channel using ultrasound standing waves. The central stream of the chip with the focused cells flows into the EMA chip. The cells are trapped into the microwell array using DEP in the EMA chip. (B) Photo of the integrated device. The outlet of the acoustofluidic device is directly connected with the inlet of the EMA chip. Scale bar is 4 mm. | ||
Materials and methods
Device fabrication
The EMA chip for single cell trapping was fabricated using the conventional photolithography and etching process. The shape of the electrodes were patterned on a indium tin oxide (ITO) coated glass substrate (GEOMATEC Co., Japan) using a positive-type photoresist (S1813, Shipley Far East Ltd., Japan), followed by etching of ITO by a 0.2 M FeCl3 + 6 M HCl solution for 30 min at room temperature. After that, the substrate was cleaned and rinsed with acetone and isopropyl alcohol to remove the photoresist layer remaining on the substrate. The microwell array structure was fabricated with a negative-type photoresist (SU-8 3005, MicroChem Corp., USA) on top of the patterned ITO electrodes. The microfluidic channel for the microwell array was fabricated using polydimethylsiloxane (PDMS, Silopt 184, Dow Corning Toray, Co. Ltd., Japan) through the standard replica molding process. The height and width of the PDMS microchannel were 50 and 3600 μm, respectively. The PDMS channel and microwell array substrate were exposed to O2 plasma using a reactive ion etching machine (RIE-10NR, Samco Co., Japan) and bonded together.The fluidic channel for acoustophoresis was fabricated on a silicon substrate using photolithography and anisotropic wet etching in KOH (40 g per 100 mL of H2O, 80 °C). A hole for the sample outlet was drilled in the silicon and holes for the inlet and waste outlets were drilled in the glass lid using a diamond drill. The silicon chip was sealed by anodic bonding of the glass lid. The focusing channel was 397 μm wide and 147 μm deep. Since the channel width and height corresponded to half a wavelength of ultrasound at 1.89 MHz and 5.08 MHz, piezoceramic transducers (PZ26, Ferroperm Piezoceramics, Kvistgaard, Denmark) resonant at 2 MHz and 5 MHz were attached by using cyanoacrylate glue (Loctite Super glue, Henkel Norden AB, Stockholm, Sweden) to the front and backside of the chip, respectively.
In order to assemble the microwell array chip with the acoustofluidic chip, each of their surfaces for bonding was activated in an O2 plasma using the reactive ion etching machine. Both were aligned and brought into contact, and spontaneously bonded together without applying any external pressure. Fig. 1B shows the combined device, where the outlet of the acoustofluidic device is directly connected with the inlet of the EMA chip.
Experimental setup
The integrated device was placed on the x–y translational stage located on an inverted microscope (IX 71, Olympus, Japan). The cells were monitored with a digital CCD camera (ORCA-R2, Hamamatsu Photonics, Japan) installed on the microscope. The two transducers bonded on the acoustofluidic chip were actuated using a two-channel function generator (WF1974; NF Corp., Japan). The electric potential for DEP trapping was applied to the ITO electrodes using a function generator (WF1948; NF Corp., Japan). The flow rates in the chip were controlled by connecting the inlets and outlets to gastight glass syringes (Hamilton Company, USA) mounted on a precisely controlled syringe pump (MFS-SP1, Microfluidic System Works Inc., Japan).Cells and reagents
The human prostate cancer cell line, DU145 (obtained from the RIKEN Bio Resource Center, Japan), was used for the demonstration. The DU145 cells were cultured in a humidified incubator (37 °C in an atmosphere of 5% CO2). The culture medium was RPMI 1640 (Invitrogen Corp., USA) supplemented with fetal bovine serum (10%, Gemini Bio-products, USA) and a penicillin–streptomycin solution (1%, Sigma Chemical Co., USA). The cultured cells were stained with a fluorescent probe (Calcein AM; Wako Pure Chemical Industries Ltd., Japan) and harvested. To adjust the conductivity of the cell suspension medium, a low-conductivity buffer (10 mM HEPES, 0.1 mM CaCl2, 59 mM D-glucose and 236 mM sucrose) was used, where BSA (Sigma Chemical Co., USA) was added to block nonspecific cell adhesion (2% wt/vol). The final conductivity of the buffer was 22.4 mS m−1. Before injecting the cells into the device, the culture medium was gently removed after centrifugation at 190g for 3 minutes, and the low-conductivity buffer was added to adjust the conductivity of the cell suspension medium to induce positive DEP.Results and discussion
Single cell trapping with the electroactive microwell array
The electroactive microwells utilize an electrostatic force, DEP, to actively attract single cells flowing over the microwell array. To investigate the DEP force acting on the cells, 2D simulation of the electric fields was carried out by using a commercially available code (Comsol Multiphysics, COMSOL Group, USA). Fig. 2A shows the simulated Ee contours and ∇|Ee|2 vectors, where the magnitude of the DEP force is proportional to ∇|Ee|2 as shown in eqn (3). The direction of ∇|Ee|2 is toward the inside of the microwell and the magnitude of the ∇|Ee|2 decreases with increasing distance from the electrodes. To evaluate the DEP trapping force, we considered the partial derivative of |Ee|2 with respect to the y direction, which represents a magnitude of the y directional DEP force, along the red dashed line in Fig. 2A. The magnitude of the partial derivative rapidly decreases with the distance from the electrodes as shown in Fig. 2B. Hence, we fabricated thin (4 μm) microwell structures on the electrodes, which increased the magnitude of the DEP force acting on a cell flowing over the microwell array compared to previously used thicker microwell structures.18 | ||
| Fig. 2 Simulation of the electric fields for the evaluation of DEP. (A) Simulated Ee contours and ∇|Ee|2 vectors, where the electric potential is assigned at the boundaries of the electrodes. (B) Partial derivative of |Ee|2 with respect to the y direction along the red dashed line in (A). | ||
The improved EMA was evaluated by trapping DU145 cells. Diluted DU145 cells were introduced into the integrated system and the cells were trapped with DEP by applying a 4 Vp–p sinusoidal electric potential at 8 MHz to the electrodes. The acoustophoresis was turned off and the waste outlet was closed (Qw = 0 μL min−1) to investigate the inherent trapping efficiency of the EMA. Fig. 3A displays time-lapse images of the DU145 cells during DEP trapping. Cells flowing over the microwell array were attracted to the bottom of the microwells with the positive DEP. When a cell was already trapped into a microwell, a second could not be trapped into the same microwell due to space restrictions. The trapping efficiency (recovery), a percentage ratio of the number of trapped cells to the number of cells flowing over the microwell array, was 98 ± 1.7% with a 4 μm microwell array structure at the flow rate of 4 μL min−1 (Fig. 3B). The trapping efficiency of the present EMA was drastically improved, compared to that of the older version of the chip having a thicker microwell array (15 μm in thickness),18 where the trapping efficiency was only 10%. This result indicates that the thin microwells on the electrodes allow a highly efficient DEP trapping since the cells are exposed to a strong attractive DEP force when flowing over the microwell array.
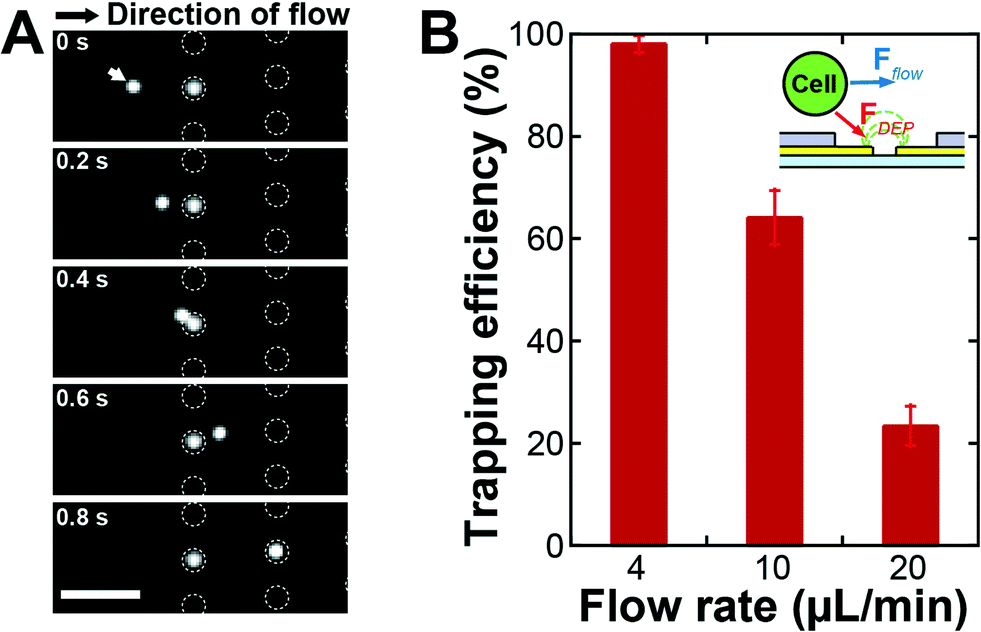 | ||
| Fig. 3 Single-cell trapping with DEP. (A) Time-lapse image of microwell array during DEP trapping, where the white dotted circles indicate the positions of microwells. The white arrow indicates a cell flowing over the microwell array. Scale bar is 100 μm. (B) Cell trapping efficiency depending on the inlet flow rate without acoustophoretic focusing of cells. The cell suspension, introduced into the inlet of the integrated device, was directly delivered to the microwell array device without focusing. A flow rate of 4 μL min−1 corresponded to the average velocity of 370 μm s−1 in the EMA chip, where the height and width of the PDMS microchannel were 50 μm and 3600 μm, respectively. | ||
Effect of flow rate on the single-cell trapping
The inlet flow rate of the chip determines the sample throughput capability: one can analyze large sample volumes within a shorter time at a higher inlet flow rate, a prerequisite for applications of rare cell analysis. The cell trapping efficiency of the EMA is, however, affected by the fluid velocity (Stokes drag) when the cells pass over the microwells. To investigate the cell trapping efficiency with respect to the average velocity of the flow which delivers the target cells, we fixed all experimental parameters except for the inlet flow rate. The average velocity in the EMA chip was proportional to the inlet flow rate since the cross-sectional area of the channel was fixed and the waste outlets of the acoustofluidic chip were closed. The trapping efficiencies were 98 ± 1.7%, 64 ± 5.3% and 23 ± 3.8% for the inlet flow rates of 4, 10 and 20 μL min−1 (Fig. 3B), respectively, where the flow rate of 4 μL min−1 corresponded to the average velocity of 370 μm s−1 in the EMA chip. The data showed the expected decrease in trapping efficiency with the increase in average velocity. When the target cells flow over the EMA, the DEP force attracting the cells is dependent on the exposure time of the cells to the electric field gradient above the microwells. Since the exposure time is shortened at higher flow rates, the trapping efficiency drops rapidly with an elevated flow rate.To enable a high sample throughput capability at an unchanged cell trapping efficiency, one should increase the inlet flow rate while maintaining a constant average velocity in the microfluidic channel of the EMA chip. An increase of the cross-sectional area by widening the microfluidic channel of the EMA chip allows an increase of the inlet flow rate without a change of the average velocity. However, it takes a longer time to observe the microwell array since the area of the microwell array becomes larger and this strategy does not support a large scalability. An effective strategy is rather to decrease the volume flow rate in the EMA chip without decreasing the inlet flow rate by integrating a pre-concentration sample preparation function, as proposed here by acoustophoretic cell concentration, directly onto the EMA chip to enable high throughput analysis.
Acoustophoretic cell focusing
The acoustophoretic cell concentration chip utilized ultrasonic standing wave forces, in two dimensions, to focus target cells in the acoustic pressure node located in the microchannel centre. For the demonstration of the cell focusing, we introduced fluorescently labeled DU145 cells into the inlet of the acoustofluidic chip (Qi = 20 μL min−1, Qw = 8 μL min−1 and Qo = 4 μL min−1). To form a half-wavelength resonance mode in the acoustofluidc chip, we applied a 10 Vp–p sinusoidal electric potential at 1.89 MHz to the piezoceramic transducer, resonant at 2 MHz, and 20 Vp–p at 5.08 MHz to the transducer, resonant at 5 MHz. As we activated the acoustophoresis, all of the cells flowing in the acoustofluidic channel were focused into the center of the channel (Fig. 4A). The center fraction of the flow with the acoustophoretically focused cells, which was directly connected to the EMA chip inlet, streamed into the EMA chip (Fig. 4B). The cell-free fraction of the flow in the acoustophoresis channel was discarded through the waste outlets. | ||
| Fig. 4 Acoustophoretic cell focusing. (A) Fluorescence images of the acoustofluidic chip. Acoustophoresis allowed cell focusing at the centre of the channel. Scale bar is 300 μm. (B) Bright field and fluorescence images of the connected area. The cells focused by acoustophoresis flows into the EMA chip. | ||
The acoustofluidic chip allowed us to operate the EMA chip at a constant outlet flow rate, Qo, without relying on the inlet flow rate, Qi. Since the acoustofluidic chip focuses the cells in a confined liquid volume, one can drastically decrease the volume flow rate by extracting the confined volume with the focused cells and discard the cell-free liquid. This feature improves the sample throughput capability while maintaining the cell trapping efficiency of the EMA.
Single cell trapping using the integrated device
The feasibility of high sample throughput capability of the integrated system was demonstrated by trapping diluted DU145 cells with various inlet flow rates, Qi. The outlet flow rate, Qo, was fixed at 4 μL min−1 to operate the EMA chip with a moderate flow rate for the efficient single cell trapping and the waste flow rates, Qw, were determined by Qw = (Qi − Qo)/2. Fig. 5A shows a time-lapse image of the microwell array in the integrated system during cell trapping, where Qi was 20 μL min−1. The focused cells, streamed from the acoustofluidic chip into the EMA chip at a flow rate of 4 μL min−1, were trapped into the electroactive microwells by DEP, applying an electric potential of 4 Vp–p at 8 MHz to the electrodes. The positions of the microwells were gradually occupied by single DU145 cells. After trapping the cells for a minute, we counted the number of trapped cells on the EMA, where we also counted the number of introduced cells for one minute by observing the fluidic channel. The cell recovery ratio, a percentage ratio of the number of trapped cells to the number of introduced cells, of the integrated system was 96 ± 0.8%, even at an inlet flow rate of 20 μL min−1 (Fig. 5B). The cell trapping efficiency of the integrated system was increased 4.2 times compared with the inherent trapping efficiency of the EMA chip for the inlet flow rate of 20 μL min−1. Moreover, the integrated system showed a reasonably high trapping efficiency of 65 ± 13% for an inlet flow rate as high as 100 μL min−1, where no cells were trapped into the EMA chip without acoustophoretic cell focusing at the same flow rate (data not shown). These results indicate that the integration of the acoustofluidic chip to the EMA chip allows us to array singe cells with a significantly improved sample throughput capability, approaching sample volumes of milliliters in the processing time of 10 minutes. | ||
| Fig. 5 DEP trapping after acoustophoretic concentration. (A) Fluorescence images of the microwell array during cell trapping. Scale bar is 200 μm. (B) Cell trapping efficiency depending on Qi with acoustophoretic cell focusing. The outlet flow rate (Qo) was fixed at 4 μL min−1 and Qw was determined by Qw = (Qi − Qo)/2. | ||
The integrated system shows good trapping efficiency at high inlet flow rates (20, 40, and 60 μL min−1) since the flow rate at the EMA chip was maintained constant. The cell recovery ratio was, however, gradually decreased with a further increased flow rate (Fig. 5B). One main reason could be caused by the difficulty in precise control of the flow in the fluidic channel. The PDMS microfluidic channel of the EMA chip and the tube connector, made of silicone, have large elasticity compared with the silicon wafer or glass substrate. The elastic deformation of the PDMS microfluidic channel, or the tube connector at the higher flow rate could cause change of the flow rate at the EMA chip or the imbalance of the flow rate at the waste outlets, respectively. Moreover, the acoustofluidic chip has inherent limitation on the cell concentration caused by the width of the critical centre fraction, a minute fraction of the total flow which contains all the cells. In the present setup, the critical centre fraction is smaller than 4% of the width of the fluidic channel at the flow rate of 100 μL min−1. Since an acoustofluidic chip having two sequential trifurcation outlet regions can solve this limitation by splitting the critical centre fraction from the main flow sequentially,20 one can further anticipate improvement of the sample throughput capability by using such sequential trifurcation outlets. Moreover, the width of the critical centre fraction could be widened by increasing the operation flow rate of the EMA chip.
Conclusions
In this paper, we have demonstrated the feasibility of the system integration of two original microfluidic devices having their unique functions. The integration of the acoustofluidic chip for sample pre-concentration and the EMA chip for single-cell analysis shows highly improved sample throughput, more than 10 times, on arraying of single cells while maintaining a highly efficient cell recovery ratio above 90%, compared to operating only the EMA chip. The integrated system is achieved simply by directly connecting an outlet of the acoustofluidic chip to an inlet of the EMA chip. Furthermore, the system holds potential for automation of the system for pre-concentration and trapping by controlling the electric potentials to the system. This kind of system integration of several original microfluidic devices holds promise to create a more advanced microfluidic system yet offering ease of use, and widen the scope of the field of applications in rare cell microfluidics. To further expand the feasibility of the presented integrated system, we aim to integrate a cell sorting function into the acoustofluidic chip to isolate target rare cells from blood samples based on their physical properties using acoustophoresis to build a highly integrated and automated platform for single-cell analysis of rare cells with high throughput.Acknowledgements
This research was supported by the Japan Science and Technology Agency for Strategic International Research Cooperative Program (SICP) and the Core Research for Evolutional Science and Technology (CREST). This research was also supported by the Sten K. Johnson Foundation, the Swedish Foundation for Strategic Research and Vinnova, Multidisiplinary BIO (MBD10-0018), and the Swedish Government Agency for Innovation Systems, VINNOVA – CellCARE (2009-00236), and the Knut and Alice Wallenberg Foundation (grant no. KAW 2012.0023).References
- J. S. de Bono, H. I. Scher, R. B. Montgomery, C. Parker, M. C. Miller, H. Tissing, G. V. Doyle, L. W. Terstappen, K. J. Pienta and D. Raghavan, Clin. Cancer Res., 2008, 14, 6302–6309 CrossRef CAS PubMed.
- E. Sollier, D. E. Go, J. Che, D. R. Gossett, S. O'Byrne, W. M. Weaver, N. Kummer, M. Rettig, J. Goldman, N. Nickols, S. McCloskey, R. P. Kulkarni and D. Di Carlo, Lab Chip, 2014, 14, 63–77 RSC.
- H. W. Hou, M. E. Warkiani, B. L. Khoo, Z. R. Li, R. A. Soo, D. S. Tan, W. T. Lim, J. Han, A. A. Bhagat and C. T. Lim, Sci. Rep., 2013, 3, 1259 Search PubMed.
- P. Augustsson, C. Magnusson, M. Nordin, H. Lilja and T. Laurell, Anal. Chem., 2012, 84, 7954–7962 CrossRef CAS PubMed.
- M. Antfolk, C. Antfolk, H. Lilja, T. Laurell and P. Augustsson, Lab Chip, 2015, 15, 2102–2109 RSC.
- P. Li, Z. Mao, Z. Peng, L. Zhou, Y. Chen, P. H. Huang, C. I. Truica, J. J. Drabick, W. S. El-Deiry, M. Dao, S. Suresh and T. J. Huang, Proc. Natl. Acad. Sci. U. S. A., 2015, 112, 4970–4975 CrossRef CAS PubMed.
- N. M. Karabacak, P. S. Spuhler, F. Fachin, E. J. Lim, V. Pai, E. Ozkumur, J. M. Martel, N. Kojic, K. Smith, P. I. Chen, J. Yang, H. Hwang, B. Morgan, J. Trautwein, T. A. Barber, S. L. Stott, S. Maheswaran, R. Kapur, D. A. Haber and M. Toner, Nat. Protoc., 2014, 9, 694–710 CrossRef CAS PubMed.
- S. Choi, O. Levy, M. B. Coelho, J. M. Cabral, J. M. Karp and R. Karnik, Lab Chip, 2014, 14, 161–166 RSC.
- P. R. Gascoyne, J. Noshari, T. J. Anderson and F. F. Becker, Electrophoresis, 2009, 30, 1388–1398 CrossRef CAS PubMed.
- S. Shim, K. Stemke-Hale, A. M. Tsimberidou, J. Noshari, T. E. Anderson and P. R. Gascoyne, Biomicrofluidics, 2013, 7, 11807 CrossRef PubMed.
- H. S. Moon, K. Kwon, S. I. Kim, H. Han, J. Sohn, S. Lee and H. I. Jung, Lab Chip, 2011, 11, 1118–1125 RSC.
- V. Plaks, C. D. Koopman and Z. Werb, Science, 2013, 341, 1186–1188 CrossRef CAS PubMed.
- D. Di Carlo, L. Y. Wu and L. P. Lee, Lab Chip, 2006, 6, 1445–1449 RSC.
- D. Di Carlo, N. Aghdam and L. P. Lee, Anal. Chem., 2006, 78, 4925–4930 CrossRef CAS PubMed.
- J. R. Rettig and A. Folch, Anal. Chem., 2005, 77, 5628–5634 CrossRef CAS PubMed.
- B. M. Taff and J. Voldman, Anal. Chem., 2005, 77, 7976–7983 CrossRef CAS PubMed.
- S. Kobel, A. Valero, J. Latt, P. Renaud and M. Lutolf, Lab Chip, 2010, 10, 857–863 RSC.
- S. H. Kim, T. Yamamoto, D. Fourmy and T. Fujii, Small, 2011, 7, 3239–3247 CrossRef CAS PubMed.
- S. H. Kim, X. He, S. Kaneda, J. Kawada, D. Fourmy, H. Noji and T. Fujii, Lab Chip, 2014, 14, 730–736 RSC.
- M. Nordin and T. Laurell, Lab Chip, 2012, 12, 4610–4616 RSC.
- D. I. C. Wang, T. J. Sinskey, R. E. Gerner and R. P. Defilipp, Biotechnol. Bioeng., 1968, 10, 641–649 CrossRef PubMed.
- J. Yang, W. C. Hooper, D. J. Phillips, M. L. Tondella and D. F. Talkington, Clin. Diagn. Lab. Immunol., 2002, 9, 1142–1143 Search PubMed.
- J. Warrick, B. Casavant, M. Frisk and D. Beebe, Anal. Chem., 2010, 82, 8320–8326 CrossRef CAS PubMed.
- A. J. Mach, J. H. Kim, A. Arshi, S. C. Hur and D. Di Carlo, Lab Chip, 2011, 11, 2827–2834 RSC.
- M. Yamada and M. Seki, Anal. Chem., 2006, 78, 1357–1362 CrossRef CAS PubMed.
- A. K. Balasubramanian, K. A. Soni, A. Beskok and S. D. Pillai, Lab Chip, 2007, 7, 1315–1321 RSC.
- C. R. Cabrera and P. Yager, Electrophoresis, 2001, 22, 355–362 CrossRef CAS.
- D. Puchberger-Enengl, S. Podszun, H. Heinz, C. Hermann, P. Vulto and G. A. Urban, Biomicrofluidics, 2011, 5 Search PubMed.
- N. Gadish and J. Voldman, Anal. Chem., 2006, 78, 7870–7876 CrossRef CAS PubMed.
- P. Grodzinski, J. Yang, R. H. Liu and M. D. Ward, Biomed. Microdevices, 2003, 5, 303–310 CrossRef CAS.
- J. J. Hawkes and W. T. Coakley, Enzyme Microb. Technol., 1996, 19, 57–62 CrossRef CAS.
- P. Augustsson, R. Barnkob, S. T. Wereley, H. Bruus and T. Laurell, Lab Chip, 2011, 11, 4152–4164 RSC.
- F. Petersson, L. Aberg, A. M. Sward-Nilsson and T. Laurell, Anal. Chem., 2007, 79, 5117–5123 CrossRef CAS PubMed.
- J. Voldman, Annu. Rev. Biomed. Eng., 2006, 8, 425–454 CrossRef CAS PubMed.
Footnotes |
| † Electronic supplementary information (ESI) available. See DOI: 10.1039/c5lc01065a |
| ‡ These authors contributed equally to this work. |
| This journal is © The Royal Society of Chemistry 2015 |