 Open Access Article
Creative Commons Attribution 3.0 Unported Licence
Self-assembled magnetic bead chains for sensitivity enhancement of microfluidic electrochemical biosensor platforms†
L.
Armbrecht
a,
C.
Dincer
*ab,
A.
Kling
a,
J.
Horak
ac,
J.
Kieninger
a and
G.
Urban
ab
aLaboratory for Sensors, Department of Microsystems Engineering - IMTEK, University of Freiburg, 79110 Freiburg, Germany. E-mail: Can.Dincer@imtek.de
bFreiburg Materials Research Center - FMF, University of Freiburg, 79110 Freiburg, Germany
cDivision of Chemical Protein Engineering, KTH Stockholm, Stockholm, Sweden
First published on 23rd September 2015
Abstract
In this paper, we present a novel approach to enhance the sensitivity of microfluidic biosensor platforms with self-assembled magnetic bead chains. An adjustable, more than 5-fold sensitivity enhancement is achieved by introducing a magnetic field gradient along a microfluidic channel by means of a soft-magnetic lattice with a 350 μm spacing. The alternating magnetic field induces the self-assembly of the magnetic beads in chains or clusters and thus improves the perfusion and active contact between the analyte and the beads. The soft-magnetic lattices can be applied independent of the channel geometry or chip material to any microfluidic biosensing platform. At the same time, the bead-based approach achieves chip reusability and shortened measurement times. The bead chain properties and the maximum flow velocity for bead retention were validated by optical microscopy in a glass capillary. The magnetic actuation system was successfully validated with a biotin–streptavidin model assay on a low-cost electrochemical microfluidic chip, fabricated by dry-film photoresist technology (DFR). Labelling with glucose oxidase (GOx) permits rapid electrochemical detection of enzymatically produced H2O2.
Introduction
Since the 1990s, microfluidic biosensor systems utilizing solid microparticles (beads) have become popular.1,2 Microfluidic systems benefit from small dimensions and reaction volumes, thus enhancing the time-to-result and lowering the analyte volume at high sensitivities.3,4 Besides polyimide, silica or agar-based beads, superparamagnetic particles composed of magnetic nanoparticles embedded in a polymeric matrix have become a common analytical tool in biological labs.5 Microfluidic biosensor systems largely benefit from these spherical magnetic microparticles.6,7 The possibility of magnetic manipulation, combined with their high surface-to-volume ratio, enables the fabrication of reusable, highly sensitive on-chip biosensors for various applications.8,9 Additionally, magnetic bead actuation is utilized for biosensing as well as cell separation in platforms that use droplet microfluidic approaches.10In the past 15 years, significant progress in the manipulation of magnetic beads on-chip has been achieved.11 In order to realize highly sensitive bead-based microfluidic biosensors, active contact between the beads and the sample has to be maximized. Here, high perfusion of the sample allows the capture of a maximum number of target molecules, which leads to enhanced signals.12–16 Bead-based immunoassay platforms with varying channel cross-sections in combination with permanent magnets have been presented.17 Integrated electromagnets and highly complex dynamic systems linking external electromagnets and permanent magnets have also been proposed.18,19 The active manipulation of magnetic beads inside microfluidic channels offers new opportunities for the improvement in performance of a large variety of reliable, sensitive and low-cost biological tests. Nevertheless, the complexity of the manipulation system and/or the requirements for the chip design still prevent the widespread use of the aforementioned manipulation techniques.
Enzyme-linked immunosorbent assays (ELISA) are still the most sensitive, specific and selective measurement method for the qualitative and quantitative detection of biomarkers.20 They have been extensively studied in various disciplines such as biology, medicine, food safety monitoring, chemistry and other research fields with detection limits down to the pg ml−1 range.21–24 In this work, we mimic these biological binding assays with a biotin–streptavidin model assay, labelled with glucose oxidase. Detection using biological assays is commonly carried out via optical absorbance or chemiluminescence measurements.25,26 In contrast to these techniques, electrochemical detection of enzymatically produced H2O2 has the advantage of a fast read-out due to the intrinsic enzymatic amplification, independence of optical chip properties and easy miniaturization of the chip and measurement setup. Therefore, electrochemical detection is well suited for point-of-care (POC) diagnostic systems.27
Microfluidic electrochemical biosensors, fabricated by DFR technology, benefit from low production costs and possible mass fabrication using roll-to-roll processes. They have already been proposed by Horak et al. as disposable sensors for the detection of different analytes.28,29
In this work, the previous DFR-based sensor platform is extended to a bead-based sensor platform. It combines DFR technology with a new, cost-efficient, small and universally applicable magnetic actuation principle. This is based on a soft-magnetic lattice, fabricated by lamination of soft-magnetic and non-magnetic foils into a stack. Combined with permanent magnets, these structures create a magnetic field gradient along the microfluidic channel in the underlying microfluidic chip. This leads to the self-assembly of magnetic beads in chain-like structures with improved contact between the beads and the solution. In comparison with other techniques, this allows low-cost mass fabrication of the manipulation device without any need for complex machinery. Furthermore, external application enhances the flexibility in chip design.17–19
We optically observed the influence of the soft-magnetic lattice application on the bead distribution in the microchannel as well as the bead retention under flow conditions. Electrochemical validation was performed on the redesigned DFR-based biosensor chip, utilizing a custom-made measurement adapter. A more detailed description of the DFR technology and the characterization of the biosensor chip is given in the ESI.†
Experimental
Fabrication of soft-magnetic lattices
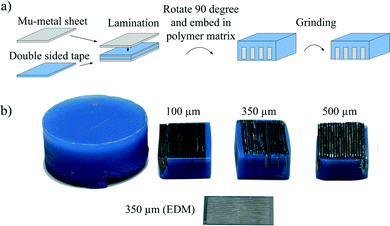
Fig. 1a illustrates the fabrication of soft-magnetic lattices by the lamination technique. A mu-metal foil (Vacuumschmelze GmbH & Co. KG, Germany) and double-sided sticky tape (Tesa, Germany) with thicknesses of 100, 350 and 500 μm are laminated to a multilayer stack of 13 mm. Subsequent embedment in a polymeric matrix ensures mechanical stability and a final grinding step releases the soft-magnetic lattice structure. The investigated lattice spacings are a trade-off between high magnetic field gradients for bead capture and small distances between bead chains, improving the diffusion of the analyte towards the beads. Detailed information thereof is given in the ESI.†In order to compare the lamination approach with existing structuring methods of soft-magnetic materials, an additional lattice with a 350 μm spacing was fabricated by electrochemical discharge machining (EDM) out of a 100 μm-thick mu-metal foil. The fabricated devices are shown in Fig. 1b.
Actuation of magnetic beads
The magnetic force that acts on an individual magnetic bead is defined by the bead properties and the applied external magnetic field. In the saturation region, the force is given by:30 | (1) |
 is the magnetization of the bead in the saturation region and
  is the induced magnetic flux density. As seen in eqn (1), for a given particle magnetization, the magnetic force is directly dependent on the gradient of the magnetic field. The viscous drag counteracts this force and, assuming fluid flow only in the x-direction, the maximal flow velocity for bead retention is consequently given by:30
 | (2) |
Setup for optical investigations
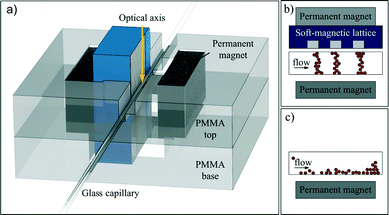
For real-time monitoring of magnetic beads under flow conditions and optical visualization of bead chains, a setup composed of a transparent glass capillary (Hilgenberg GmbH, Germany; I.D.: 80 μm; O.D.: 120 μm), a syringe pump (PHD 2000 Harvard Apparatus, USA; syringes from Hamilton Company, USA) and the magnetic actuation system as illustrated in Fig. 2a was used. The magnetic actuation system was located perpendicular to the glass capillary enabling microscopy from above. To allow easy disassembly of the capillary from the magnetic actuation system, two 20 × 10 × 4 mm3-sized NdFeB permanent magnets as well as the soft-magnetic structure were fixed on a transparent 4 mm-thick PMMA base. The glass capillary that resembles the microfluidic channel was glued onto a second, independent plate (PMMA top).Before the magnetic parts were attached, 5 μl of a solution with the desired concentration of monodisperse 1.43 μm streptavidin-coated magnetic beads was introduced into the capillary. The PMMA top was subsequently mounted onto its counterpart for magnetic actuation. Deionized water was withdrawn through the micro-capillary at flow rates of up to 10 mm s−1 with the previously mentioned syringe pump. Images of the bead chain formation were taken at different bead concentrations and flow velocities for the 100 μm, 350 μm and 500 μm laminated lattices.
DFR-based biosensor chip fabrication
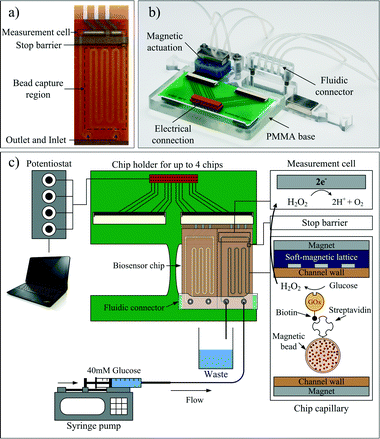
Pyralux® AP 8525R (DuPont™, USA) with a thickness of 50 μm was used as the substrate for the wafer-level processing of the biosensor chip. An ma-N 1420 photoresist (Micro Resist Technology GmbH, Germany) was spin-coated onto the PI substrate and structured. A 200 nm platinum layer was then evaporated onto the substrate under clean room conditions. Metal patterns were released in a subsequent lift-off process.The next steps were spin-coating and lithographic structuring of a 5 μm-thick SU-8 3005 (MicroChem Corp., USA) isolation layer, defining the electrode sizes and an additional well for the stop barrier. The microfluidic channels were subsequently realized with the DFR material Pyralux® PC1025 (DuPont™, USA) having a thickness of 64 μm. Then, the Ag/AgCl reference electrode was fabricated by electrodeposition of silver, followed by a chloridation step. The physical barrier was realized by dispensing a small drop of 1% Teflon (DuPont™, USA) solution into the predefined wells in the SU-8 isolation layer of the chip. After evaporation of the solvent, a thin Teflon layer was formed that is sufficient to act as a flow barrier during capillary filling. Finally, the cover layer with the fluidic inlet and outlet ports were realized in an additional DFR layer. To prevent bending effects due to thermal expansion effects during baking, the symmetry was achieved by laminating two layers of DFR on the back side of the wafer. The chips were thereafter cut into duplicates and baked in an oven for 3 hours at 160 °C. The resulting flexible biosensor chips (Fig. 3a) have a size of 25.65 × 10.20 mm2. The working electrode's size is 0.311 mm2, the channel width is 500 μm and the microfluidic channel up to the stop barrier, the bead capture region, holds approximately 3.2 μl of an analyte.
A comparable process based on a different DFR material has already been shown by Horak et al.28
Magnetic, electrochemical and microfluidic setup
The sensor is mounted on a custom-made adapter prior to measurements. Fig. 3b presents this measurement adapter for electric and fluidic connection to the periphery as well as magnetic actuation. A fast and reliable electrical connection to a four-channel bipotentiostat (Jobst Technologies GmbH, Germany) is obtained. The setup enables facile chip connection and parallel measurement of up to four biosensor chips. The fluidic connection is established by screwing a PMMA connector onto the PMMA base. In contrast to pressure seals, the employed 0.125" vacuum cups (Nordson EFD, Germany) are more flexible and allow tight sealing without the risk of channel compression or pinch-off.Electrochemical measurements on-chip
As illustrated in Fig. 3c, the measurement cell consists of a Ag/AgCl reference electrode and two Pt electrodes used as the working and counter electrodes in amperometric measurements. The working electrode detects enzymatically produced H2O2 at 450 mV vs. Ag/AgCl. Glucose oxidase, producing H2O2 from a glucose solution, was used as an enzymatic label. All solutions were prepared in ultra-pure, HPLC-grade water (Alfa Aesar, USA).After introduction of the beads, 100 mM phosphate-buffered saline (PBS), 137 mM NaCl, 2.7 mM KCl, 10 mM Na2HPO4, 2 mM KH2PO4, at pH = 7.4 was withdrawn through the microfluidic channel at a mean flow velocity of 1.5 mm s−1 (flow rate of 2.88 μl min−1). When the amperometric signal reached a stable steady-state current (baseline), a 40 mM glucose substrate, diluted in 100 mM PBS (pH = 7.4), was introduced and stopped-flow measurements were performed. In the stop phase, H2O2 accumulates in the channel and is subsequently flushed over the working electrode when the flow is restarted. The generated current peak is visualized with the software BioMON (Jobst Technologies GmbH, Germany) on a computer.31
Biotinylated GOx model assay
Streptavidin-coated magnetic beads (Microparticles GmbH, Germany) with a diameter of 1.43 μm were used for all experiments. The biotinylated GOx (bGOx) model assay takes advantage of the strong affinity of biotin to streptavidin.32 Upon getting in close proximity, bGOx binds to the streptavidin-coated magnetic beads. Dilution of the magnetic beads was carried out by diluting the stock solution (10 mg ml−1 bead content) 10-fold and 100-fold in 0.1 M PBS.To experimentally validate the functionality of the fabricated soft-magnetic lattice structures, the appropriate bead dilution was washed with 10 mM phys. PBS (pH = 7.4) and incubated for 30 min with up to 1 μg ml−1 bGOx. After subsequent washing with wash buffer (phys. PBS with 1% Tween 20) on a magnetic holder (Dynal Technologies, Norway), 3.5 μl of the solution was introduced into the biosensors by capillary filling and the chips were mounted onto the measurement adapter.
To prevent unspecific adsorption during on-chip immobilization tests, the chips were blocked for 1 h with 1% bovine serum albumin (BSA) in phys. PBS and washed with 200 μl of wash buffer. Then, the 0.1 mg ml−1 bead dilution was introduced into the micro-capillary with the syringe pump, incubated with 200 ng ml−1 bGOx on-chip and washed by withdrawal of 20 μl of wash buffer prior to measurements.
Results and discussion
Simulation
Simulation of the magnetic flux inside the microfluidic channel was performed with the open source program FEMM (D. C. Meeker, Finite Element Method Magnetics, Version 4.0.1) in a distance of 100 μm from the soft-magnetic lattice. This value represents the distance between the DFR cover layer and the center of the microfluidic channel in the biosensor chip. Employing 10 × 20 × 4 mm3 permanent neodymium–iron–boron (NdFeB) magnets (Webcraft GmbH, Germany) and a 350 μm-spaced laminated soft-magnetic lattice, the 2-D FEMM simulations show the formation of a magnetic field gradient in the microfluidic channel (Fig. 4). The utilized setup consisted of a permanent magnet underneath the biosensor chip and the lattice structure as well as a second permanent magnet applied to the channel cover. According to eqn (2), capture of 1.43 μm-sized magnetic beads (Microparticles GmbH, Germany) takes place at the local maxima of the magnetic flux gradient. Hence, the shown combination of the lattice and magnets retains the 1.43 μm-sized magnetic beads up to a flow velocity of 3.44 mm s−1.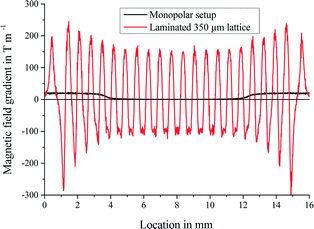 | ||
| Fig. 4 Influences of soft-magnetic lattice application on the magnetic flux profile in a distance of 100 μm were simulated using the open source program FEMM. A lattice with 350 μm spacings (red) results in an alternating magnetic field compared to a monopolar setup without a lattice structure (black). With the help of eqn (2), a maximum flow for bead retention of 3.44 mm s−1 is estimated. | ||
Lamination of soft-magnetic lattices
The fabrication of soft-magnetic lattices by lamination was proven to be fast and facile. Lattice spacings down to 100 μm were fabricated without any noticeable issues. The advantages of this technology are the low cost, high structure thickness, fast processing and huge flexibility in design compared to other suitable techniques like EDM, etching, pulse-lasering, etc. Additionally, no external equipment is necessary during fabrication and no heat is introduced.Structures and properties of the formed beads
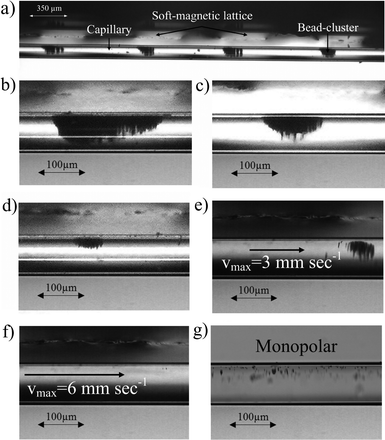
Fig. 5a shows that application of the soft-magnetic lattices results in the formation of magnetic bead clusters. These consist of multiple bead chains with the distance between individual clusters being defined by the lattice spacing. The bead structures tend to accumulate at the top of the channel due to the enlarged distance to the permanent magnet on this side of the micro-capillary in the optical setup. However, this effect is averted on the electrochemical measurement adapter since the magnetic parts are directly applied to the channel resulting in a highly symmetric setup.Fig. 5b–d represent the self-assembled bead structures at bead concentrations of 1 mg ml−1, 0.1 mg ml−1 and 0.01 mg ml−1. The higher the bead concentration, the larger the bead clusters and the better the channel perfusion.
The resistance of these bead structures against fluid flow was investigated using a 350 μm laminated lattice. Deionized water as the substrate was supplied and the mean flow velocity was increased stepwise.
On-line visualization enabled the determination of the maximum flow velocity for bead retention. Fig. 5e and f show that the bead chains withstand flow velocities of up to 3 mm s−1 and cover a significantly higher fraction of the channel cross-section than those in the monopolar setup (Fig. 5g). Furthermore, these optical results match with the analytical estimations based on the magnetic simulations, yielding a theoretical maximum flow velocity of 3.44 mm s−1.
Characterization of the electrochemical biosensor platform
Wafer-level fabrication of the DFR biosensor chips was followed by their characterization. A detailed description is given in the ESI.†It was found that the biosensor chips have a linear and reproducible H2O2 sensitivity of 6 nA mm−2 μM−1 at a flow velocity of 1.5 mm s−1. Washing with wash buffer verified the ability to remove almost all beads from the microfluidic channel. Therefore, reusability of the chips is also possible. Stopped-flow measurements produce a detectable signal peak resulting from the accumulation of enzymatically produced H2O2 in the microfluidic channel. It was proven that the peak charge and peak current in the stopped-flow measurements are proportional. Thus, the peak current can be taken as the measurement signal.
Electrochemical measurements with pre-immobilized beads
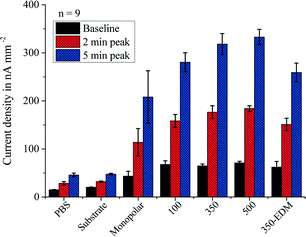
After characterizing the sensor platform, evaluation of the magnetic actuation with soft-magnetic lattices had to be conducted. Electrochemical measurements were performed with beads that were pre-immobilized with different bGOx concentrations in standard lab tubes. Fig. 6 shows the results of the measured continuous flow signal (baseline), and the 2 min and the 5 min stopped-flow peak current densities after introduction of 3.5 μl of the bead solution into the microfluidic capillary and subsequent magnetic actuation. The different magnetic actuation setups were experimentally tested with a bead concentration of 0.1 mg ml−1. A significant increase in the signal was seen when soft-magnetic lattices were applied. Lamination was found to be the superior technology for lattice fabrication compared to EDM, even though EDM preserves higher surface qualities. The reason for this is the enormous lattice thickness of the laminated devices (several mm) that cannot be achieved by EDM or other high-precision fabrication techniques.The 100 μm lattice spacing showed a significantly weaker signal compared with the 350 μm and 500 μm spacings. This is related to the distance between the beads and the soft-magnetic lattice, which is in the same magnitude as the lattice spacing. This leads to a decrease in the amplitude of the magnetic field gradient in the microfluidic channel. Hence, bead capture and bead-chain formation cannot be guaranteed. Different concentrations of bGOx were subsequently applied to investigate the effect of lattice application over a bGOx concentration range from 0.32 ng ml−1 to 1 μg ml−1 during incubation with magnetic beads in lab tubes.
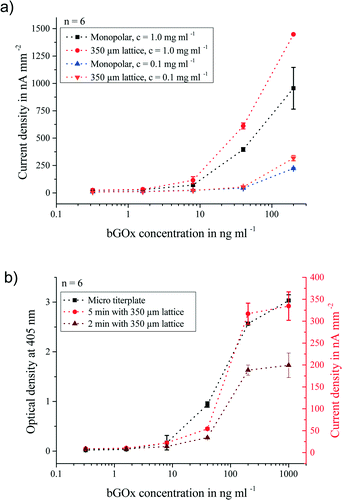
Fig. 7a shows the 5 min stopped-flow peak current densities obtained from the aforementioned measurements. It was seen that the 350 and 500 μm laminated soft-magnetic lattices were able to enhance the electrochemical signal of the pre-immobilized beads by a factor of 1.7 at a three times lower standard deviation. This is explained by the formation of magnetic bead chains and clusters leading to more homogeneous bead distribution in the channel and improved contact between the beads and the solution. This effect was seen over the whole concentration range and for two different bead concentrations of 1 and 0.1 mg ml−1. Besides, it was found that the sensitivity of the platform could be tuned by increasing the amount of introduced beads. Nevertheless, an increased bead concentration without allocation of a lattice structure also leads to higher measurement errors. This can be explained by the accumulation of beads at the end of the permanent magnet in the monopolar setup. The limited space at this location results in the loss of beads that are forced in larger distances to the magnet and can thus no longer withstand the flow.
Utilization of microtiter plates is a commonly used and well-established technique for the detection of analytes by biological assays. Therefore, pre-immobilized beads were measured on a microtiter plate format and on the magnetic bead-based electrochemical biosensor platform. In contrast to the chip platform, the microtiter plate format is limited to bead concentrations of up to 0.1 mg ml−1 due to the optical properties of the beads attributed to their high iron oxide content. For comparability, all tests shown in Fig. 7b were carried out with a bead concentration of 0.1 mg ml−1. It was seen that our platform shows the same signal characteristics as the microtiter plate format. On both formats, the limit of detection (LOD) was 8 ng ml−1. Additionally, the measurement duration on-chip was reduced to 2 min on the electrochemical biosensor system. Furthermore, only a bead solution and analyte volume of 3.5 μl is necessary, compared to 100 μl used on the microtiter plate format.
Electrochemical measurements with on-chip immobilization
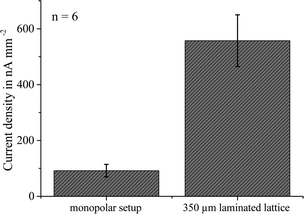
To prove the efficiency of the increased active contact between the beads and the analyte under the application of soft-magnetic lattices, on-chip immobilization of the beads was performed. Therefore, 10 μl of the streptavidin-coated magnetic beads was introduced into the microfluidic channel of the biosensor chip with the syringe pump. Then, the magnetic actuation system was applied and 10 μl of the analyte was withdrawn through the channel at a mean flow velocity of 1.5 mm s−1. When the analyte was located at the immobilization area, the flow was stopped for a 15 min incubation step. After 5 min of washing with 0.1 M PBS, the 40 mM glucose substrate was supplied at a mean flow velocity of 1.5 mm s−1 and electrochemical stopped-flow measurements were conducted.Fig. 8 compares the generated signals for a bGOx concentration of 200 ng ml−1 incubated with and without application of the soft-magnetic lattice. It was seen that the increase in platform sensitivity induced by lattice application is higher than the 1.7-fold increase in the case of the pre-immobilized beads. The reason for this is the improved analyte capture in the channel due to the bead chain formation, which cannot be investigated with the pre-immobilized beads. More than 5-fold amplification was achieved with the 350 μm laminated soft-magnetic lattice compared to the monopolar setup.
Conclusion
In this work, we presented a magnetic bead-based biosensor platform, which combines DFR technology together with soft-magnetic lattices. The soft-magnetic lattices are produced by lamination of soft-magnetic and non-magnetic foils. Lamination, as a fabrication technique for soft-magnetic lattices, benefits from low costs and allows the realization of lattice thicknesses in the mm-to-cm range. Nevertheless, the lower limit in the lattice spacing is defined by the distance between the beads and the lattice structure (chip cover). Optical investigation of the self-alignment of the magnetic beads in chains and clusters revealed possible bead retention up to flow velocities of 3 mm s−1 in deionized water. Furthermore, it was verified that the distances in between and the size of the bead structures are tunable through the amount of introduced beads and the spacing of the soft-magnetic lattice.Compared to the monopolar setup, the application of laminated soft-magnetic lattices with a 350 μm lattice spacing shows a more than 5-fold increase in the current signal for on-chip immobilization tests using a bGOx model assay on magnetic beads. Even for pre-immobilized beads, the formation of magnetic bead chains and clusters resulted in an almost 2-fold signal enhancement over the whole measured concentration range of bGOx.
The use of laminated soft-magnetic lattices as a magnetic actuation method can be applied to a huge variety of magnetic bead-based microfluidic biosensor platforms and represents a cheap and facile solution to significantly increase the sensitivity of such platforms.
Acknowledgements
The authors would like to thank Prof. Thomas Hanemann from the Laboratory for Materials Processing of the Department of Microsystems Engineering – IMTEK, University of Freiburg for his support.References
- A. Manz, N. Graber and H. M. Widmer, Sens. Actuators, B, 1990, 1, 244–248 CrossRef CAS.
- M. A. M. Gijs, Microfluid. Nanofluid., 2004, 1, 22–40 CAS.
- E. Verpoorte, Lab Chip, 2003, 3, 60N–68N RSC.
- T. M. Phillips and E. F. Wellner, Electrophoresis, 2007, 28, 3041–3048 CrossRef CAS PubMed.
- D. Raps, N. Hossieny, C. B. Park and V. Altstädt, Polymer, 2014, 56, 5–19 CrossRef PubMed.
- E. Paleček and M. Fojta, Talanta, 2007, 74, 276–290 CrossRef PubMed.
- O. Phillippova, A. Barabanova, V. Molchanov and A. Khokhlov, Eur. Polym. J., 2011, 47, 542–559 CrossRef PubMed.
- J. A. Thompson and H. H. Bau, J. Chromatogr., B, 2010, 878, 228–236 CrossRef CAS PubMed.
- A. RIda and M. A. M. Gijs, Anal. Chem., 2004, 76, 6239–6246 CrossRef CAS PubMed.
- H. Lee, L. Xu and K. W. Oh, Biomicrofluidics, 2014, 8(4), 044113 CrossRef PubMed.
- N. Pamme, Lab Chip, 2006, 6, 24–38 RSC.
- S. V. Kergaravat, G. A. Gómez, S. N. Fabiano, T. I. L. Chávez, M. I. Pividori and S. R. Hernández, Talanta, 2012, 97, 484–490 CrossRef CAS PubMed.
- S. A. Peyman, A. Iles and N. Pamme, Lab Chip, 2009, 9, 3110–3117 RSC.
- N. Pamme, J. C. Eijkel and A. Manz, J. Magn. Magn. Mater., 2006, 302, 237–244 CrossRef PubMed.
- W. C. Lee, K. Y. Lien, G. B. Lee and H. Y. Lei, Diagn. Microbiol. Infect. Dis., 2008, 60, 51–58 CrossRef CAS PubMed.
- M. Bu, T. B. Christensen, K. Smistrup, A. Wolff and M. F. Hansen, Sens. Actuators, A, 2008, 145–146, 430–436 CrossRef CAS PubMed.
- F. Lacharme, C. Vandevyver and M. A. M. Gijs, Anal. Chem., 2008, 80, 2905–2910 CrossRef CAS PubMed.
- J. W. Choi, C. H. Ahn, S. Bhansali and H. T. Henderson, Sens. Actuators, B, 2000, 68, 34–39 CrossRef CAS.
- Y. Moser, T. Lehnert and M. A. M. Gijs, Lab Chip, 2009, 9, 3261–3267 RSC.
- R. Mazurczyk, J. Vieillard, A. Bouchard, B. Hannes and S. Krawczyk, Sens. Actuators, B, 2006, 118, 11–19 CrossRef CAS PubMed.
- J. W. A. Findlay, W. C. Smith, J. W. Lee, G. D. Nordblom, I. Das, B. S. DeSilva, M. N. Khan and R. R. Bowsher, J. Pharm. Biomed. Anal., 2000, 21, 1249–1273 CrossRef CAS.
- P. B. Luppa, L. J. Sokoll and D. W. Chan, Clin. Chim. Acta, 2001, 314, 1–26 CrossRef CAS.
- M. Hervás, M. A. López and A. Escarpa, Analyst, 2011, 136, 2131–2138 RSC.
- A. Escarpa, Lab Chip, 2014, 14, 3213 RSC.
- B. Otieno, C. E. Krause, A. Latus, B. V. Chikkaveeraiah, R. C. Faria and J. F. Rusling, Biosens. Bioelectron., 2014, 53C, 268–274 CrossRef PubMed.
- M. Iranifam, TrAC, Trends Anal. Chem., 2013, 51, 51–70 CrossRef CAS PubMed.
- Z. Herrasti, I. Etxabe, J. M. Mitxelena, I. Gabilondo, M. P. Martínez and F. Martínez, Sens. Actuators, B, 2013, 189, 66–70 CrossRef CAS PubMed.
- J. Horak, C. Dincer, H. Bakirci and G. Urban, Sens. Actuators, B, 2014, 191, 813–820 CrossRef CAS PubMed.
- J. Horak, C. Dincer, E. Qelibari, H. Bakirci and G. Urban, Sens. Actuators, B, 2015, 209, 478–485 CrossRef CAS PubMed.
- S. S. Shevkoplyas, A. C. Siegel, R. M. Westervelt, M. G. Prentissc and G. M. Whitesides, Lab Chip, 2007, 1294–1302 RSC.
- A. Weltin, K. Slotwinsk, J. Kieninger, I. Moser, G. Jobst, M. Wego, R. Ehret and G. A. Urban, Lab Chip, 2014, 14, 138–146 RSC.
- P. Weber, D. Ohlendorf, J. Wendoloski and F. Salemme, Science, 1989, 243, 85–88 CAS.
Footnote |
| † Electronic supplementary information (ESI) available. See DOI: 10.1039/c5lc00796h |
| This journal is © The Royal Society of Chemistry 2015 |

