 Open Access Article
Creative Commons Attribution 3.0 Unported Licence
Efficient cell pairing in droplets using dual-color sorting†
Hongxing
Hu‡
,
David
Eustace‡
and
Christoph A.
Merten
*
European Molecular Biology Laboratory (EMBL), Genome Biology Unit, Meyerhofstrasse 1, Heidelberg, Germany. E-mail: merten@embl.de
First published on 17th August 2015
Abstract
The use of microfluidic droplets has become a powerful tool for the screening and manipulation of cells. However, currently this is restricted to assays involving a single cell type. Studies on the interaction of different cells (e.g. in immunology) as well as the screening of antibody-secreting cells in assays requiring an additional reporter cell, have not yet been successfully demonstrated. Based on Poisson statistics, the probability for the generation of droplets hosting exactly one cell of two different types is just 13.5%. To overcome this limitation, we have developed an approach in which different cell types are stained with different fluorescent dyes. Subsequent to encapsulation into droplets, the resulting emulsion is injected into a very compact sorting device allowing for analysis at high magnification and fixation of the cells close to the focal plane. By applying dual-color sorting, this furthermore enables the specific collection and analysis of droplets with exactly two different cells. Our approach shows an efficiency of up to 86.7% (more than 97% when also considering droplets hosting one or more cells of each type), and, hence, should pave the way for a variety of cell-based assays in droplets.
Introduction
Droplet-based microfluidics holds great potential for high throughput screening (HTS) applications involving cells. For example, the technology has been successfully used for the detection of low abundant cell-surface markers,1 cytotoxicity screens,2 antibody selections,3 directed evolution approaches4 and single-cell genomic applications.5–7 However, assays involving two different cell types, e.g. to screen the effect of a cell-secreted antibody on a reporter cell,8–10 or assays studying the interactions of different immune cells11 have not yet been performed in droplets. This is due to the fact that the cell occupancy in each droplet cannot be precisely controlled,12 which prevents screens with immense biomedical potential from being carried out in a high-throughput droplet-based format. Deterministic cell-encapsulation modules have been described previously,13,14 but their adaptation towards co-encapsulation of two different cell types has shown limited efficiency of only about 29%.15 Similarly, droplets have been successfully sorted for different cell occupancies by active flow deflection, but only while using a single cell type.16 This is technically simpler than sorting for the presence of two different cells, which requires discrimination between the two cell types. Furthermore, the maximal probability for encapsulating two identical cells is twice that of encapsulating two different cells. To overcome these limitations, we present a novel approach, based on the staining of cells with two different fluorescent dyes and subsequent dual-color sorting. Using a sorting chip customized for this application we demonstrate the specific collection of droplets with exactly one cell of each type; however the system could also be used for the sorting of droplets with other desired cell occupancies.Results
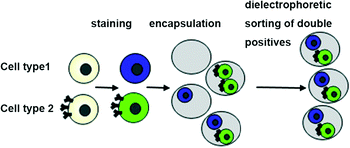
Our approach involved several steps: i) establishment of a generic cell labelling strategy ii) design of customized sorting and analysis chips and iii) development of control software with the ability to process complex multi-channel signals (Fig. S1†). As a model system for our studies, we used Her2 hybridoma cells stained with either Calcein-AM (green viability stain) or Calcein Violet (violet viability stain).These dyes can be applied to any mammalian cells and enable two populations to be distinguishable without any genetic modification (Fig. 1). Furthermore, many derivatives of these dyes are available, thus enabling colors that fit with a particular optical setup or a given biological question to be chosen (e.g. leaving room for another readout in a third color, as indicated in Fig. S2†).
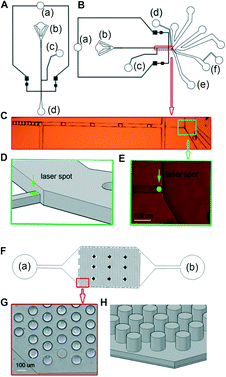
However, even though these dyes are strongly fluorescent, sensitive detection of stained cells within droplets big enough for the cultivation of cells (~100 μm in diameter12) is challenging. This is because cells can be at any position within the droplet meaning the peak values of the emitted light show high variation. For example, the cells can be closer or further away from the focal plane and/or the centre of the laser spot, resulting in variable excitation and emission intensities. Consequently, sorting of droplets according to the number of encapsulated cells becomes difficult. To overcome this limitation, we have used a sorting device in which the detection channel is not only narrower (as described previously by Cao et al.16), but also shallower compared to the rest of the chip (Fig. 2B–E). Hence, the droplets are converted to plugs and the encapsulated cells have less spatial freedom in both the y-dimension (in which the cell can be closer or further apart from the centre of the laser spot) and the z-dimension (in which the cell can be closer or further apart from the focal plane). It should be noted that designing the entire chip as a narrow and shallow channel is not feasible, as this would increase the back pressure and promote clogging at the cell inlet.
The sensitivity for detecting cells in droplets can also be increased by using high magnification objectives. However, for sorting devices with the ability to handle droplets large enough for the cultivation of mammalian cells it becomes very difficult to fit the detection point and the sorting divider into the same field of view (as required for monitoring the sorting process while optimizing all of the sorting parameters) when using a 40× objective. This is due to the fact that large droplets require large channels, but also because of the significant space requirements of the electrodes used for dieletrophoretic sorting. We have designed a very compact sorting chip in which the analysis point and the sorting divider are in the same field of view, even when using a 40× objective. This was also achieved by a 45° rotation of the electrodes relative to the channel. Furthermore, we have included additional oil inlets downstream of the constriction, but upstream of the sorting divider, to fine tune the trajectory of the droplets (Fig. 2B–E and ESI† Movie S1).
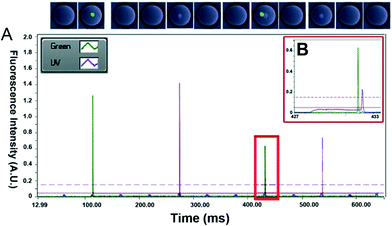
Starting with a mixed population of Calcein-AM and Calcein Violet-stained cells, we then recorded the output signals of droplets passing the detection point and optimized the sorting software. A particular challenge was the implementation of an algorithm capable of precisely determining the number of green and violet peaks within each droplet. The signals are noisy and always fluctuate a bit (Fig. S3†), meaning that a simple determination of the inflection point in order to detect peaks would cause many false positive results. We have overcome this problem by using two different thresholds, separated by the maximum noise observed in the output signals. When the signal crosses the higher threshold, this indicates that a cell has been detected and, in order to avoid a single peak being recognized as multiple cells due to noise, the lower threshold is used to signify the end of a peak (Fig. 3A and B). However, an issue with this technique involves the case when two cells of a particular dye are extremely close within a single droplet. When this occurs, the signal does not fall below the lower threshold as the laser spot passes between the cells and the signal is processed as a single cell/peak (Fig. S4†). Therefore, active thresholds were required which had the ability to detect a percentage drop in the output signal allowing small decreases in the output signal to be detected that exceeded the maximum noise in the signal, although this is still a limitation when cells are clumped together. This allows for the number of local maxima of a number of different colors to be detected and counted. This information, combined with user input data specifying the expected width and spacing of single droplets (based on the input flow rates), the range of the output signal peaks as well as the number of cells of different types that are desired to be sorted, allows for effective control of the sorting process.
To verify this, we performed a sorting experiment starting with the encapsulation of a 1![[thin space (1/6-em)]](https://www.rsc.org/images/entities/char_2009.gif) :
:![[thin space (1/6-em)]](https://www.rsc.org/images/entities/char_2009.gif) 1 mixture of the two differently stained hybridoma cell populations using a density of 1.5 × 10⁶ cells, each (Fig. 1). The resulting emulsion was reinjected into the sorting device, and the droplets were analysed for green and violet signals (Fig. 3A).
1 mixture of the two differently stained hybridoma cell populations using a density of 1.5 × 10⁶ cells, each (Fig. 1). The resulting emulsion was reinjected into the sorting device, and the droplets were analysed for green and violet signals (Fig. 3A).
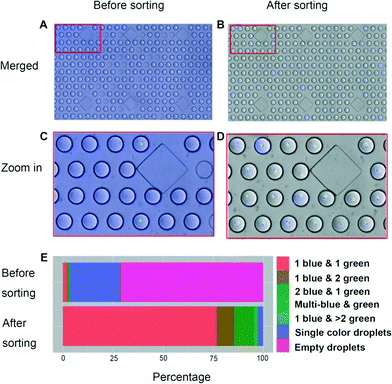
Since Calcein Violet tends to slowly leak from the stained cells, the entire droplet became visible in the respective channel. Nonetheless, the fluorescence intensity of the stained cells strongly exceeds that of the surrounding media for several hours (Fig. S5 and S6 and Movie S3†), thus enabling their reliable detection. Generally, the width of a droplet (defined as the time required to pass the laser spot12) was about 4–4.5 ms, while the width of a cell peak was about 0.15–0.3 ms (Fig. 3B) corresponding to approximately 327 μm for the deformed droplet passing through the restricted channel and a cell diameter of ~15 um. Based on their random location inside the droplet, cells showed considerably varying signal intensities. However, the spatial constraints imposed by the narrow and shallow detection channel at least ensured that all cell signals were significantly above background, thus enabling their reliable detection. Sorting gates were applied, including the information that peaks separated by less than 10 ms should be assigned to the same droplet (based on a droplet spacing of at least 30 ms) and the droplets were sorted at a maximal rate of ~40 Hz (ESI† Movie S2). For determining the sorting efficiency, samples were injected into a third microfluidic chip comprising hundreds of individual droplet traps and analysed microscopically (Fig. 2F–H). While before the sort only 2.2% of the droplets contained exactly one cell of each type, they could be enriched to 76.7% after sorting (Table S1, Fig. 4 and S7†). Similarly, the percentage of droplets containing at least one cell of each type could be increased from 3.5% to 97.6%.
To determine the limitations of the technology, we also analysed the PMT data during detection of the non-sorted droplets. This data is restricted to occupied droplets, but it allows the relative distribution between the differently occupied droplets to be compared. A close look reveals that the PMT data tends to underestimate the fraction of droplets hosting more than one cell (Fig. S8†). To test if this is due to the formation of cell clumps, we repeated the experiments with less sticky Jurkat suspension cells, added 0.2% Pluronic F68 and indeed obtained higher enrichment: the number of droplets hosting exactly one cell of each population (stained green and violet as for the previous experiments) could be increased from 2.8% before sorting to 86.7% after sorting (Table S1 and Fig. S9†). Furthermore, the percentage of droplets containing at least one cell of each type could be increased from 4.9% to 93.5%. This clearly shows that cell individualization, rather than the sorting technology, is a limiting factor of our approach. Cell separation could probably be improved for adherent cells, too, either by addition of detergents such as Pluronic F68 or by using optimized cell separation protocols.17
A further limitation of the sorting efficiency is droplet stability: we occasionally observed the presence of fused droplets, which can get split in the detection channel. In this case, multiple insufficiently spaced droplets with different droplet occupancies arrive at the sorting junction, collide and cause sorting errors (e.g. the sorting of empty droplets as shown in Table S1†), either by the collection of more than one droplet during a single electric pulse sent to the electrodes, or by direct displacement of individual droplets into the collection channel. This can potentially be limited further by using other surfactants,18 such as Pico-Surf 2 (Sphere Fluidics), for which we observed increased droplet stability in other experiments.
Conclusions
We have established a method for the specific selection of droplets hosting two different cell types. This should be of special interest for antibody screens involving assays with more than one cell and/or immunology studies. For example, the approach should enable the reliable co-encapsulation of an antibody-secreting cell and one or more reporter cells mediating a change in fluorescence upon the desired effect of an antibody. This is of particular interest for loss of function screens (e.g. the fluorescence signal of the reporter cell is lost upon inhibition of a surface receptor) in which a droplet with the desired assay outcome, as well as a droplet simply lacking a reporter cell, show the same readout signal, thus generating many false positives. This can be overcome by sorting for droplets with at least one reporter cell. The throughput of the system described here (up to ~40Hz) is almost identical to that of previously published antibody screening platforms3 and should hence not be a limiting factor. Furthermore, the assay readout could be directly performed in parallel, using a third color (e.g. red when using the cell staining procedure shown here). This is feasible as long as the assay duration is only a few hours and hence shorter than the time required for complete leakage of the marker dye from the stained cells. Long-term studies are possible too, but require a separate sorting for occupancy (e.g. directly upon droplet generation as shown here) and assay readout (e.g. upon reinjection after several days12). Taken together, this should open the way for the screening of antibodies modulating G protein-coupled receptors (GPCRs) comprising the targets of most best-selling drugs and about 40% of all prescription pharmaceuticals.19Furthermore, the system described here can be used for microscopic analysis of pairwise cell–cell interactions. These are fundamental for a variety of biological processes including tissue formation, immune system maturation, immune defence against cancer cells and pathogens, and bacteria communications.20 A microfluidic droplet, loaded with two types of cells in an isolated space, mimics a niche environment enabling detailed studies on pair-wise cell–cell interactions on the single-cell level, including studies on heterogeneity. When trapping the sorted droplets in a specific imaging chip, the cells sediment and all align within the same focal plane, thus facilitating high content imaging. The imaging chip used here can host a total of 824 droplets, but this could be easily scaled up to thousands of droplets using standard 3- or 4-inch wafers during the lithography process. Very powerful microfluidic platforms for the analysis of pairwise cell–cell interactions have been described previously,11,21,22 but the system shown here offers some particular advantages: first of all, the compartmentalization in droplets results in high concentrations of factors secreted by single cells, which are highly relevant in cell communication.20 Second, our approach does not require specific solutions for cells of different sizes (as long as they fit into the droplet). This could even allow the co-encapsulation of single bacteria and human cells into the same droplet, thus facilitating studies on host pathogen interactions or studies on synergistic systems such as the human gut microbiome.23 Taken together, we envisage many possible applications of the technology presented here, paving the way for detailed analysis of cell–cell interactions at large scale.
References
- H. N. Joensson, M. L. Samuels, E. R. Brouzes, M. Medkova, M. Uhlen, D. R. Link and H. Andersson-Svahn, Angew. Chem., Int. Ed., 2009, 48, 2518–2521 CrossRef CAS PubMed.
- E. Brouzes, M. Medkova, N. Savenelli, D. Marran, M. Twardowski, J. B. Hutchison, J. M. Rothberg, D. R. Link, N. Perrimon and M. L. Samuels, Proc. Natl. Acad. Sci. U. S. A., 2009, 106, 14195–14200 CrossRef CAS PubMed.
- B. El Debs, R. Utharala, I. V. Balyasnikova, A. D. Griffiths and C. A. Merten, Proc. Natl. Acad. Sci. U. S. A., 2012, 109, 11570–11575 CrossRef CAS PubMed.
- M. Najah, R. Calbrix, I. P. Mahendra-Wijaya, T. Beneyton, A. D. Griffiths and A. Drevelle, Chem. Biol., 2014, 21, 1722–1732 CrossRef CAS PubMed.
- D. J. Eastburn, A. Sciambi and A. R. Abate, Anal. Chem., 2013, 85, 8016–8021 CrossRef CAS PubMed.
- K. Leung, H. Zahn, T. Leaver, K. M. Konwar, N. W. Hanson, A. P. Page, C. C. Lo, P. S. Chain, S. J. Hallam and C. L. Hansen, Proc. Natl. Acad. Sci. U. S. A., 2012, 109, 7665–7670 CrossRef CAS PubMed.
- A. M. Klein, L. Mazutis, I. Akartuna, N. Tallapragada, A. Veres, V. Li, L. Peshkin, D. A. Weitz and M. W. Kirschner, Cell, 2015, 161, 1187–1201 CrossRef CAS PubMed.
- E. Traggiai, S. Becker, K. Subbarao, L. Kolesnikova, Y. Uematsu, M. R. Gismondo, B. R. Murphy, R. Rappuoli and A. Lanzavecchia, Nat. Med., 2004, 10, 871–875 CrossRef CAS PubMed.
- H. Hu, J. Voss, G. Zhang, P. Buchy, T. Zuo, L. Wang, F. Wang, F. Zhou, G. Wang, C. Tsai, L. Calder, S. J. Gamblin, L. Zhang, V. Deubel, B. Zhou, J. J. Skehel and P. Zhou, J. Virol., 2012, 86, 2978–2989 CrossRef CAS PubMed.
- S. N. Christo, K. R. Diener, R. E. Nordon, M. P. Brown, H. J. Griesser, K. Vasilev, F. C. Christo and J. D. Hayball, Sci. Rep., 2015, 5, 7760 CrossRef CAS PubMed.
- B. Dura, S. K. Dougan, M. Barisa, M. M. Hoehl, C. T. Lo, H. L. Ploegh and J. Voldman, Nat. Commun., 2015, 6 Search PubMed.
- J. Clausell-Tormos, D. Lieber, J. C. Baret, A. El-Harrak, O. J. Miller, L. Frenz, J. Blouwolff, K. J. Humphry, S. Koster, H. Duan, C. Holtze, D. A. Weitz, A. D. Griffiths and C. A. Merten, Chem. Biol., 2008, 15, 427–437 CrossRef CAS PubMed.
- E. W. M. Kemna, R. M. Schoeman, F. Wolbers, I. Vermes, D. A. Weitz and A. van den Berg, Lab Chip, 2012, 12, 2881–2887 RSC.
- A. R. Abate, C. H. Chen, J. J. Agresti and D. A. Weitz, Lab Chip, 2009, 9, 2628–2631 RSC.
- T. P. Lagus and J. F. Edd, RSC Adv., 2013, 3, 20512–20522 RSC.
- Z. N. Cao, F. Y. Chen, N. Bao, H. C. He, P. S. Xu, S. Jana, S. H. Jung, H. Z. Lian and C. Lu, Lab Chip, 2013, 13, 171–178 RSC.
- C. M. Edwards, S. Heptinstall and K. C. Lowe, Artif. Cells, Blood Substitutes, Immobilization Biotechnol., 1997, 25, 493–499 CrossRef CAS.
- J. C. Baret, Lab Chip, 2012, 12, 422–433 RSC.
- S. P. Andrews, G. A. Brown and J. A. Christopher, ChemMedChem, 2014, 9, 256–275 CrossRef CAS PubMed.
- S. A. Voloshin and A. S. Kaprelyants, Biochemistry, 2004, 69, 1268–1275 CAS.
- C. Ma, R. Fan, H. Ahmad, Q. H. Shi, B. Comin-Anduix, T. Chodon, R. C. Koya, C. C. Liu, G. A. Kwong, C. G. Radu, A. Ribas and J. R. Heath, Nat. Med., 2011, 17, 738–743 CrossRef CAS PubMed.
- M. Abonnenc, M. Borgatti, E. Fabbri, R. Gavioli, C. Fortini, F. Destro, L. Altomare, N. Manaresi, G. Medoro, A. Romani, M. Tartagni, E. Lo Monaco, P. Giacomini, R. Guerrieri and R. Gambari, J. Immunol., 2013, 191, 3545–3552 CrossRef CAS PubMed.
- A. Zelezniak, S. Andrejev, O. Ponomarova, D. R. Mende, P. Bork and K. R. Patil, Proc. Natl. Acad. Sci. U. S. A., 2015, 112, 6449–6454 CrossRef CAS PubMed.
Footnotes |
| † Electronic supplementary information (ESI) available. See DOI: 10.1039/c5lc00686d |
| ‡ These authors contributed equally. |
| This journal is © The Royal Society of Chemistry 2015 |


