
 Open Access Article
 This Open Access Article is licensed under a Creative Commons Attribution-Non Commercial 3.0 Unported Licence
Sample loss in asymmetric flow field-flow fractionation coupled to inductively coupled plasma-mass spectrometry of silver nanoparticles†
Carina A.
Sötebier
*a,
Frank S.
Bierkandt
a,
Steffi
Rades
a,
Norbert
Jakubowski
a,
Ulrich
Panne
ab and
Steffen M.
Weidner
a
aBAM Federal Institute for Materials Research and Testing, Richard-Willstätter-Straße 11, 12489 Berlin, Germany. E-mail: carina.soetebier@bam.de
bHumboldt-Universität zu Berlin, Department of Chemistry, Brook-Taylor-Str. 2, 12489 Berlin, Germany
First published on 13th August 2015
Abstract
In this work, sample losses of silver nanoparticles (Ag NPs) in asymmetrical flow field-flow fractionation (AF4) have been systematically investigated with the main focus on instrumental conditions like focusing and cross-flow parameters as well as sample concentration and buffer composition. Special attention was drawn to the AF4 membrane. For monitoring possible silver depositions on the membrane, imaging laser ablation coupled to inductively coupled plasma mass spectrometry (LA-ICP-MS) was used. Our results show that the sample residue on the membrane was below 0.6% of the total injected amount and therefore could be almost completely avoided at low sample concentrations and optimized conditions. By investigation of the AF4 flows using inductively coupled plasma mass spectrometry (ICP-MS), we found the recovery rate in the detector flow under optimized conditions to be nearly 90%, while the cross-flow, slot-outlet flow and purge flow showed negligible amounts of under 0.5%. The analysis of an aqueous ionic Ag standard solution resulted in recovery rates of over 6% and the ionic Ag content in the sample was found to be nearly 8%. Therefore, we were able to indicate the ionic Ag content as the most important source of sample loss in this study.
Introduction
Due to their extraordinary antibacterial properties, silver nanoparticles (Ag NPs) have found a broad application in consumer products ranging from washing machines to clothing and even baby bottles.1 Consequently, an increasing exposure of Ag NPs to humans and the environment must be assumed.2,3 Since the mechanisms of the antibacterial effect are not fully understood, concerns about potential release into the environment arise.4 Once the nanoparticles enter biological cells, different approaches suggest a release of Ag ions5–8 and thereby the formation of reactive oxygen species6,8,9 combined with damage of the cell membrane.5,10,11Recent regulations about the definition of NPs, their use and labelling in cosmetic products and food packaging materials have emerged, resulting in a research interest in both their characterization and toxicity. Based on the recommendation of the European Commission (2011/696/EU) and the ISO/TS 80004-1 norm, “Nanomaterials” (NMs) are defined as materials containing a minimum of 50% of particles with a size between 1 and 100 nm in at least one dimension. Since this definition is already applied in the EU cosmetic product regulation, which states that cosmetic products containing NMs must be notified to a commission, the analysis of NMs is still crucial.
A variety of instrumentation is currently used for the size determination of NPs and compared in different reviews.12–14 Many of these techniques are not applicable when investigating samples with a complex matrix, mixtures in terms of size and elemental composition, particles having a broad size distribution or low NP concentrations. Dynamic light scattering (DLS), for example, can only be applied to determine narrow distributed or monodisperse particle systems with higher concentration.14 Other techniques, such as transmission electron microscopy (TEM) or secondary electron microscopy (SEM), might be hampered by particle agglomeration or aggregation during the sample preparation procedure.15 X-ray techniques, for instance small angle X-ray scattering (SAXS), are limited to particles smaller than 50 nm in diameter.16 A simple and fast way for the characterization of particles with a diameter greater than approximately 20 nm is inductively coupled plasma mass spectrometry (ICP-MS) in the single particle detection mode.17,18
The use of hyphenated techniques, such as separation techniques coupled to elemental detectors, is growing due to their ability to obtain simultaneously particle size and multi-elemental information. Separation techniques include size exclusion chromatography (SEC), hydrodynamic chromatography (HDC), and field-flow fractionation (FFF). Whereas SEC has a limited size separation range, HDC has the lowest separation power of these three techniques but can also be used to detect the ionic fraction. In this work, size separation was performed using asymmetrical flow field-flow fractionation (AF4). AF4 is frequently applied for the separation of nanoparticles due to its high separation power, broad size separation range from 1 to 1000 nm (Brownian mode) and its ability to remove matrix constituents to a certain extent.12,19 Thus, for a simultaneous size characterization and quantification of the Ag NPs in suspension, the hyphenation of AF4 and ICP-MS is a promising tool. However, optimizing the separation conditions in order to achieve high recovery rates and resolution is still a challenge in AF4. Poor recovery rates for Ag NPs have been reported previously.19–23 Most of the reported recovery rates have been calculated by a comparison of common AF4 analyses with experiments performed without channel cross-flow, neglecting possible system losses.19,24–27 Several studies investigated different parameters influencing the recovery rates. Their results demonstrate that the choice of the membrane (material and pore size) and eluent (ionic strength, pH, salt content, surfactant), as well as instrumental parameters, such as the injection and focusing time and the focus flow strength, have a great effect on both the resolution and recovery rates.23,24 Bendixen et al.28 showed that the zeta potential, which depends on the choice of the membrane and the eluent, has a significant impact on the recovery rate. However, this could not completely explain the observed sample loss of up to 75%. Sample loss is generally reported to occur on the membrane surface,20,24,29 by cross-flow24 or by aggregation.25 Other authors reported that the membrane must be conditioned before the measurements by several injections of a concentrated Ag NP suspension to achieve constant recovery values with low standard deviations.26,30 Depending on the number of injected samples, an increase in the detector signal could be found.29 By comparing different membrane materials and pore sizes these authors also investigated unspecific membrane–particle interactions resulting in poor resolution and low recovery rates.
Neither a reasonable proof for Ag residues on the membrane nor an estimation of its relevance to the recovery rates has been published so far. The aim of this work was to examine sample loss and recovery rates in the AF4-ICP-MS hyphenation. Thus, systematic investigations of the sample loss in the system, e.g. through the cross-flow and/or by deposition on the membrane, have been performed. To determine the amount and the location of the Ag residue on the membrane imaging laser ablation-ICP-MS (LA-ICP-MS) has been utilized. A reference material (CRM) certified by SAXS was chosen for this study.
Experimental
Materials
Ultrapure water (18.2 Ω cm−1) was generated by a Millipore Element system (EMD Millipore, Billerica, MA, USA) equipped with a Quantum ICP Polishing Cartridge. CertiPUR grade Ag, indium (In) and lanthanum (La) elemental standards and nitric acid (p.A., 65%) were purchased from Merck (Darmstadt, Germany). The nitric acid was subboiled prior to use. As a NP sample the in-house certified reference material BAM N-001 (BAM, Berlin, Germany) with certified particle size values of d10 = 12.0 ± 1![[thin space (1/6-em)]](https://www.rsc.org/images/entities/char_2009.gif) :9; d50 = 18.5 ± 2.5 and d90 = 34.6 ± 4.8 nm (volume weighted diameter) and d10 = 6.9 ± 2.7, d50 = 12.6 ± 2.1 and d90 = 19.4 ± 2.2 nm (number weighted diameter) was used. The Ag NPs were suspended in a 0.94 mM ammonium nitrate solution and stabilized both sterically and electrostatically with Tween-20 and Tagat TO.31 Before analysis and dilution, the samples were thoroughly shaken for 5 min. To avoid aggregation or oxidation of the Ag NPs, diluted samples were stored in the dark at 4 °C and were allowed to equilibrate to ambient temperature for 5 min prior to the analysis. Polystyrene particles (Postnova Analytics, Landsberg am Lech, Germany) with mean diameters of 20 ± 2, 46 ± 2 and 102 ± 3 nm were used for the calibration of AF4. For LA-ICP-MS calibration the standard reference material NIST SRM612 (NIST, Gaithersburg, MD, USA) was used.
:9; d50 = 18.5 ± 2.5 and d90 = 34.6 ± 4.8 nm (volume weighted diameter) and d10 = 6.9 ± 2.7, d50 = 12.6 ± 2.1 and d90 = 19.4 ± 2.2 nm (number weighted diameter) was used. The Ag NPs were suspended in a 0.94 mM ammonium nitrate solution and stabilized both sterically and electrostatically with Tween-20 and Tagat TO.31 Before analysis and dilution, the samples were thoroughly shaken for 5 min. To avoid aggregation or oxidation of the Ag NPs, diluted samples were stored in the dark at 4 °C and were allowed to equilibrate to ambient temperature for 5 min prior to the analysis. Polystyrene particles (Postnova Analytics, Landsberg am Lech, Germany) with mean diameters of 20 ± 2, 46 ± 2 and 102 ± 3 nm were used for the calibration of AF4. For LA-ICP-MS calibration the standard reference material NIST SRM612 (NIST, Gaithersburg, MD, USA) was used.
Instruments
:10 with the eluent and filtered through a 0.2 μm PES syringe filter (Carl Roth GmbH + Co. KG, Karlsruhe, Germany) before the analysis. The data are intensity weighted. The pH values were determined using pH-indicator paper (Lyphan, Neuhaus am Rennweg, Germany).
| Parameter | AF4-ICP-MS | LA-ICP-MS | Total Ag concentration determination |
|---|---|---|---|
| a Dwell times were chosen as follows: off-line AF4-ICP-MS 10 ms, on-line AF4-ICP-MS 200 ms, flow injection and experiments without cross-flow 10 ms (107Ag, 109Ag) and 200 ms (115In). b Used during off-line AF4-ICP-MS experiments. | |||
| ICP-MS | iCAP Q | XSeries II | XSeries II |
| Power/W | 1550 | 1400 | 1400 |
| Nebulizer/additional gas (LA-ICP-MS) flow rate/L min−1 | 1.04–1.07 | 0.48 | 0.98 |
| Carrier gas (He)/L min−1 | — | 0.9 | — |
| Aux. gas flow rate/L min−1 | 0.8 | 0.7 | 0.7 |
| Cool gas flow rate/L min−1 | 14 | 13 | 13 |
| Dwell time/ms | 50 | 100 | |
| Isotopes monitored | 107Ag, 109Ag, 115In (or 139La)b | 107Ag, 109Ag | 107Ag, 109Ag, 115In, 139La |
For our experiments, the membranes were cut, fixed on microscopic glass slides (Thermo Fisher Scientific, Waltham, MA, USA), and mounted in the ablation cell, which can be moved in the xyz-direction relative to the laser beam. The samples were ablated with 20 Hz and a scan rate of 100 μm s−1 at a laser energy of 1.2–2 mJ. The spot size was 200 μm and the irradiance 7.6–12.7 GW cm−2. To reduce the ablation time, a complete membrane was ablated in parallel lanes with a distance of 1–3 mm. To image and quantify the residue, the first part of the membrane was completely ablated in parallel, adjacent line scans with a lane distance of 175 μm. The formed aerosol was transported by a He carrier gas flow from the cell to the ICP-MS, where an additional Ar gas flow was introduced prior to the atomization and ionization in the plasma. Since the analyzed membrane areas were too large to be ablated in one session, each membrane was ablated in consecutive sessions. Blank and background correction were performed for the quantification experiments. A dried droplet calibration was used for quantification (see the section ‘Sample preparation’). The detected ICP-MS line scans were merged to a contour plot.
The used conditions were tested on the membrane before analysis to assure the complete coverage of the surface. Under the applied laser parameters the membranes, which consist of two layers, were not completely ablated but only the cellulose bottom layer remained. Ablation of the polymer top layer led to deposition of a black residue on the inside of the ablation cell glass. To prevent absorption of the laser by this residue and thus the impairment of the membrane ablation, regular cleaning was necessary.
Sample preparation
:100 in 2% nitric acid to a final concentration of 10 μg L−1 La. An aqueous Ag standard solution was used for calibration.
For fraction collection (90 s intervals) a collector (Gilson 221 XL, Gilson Inc., Middleton, WI, USA) was chosen. The fractions were acidified with 5% nitric acid and diluted with ultrapure water. An aqueous La standard solution was added for drift correction. Analysis was performed using ICP-MS. For the calibration of the Ag concentration, an aqueous Ag standard solution was used.
:1. A five point adjacent average smoothing of the on-line AF4-ICP-MS fractograms was performed using OriginLab software (OriginLab Corporation, Northampton, MA, USA).
To determine possible regions of sample loss, experiments without cross-flow were performed. In an additional experiment, the manual injection valve was directly connected to the T-piece, where the internal standard was added, thus bridging the AF4 channel. Six replicates have been analyzed for each of the two methods.
For imaging experiments, a membrane onto which Ag NPs with an absolute Ag mass of 25.0 μg had been injected over four off-line AF4-ICP-MS runs was dried. As the AF4 eluent ultrapure water containing 200 mg L−1 NaN3 was used. The membrane was cut into three smaller pieces.
For the quantification, one blank and two sample membranes were prepared. For the blank membrane 10 μL of ultrapure water and for the sample membranes 10 μL of Ag NPs with concentrations of 0.25 mg L−1 (membrane 1) and 3.13 mg L−1 Ag (membrane 2) were injected per run. Ultrapure water was used as the eluent. After ten runs, the membrane was removed from the channel and dried. The first part of the membrane, which showed the highest Ag content in the imaging experiment, was fully ablated. A length of approximately 55 mm from the sample introduction point was chosen. All ICP-MS conditions are compiled in Table 1.
Results and discussion
Size determination using AF4-UV/Vis
Before the AF4-UV/Vis analyses, the zeta potential of the Ag NPs was determined in a 10-fold dilution in ultrapure water with 200 mg L−1 NaN3 to investigate their stability during the AF4 analysis. A frequently observed behavior in our laboratory was the aggregation of Ag NPs during the experiment due to insufficient stabilization. The obtained zeta potential value of −28.33 ± 2.7 mV for ultrapure water with 200 mg L−1 NaN3, shown in Table 2, is considered slightly stable with only few aggregates, whereas ultrapure water gives a zeta potential of −18.0 ± 1.3 mV indicating potential agglomerates.35| Hyphenation | Eluent | Zeta potential/mV | Conductivity/mS cm−1 | pH | Hydrodynamic diameter (DLS)/nm | Peak width (DLS)/nm |
|---|---|---|---|---|---|---|
| Off-line | Ultrapure water with 200 mg L−1 NaN3 | −28.3 ± 2.7 | 0.319 ± 0.006 | 7 | 49.5 ± 2.0 | 26.7 ± 5.9 |
| On-line | Ultrapure water | −18.0 ± 1.3 | 0.023 ± 0.003 | 7 | 51.1 ± 2.1 | 30.4 ± 6.2 |
The AF4 fractogram in Fig. 1 of the Ag NPs using UV/Vis detection showed a single peak with a retention time of 17.8 ± 0.1 min. The size determination should ideally be performed with reference materials of a known size and the same elemental composition. There is only one size-certified Ag NP reference material currently available in the market. This material is regarded as a sample in this work as reliable AF4 data are still lacking. For statistically firm results, a calibration curve must contain at least three standards. Therefore, the calibration of the hydrodynamic diameter was performed using polystyrene particle standards, which had been proven to be suitable calibration standards for AF4 analyses in previous studies.28,36 However, under the used conditions a non-optimal behavior was detected as an exponential calibration curve was obtained as shown in Fig. 1. A possible reason might be a repulsion of the larger particles and the membrane. As calibration standards with a Tween-20 and Tagat TO coating, which has the same AF4 behavior as the sample, are lacking, the size determination performed in this work was considered to be an estimation. Retention times for the polystyrene standards were 13.9 ± 0.4, 21.5 ± 0.5 and 27.8 ± 0.3 min for the 20, 46 and 102 nm particles, respectively.
 | ||
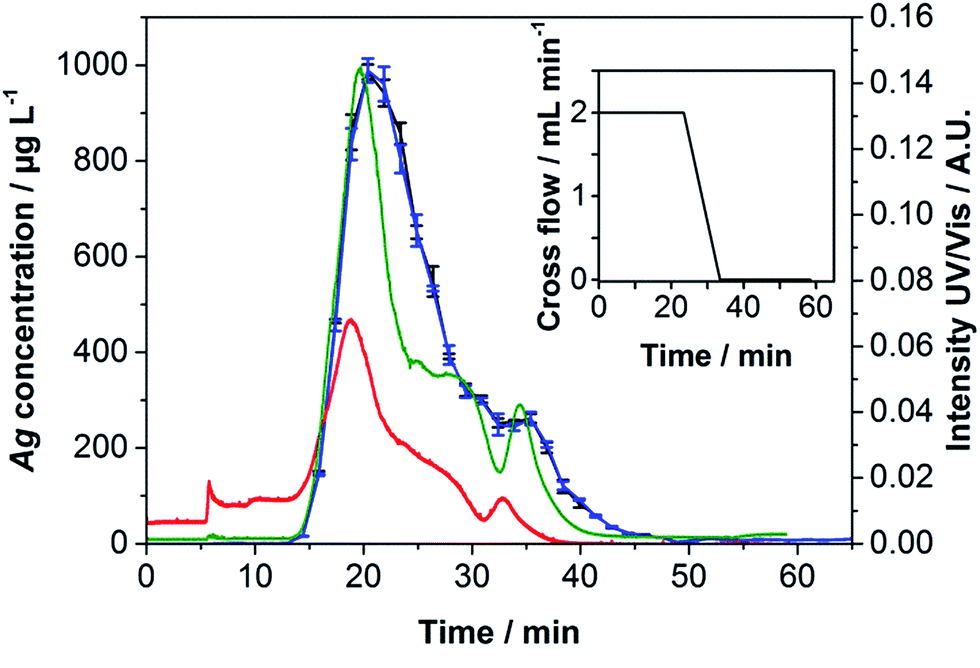
| Fig. 1 UV/Vis fractogram of the Ag NPs (blue line, λ = 430 nm) calibrated with three polystyrene standards (black line, λ = 254 nm). The resulting calibration curve (red line) and used cross-flow profile (black line, small graph) are given. The absolute injected mass was 6.3 μg Ag. | ||
Applying the calibration shown in Fig. 1, a hydrodynamic size of 28.82 ± 0.21 nm was calculated for the Ag NPs at their peak maximum. Fig. 1 shows a slight peak shoulder. According to the certified SAXS values, Ag core diameters of d10 = 12.0 ± 1:9; d50 = 18.5 ± 2.5 and d90 = 34.6 ± 4.8 nm (volume weighted) were determined indicating a distribution with a tailing to larger particle sizes. Using dynamic light scattering a diameter of 49.51 ± 1.95 nm was obtained (see Table 2). Since larger particles scatter light with a higher intensity, their influence on the resulting diameter is much higher than that of smaller ones. This finding is in good agreement with data displayed in Fig. 1. Scanning electron microscopy measurements in transmission mode (T-SEM) resulted in a particle diameter of 15 ± 5 nm (number weighted), which is in good agreement with the certified SAXS values of d10 = 6.9 ± 2.7, d50 = 12.6 ± 2.1 and d90 = 19.4 ± 2.2 nm (number weighted). A T-SEM image, illustrating a presumably at least bimodal distribution, can be found in Fig. S1 in the ESI.† To determine whether the NPs showed a large polydispersity or a bimodal distribution, a gradient with a higher cross-flow and a longer linear cross-flow region was applied. The result in Fig. 2 clearly depicts a higher peak resolution. As the peak shoulder already shown in Fig. 1 can be further separated from the main peak, Fig. 2 supports the assumption of an at least bimodal distribution. A good agreement between the UV/Vis and ICP-MS fractograms was obtained.
 | ||
| Fig. 2 Fractogram of Ag NPs using the modified cross-flow gradient (black line, small graph). Fractions for ICP-MS experiments were collected in intervals of 90 s. Black and blue lines – amount of 107Ag and 109Ag, red and green lines – UV/Vis intensities at 254 and 430 nm. The absolute injected mass was 6.3 μg Ag. | ||
Off-line AF4-ICP-MS experiments
The determination of the total Ag concentration in the Ag NP sample using acid digestion followed by ICP-MS analysis resulted in a concentration of 62.5 ± 1.2 mg L−1. Based on this value, the recovery rate of the off-line AF4-ICP-MS analysis (see Fig. 2) was 40.7 ± 0.4%.A potential sample loss could be expected on the walls of the vials used for the fraction collection as well as through the cross-flow. Therefore, the complete detector flow was collected in a batch. Additionally, the Ag concentration in the cross-flow, slot-outlet flow and purge flow was determined. In Table 3, the concentrations and recovery rates of all analyzed flows are given. A scheme visualizing the different AF4 flows can be found in the ESI (Fig. S2†).
| Flow | Ag amount/ng | Recovery rate/% |
|---|---|---|
| Detector flow | 3478.98 ± 51.49 | 55.65 ± 0.82 |
| Cross-flow | 0.75 ± 0.01 | 0.012 ± 0.001 |
| Slot-outlet flow | 28.85 ± 0.29 | 0.462 ± 0.005 |
| Purge flow | 1.55 ± 0.10 | 0.025 ± 0.002 |
These results show that the sample losses through the cross-flow, slot-outlet flow and purge flow were negligible compared to the value of the detector flow and the total Ag concentration of the Ag NPs. An increased recovery rate compared to the fractionation experiment was also found. A possible explanation could be the drastic reduction of vial surface area.
Investigation of sample loss on the membrane
Since separation in the AF4 is based on a channel that is equipped with a membrane, another possible reason for the sample loss could be the adsorption of Ag NPs on the membrane. A 5 kDa PES membrane, which has been used for four off-line AF4-ICP-MS runs with a total injection mass of 25.0 μg Ag, was analyzed by LA-ICP-MS. This technique also allows the localization of the Ag residue.The scan in Fig. 3 shows that Ag was found on the membrane. The highest Ag intensities were detected close to the injection point (A). High intensities were also found at the focusing point (B) and on the channel edge.
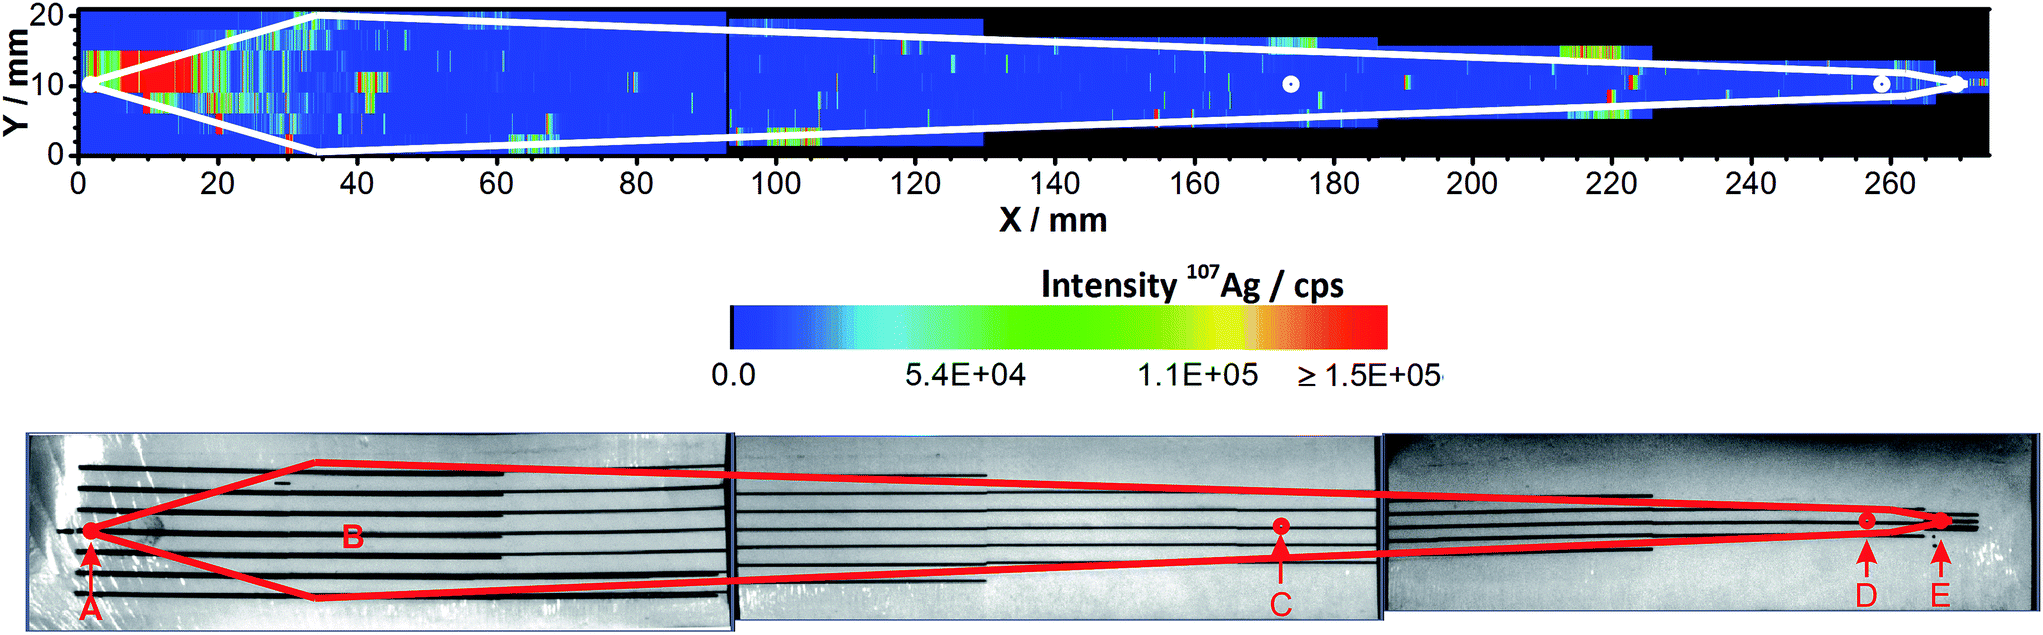 | ||
| Fig. 3 LA-ICP-MS contour plot of 107Ag (top) and photograph (bottom) of the completely ablated membrane, both with a marked channel profile. Areas not ablated are depicted in black (top). Small dots represent (A) tip flow inlet and sample injection point, (B) focusing point, (C) focus flow inlet, (D) slot-outlet and (E) detector flow outlet. | ||
In order to avoid the sample residue on the membrane, several parameters were optimized. The sample concentration, for example, plays an important role in terms of overloading effects37 and a too long focusing time can cause losses of low molecular weight material.38 Experiments performed in our laboratory varying the focusing time and the sample load did not result in an increase of the recovery rate or have an influence on the fractogram (results not shown here). Therefore overloading effects can be excluded. On-line AF4-ICP-MS hyphenation was chosen to prevent potential sample loss on vial surfaces and drastically reduce the analysis time. For the on-line experiments, a reduction of the total injected Ag mass was necessary. Therefore, a shorter focus time was chosen. As the interaction of the sample with the membrane is proposed to be significantly based on the zeta potential,28,29 only ultrapure water was used as an eluent during the on-line measurements. Changes to the zeta potential were noticed as shown in Table 2.
On-line AF4-ICP-MS experiments
The obtained fractograms (Fig. 4) were similar to those of the off-line experiments. Only very few aggregates were detected, in spite of the higher zeta potential shown in Table 2. Bendixen et al. have already investigated the influence of the zeta potential on both the membrane and the particles and shown its importance.28 Literature states that a more negative zeta potential achieves a better stabilization of the NPs.35 However, the results obtained in this work show that the Ag NPs used here are very stable even when an eluent with a more positive zeta potential is used. The obtained results show better recovery rates, the same DLS diameters and only very few aggregates using the eluent water, which has a more positive zeta potential than 200 ppm NaN3.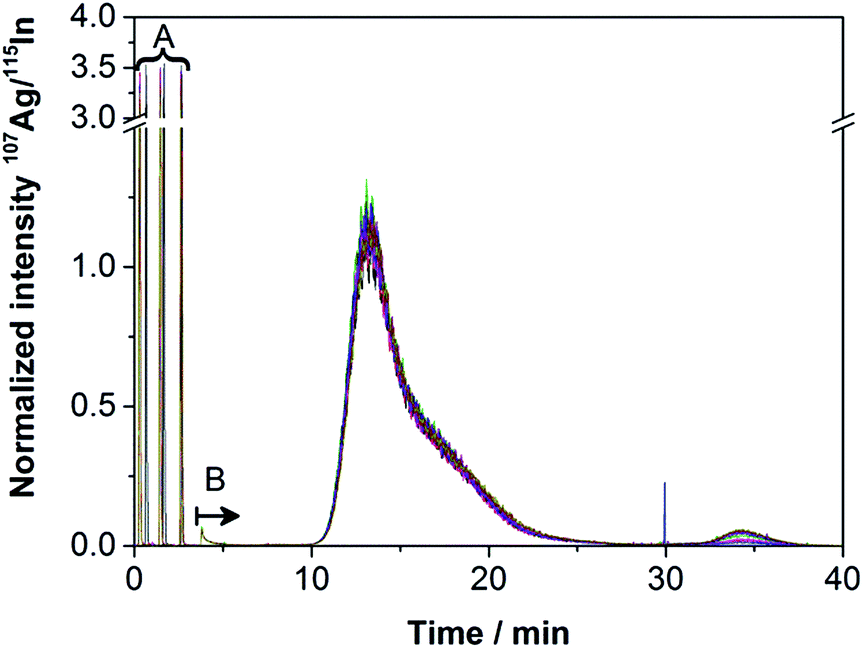 | ||
| Fig. 4 Reproducibility of smoothed fractograms of Ag NPs (absolute mass of 31.3 ng Ag injected per run, membrane 2); (A) flow injection peaks between 0 and 3 min used for calibration, concentration 10 μg L−1, injected volume 11.53 μL; (B) AF4-elution start of the Ag NPs. | ||
The reproducibility was determined by repeated measurements. Ten runs with an overall absolute injection mass of 25.0 (membrane 1) and 312.6 ng (membrane 2) of Ag NPs, each on a fresh membrane, were performed. Fig. 4 shows the fractograms obtained for membrane 2.
The fractograms of the ten runs performed on each of the two membranes 1 and 2 show a good reproducibility. Even though the zeta potential of the particles using the eluent water is considered to be less stable than the zeta potential using ultrapure water containing 200 mg L−1 NaN3 as an eluent (see Table 2), higher recovery rates of over 87% were obtained. An increase of the recovery rate has been detected from run 1 to 3, stabilizing from run 3 on for membrane 2. Membrane 1, onto which the lower concentration had been injected, showed constant recovery rates over all ten runs. In this work, we could not confirm that the membrane must generally be conditioned until the recovery rates do not increase further as shown before.26,29,30 This effect was only found for the slightly higher concentration of 31.3 ng injected per run.
As illustrated in Fig. 4, the amount of potential sample loss through the void peak (3.81 ± 0.01 min) and potential aggregates (33.62 ± 1.61 min) was negligible. Slight differences between the membranes were observed concerning the resolution of the shoulder peak, retention time, recovery rate and LOD as Table 4 shows.
| Membrane | Total injected amount of Ag/ng | Retention time/min | Concentration/mg L−1 | Recovery rate (%) | LOD/μg L−1 |
|---|---|---|---|---|---|
| 1 | 25.0 | 12.8 ± 0.3 | 56.19 ± 1.07 | 89.88 ± 1.72 | 0.25 ± 0.01 |
| 2 | 312.6 | 13.2 ± 0.1 | 54.40 ± 2.63 | 87.02 ± 4.21 | 0.47 ± 0.03 |
The recovery rates obtained by experiments without applied cross-flow and flow injection bridging the AF4 were 88.09 ± 2.78% and 92.92 ± 2.70%, respectively. This indicates that the sample loss through the application of the cross-flow is insignificant in this case. A sample loss of 4.83% Ag must occur in the AF4 system even when no separation force is applied.
Quantification of the Ag residue on the membrane
To determine the amount of Ag residue on the membrane, a calibration of the ICP-MS intensity was performed using seven Ag NP concentrations and an additional blank. These suspensions were pipetted (0.5 μL), each in quintuplicates, on a fresh membrane and dried. The results of the measurements of the blank and six calibration droplets are shown in Fig. 5.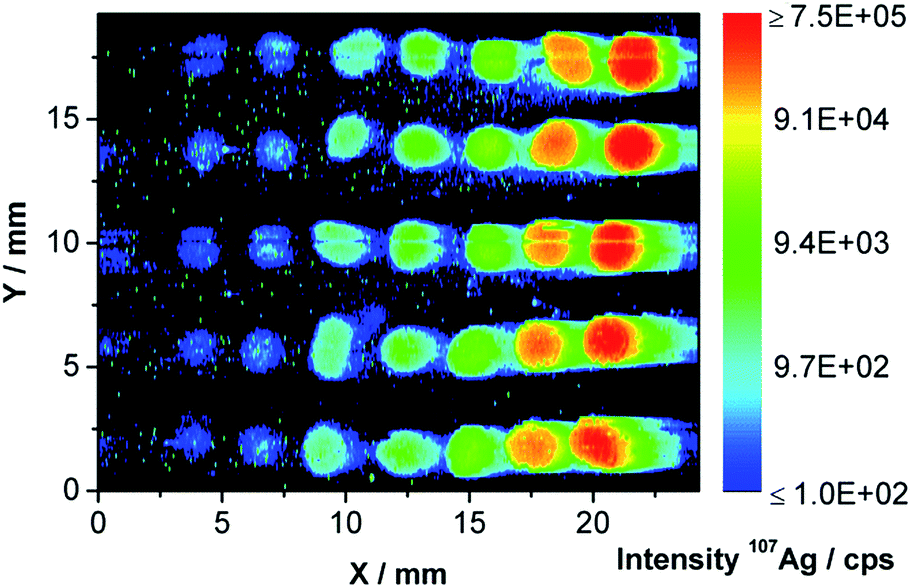 | ||
| Fig. 5 LA-ICP-MS contour plot of 107Ag for the calibration using a concentration series of the Ag NPs starting with a blank (left) and increasing concentrations to the right (logarithmic scale). | ||
As expected, the blank droplet (at about 1.5 mm) cannot be differentiated from the background. A linear calibration curve with a limit of detection of 4.2 pg was obtained (see Fig. S3† in the ESI). The first part of the membrane was completely ablated as Fig. 6 shows for the blank (Fig. 6a) and membrane 2 (Fig. 6b). A total Ag NP content of 312.6 ng Ag has been injected over ten on-line AF4-ICP-MS runs on the membrane.
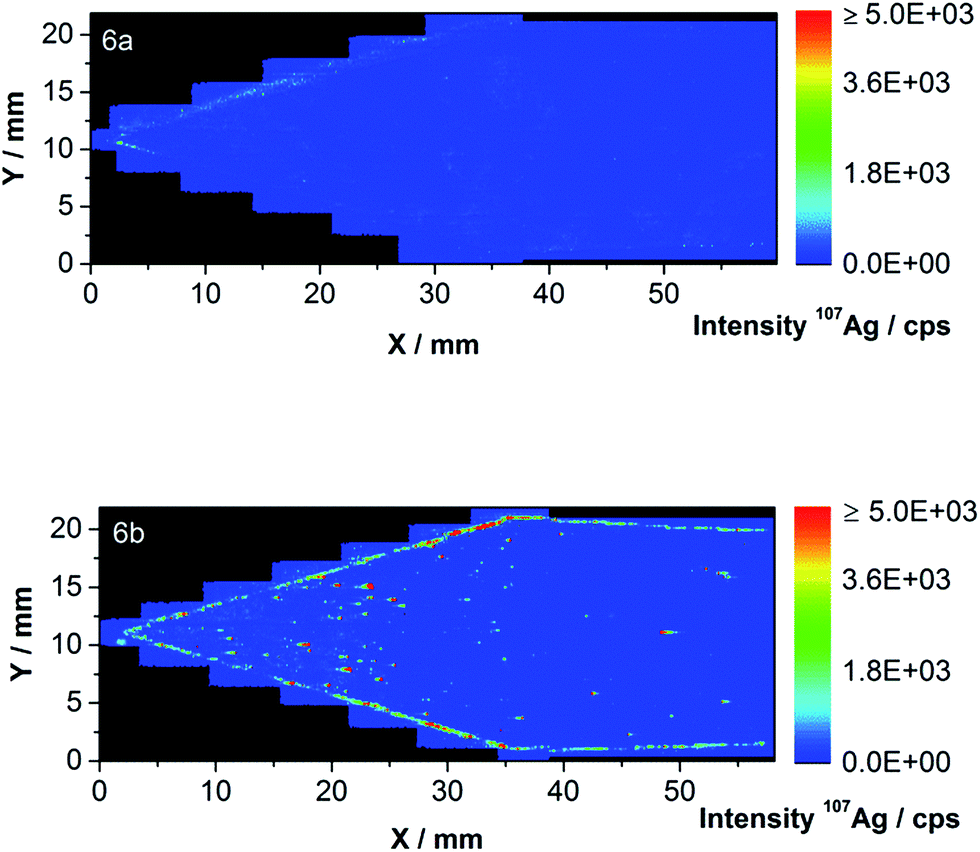 | ||
| Fig. 6 (a and b) LA-ICP-MS contour plots of 107Ag of the first part of the blank membrane (a) and membrane 2 (b) including the sample injection and focus point. | ||
The highest intensities were found close to the sample injection point and on the channel edge. During the injection/focusing step of the AF4 method, a tip flow of 0.2 mL min−1, a focus flow of 2.8 mL min−1 and a cross-flow of 2 mL min−1 were applied. The focus flow carries the NPs toward the channel top whereas the cross-flow pulls the particles close to the membrane resulting in the pattern illustrated in Fig. 6b.
After the blank correction, values of 1.10 × 10⁻³ ng Ag mm−2 for the inner area and 1.09 × 10⁻² ng Ag mm−2 for the channel edge have been found. The total amount of Ag was found to be 1.81 ng on the membrane part shown in Fig. 6b. This amount could be split into 0.71 and 1.10 ng Ag on the inner area and the channel edge, respectively. A total sample loss of 0.58% Ag was therefore detected to occur in the first part of the ablated membrane.
In order to determine whether the deposition of silver on the membrane depends on the concentration of the sample, a membrane onto which a 12.5-fold lower total Ag mass of 25.0 ng has been injected (10 runs) was ablated (membrane 1). The results showed 6.74- and 7.34-times lower amounts of Ag residue on the inner area and the channel edge, respectively (results not shown).
Injection of an aqueous Ag standard solution
Previous observations in our laboratory showed that ionic Ag, when not acidified, is not stable in solution and can interact with the used polyetheretherketone (PEEK) capillaries, vials and AF4 membranes. Therefore, the concentration of Ag ions in the Ag NP sample was determined by ultrafiltration. A concentration of 4.94 ± 0.08 mg L−1 of Ag, resulting in a recovery rate of 7.87 ± 0.10%, was found in the filtrate. Since the molecular weight of the 10 kDa pores corresponds to a spherical diameter of 3.5 nm,39 it is assumed that the eluent contains only ionic Ag. Subsequently, 100 μL of an aqueous Ag standard solution with a concentration of 10 mg L−1 was injected into the AF4. The eluting sample flow, cross-flow, slot-outlet flow and purge flow were collected and analyzed. The determined concentrations and recovery rates are shown in Table 5.| Flow | 107Ag/ng L−1 | 107Ag (%) |
|---|---|---|
| Detector flow | 190.13 ± 6.79 | 0.42 ± 0.02 |
| Cross-flow | 58.13 ± 1.60 | 0.33 ± 0.01 |
| Purge flow | 227.72 ± 10.89 | 0.32 ± 0.02 |
| Slot-outlet flow | 1121.04 ± 19.05 | 5.05 ± 0.09 |
| Total recovery rate | 6.12 ± 0.13 |
The analysis of the ionic Ag standard solution using off-line AF4-ICP-MS provides a combined recovery rate of 6.12 ± 0.13%. Over 93% of the ionic Ag is lost due to precipitation or adsorption caused by the lack of stabilizing ligands in the eluent. Losses could occur on both the vial walls and in the AF4 system.
As the ionic Ag concentration in the sample was found to be 7.87 ± 0.10%, dissolved Ag and dissolution of the nanoparticles could be an important source for low recovery rates.
Conclusions
In this work, we have investigated recovery rates and possible sources of sample loss during AF4-ICP-MS experiments. For the first time LA-ICP-MS imaging of AF4 membranes was performed to identify the sources of sample loss. For a better comparability between the two completely ablated membrane pieces, the same channel areas for integration were chosen. Our work demonstrated that sample loss does occur on the AF4 membrane and is located close to the sample injection point and the channel edges. However, under optimized conditions interactions with the membrane are negligible. A concept of quantification of the Ag residue on the membrane using a matrix-matched dried droplet calibration was successfully applied for the LA-ICP-MS experiments. A correlation coefficient of R2 = 0.988 was achieved for the calibration curve (see Fig. S3†). Nevertheless, a great challenge is still the internal standardization for LA-ICP-MS. During the LA-ICP-MS experiments performed in this work, no internal standard was used. Test measurements of the calibration droplets containing an aqueous Lu standard solution as a drift correction standard for both the laser and the ICP-MS showed deficient results. The ionic solution resulted in much larger droplet sizes than the NPs. As comparable homogeneities and a similar behavior on the membrane surface could not be assured, this procedure was not applicable. Other experiments of mixing an ionic internal standard into the AF4 eluent also resulted in irregularities. A method for internal standardization is therefore still lacking but needs to be developed for future experiments.Analyses also showed that losses through the cross-flow do not have a great impact on the recovery rates for the conditions employed here. The greatest amount of sample loss was found to be due to insufficiently stabilized ionic Ag present in the sample. It is therefore essential to determine its amount and avoid Ag NP dissolution.
Recovery rates and sample loss strongly depend on the system analyzed and the conditions chosen. As only one Ag NP system under specific conditions has been investigated so far, future studies are necessary to understand sample loss completely. However, after optimization recovery rates of about 90% were achieved. The results show that AF4-ICP-MS is an excellent technique for the analysis of Ag NPs. Future studies investigating their environmental behavior applying the gained knowledge are planned.
Acknowledgements
The research leading to these results has received partial funding from the European Union Seventh Framework Programme (FP7/2007–2013) under grant agreement no. 263147 (NanoValid – Development of reference methods for hazard identification, risk assessment and LCA of engineered nanomaterials).Notes and references
- D. R. Monteiro, L. F. Gorup, A. S. Takamiya, A. C. Ruvollo, E. R. Camargo and D. B. Barbosa, Int. J. Antimicrob. Agents, 2009, 34, 103–110 CrossRef CAS PubMed.
- R. Kaegi, B. Sinnet, S. Zuleeg, H. Hagendorfer, E. Mueller, R. Vonbank, M. Boller and M. Burkhardt, Environ. Pollut., 2010, 158, 2900–2905 CrossRef CAS PubMed.
- F. Gottschalk and B. Nowack, J. Environ. Monit., 2011, 13, 1145–1155 RSC.
- H. Goenaga-Infante and E. H. Larsen, Anal. Bioanal. Chem., 2014, 406, 3831–3833 CrossRef CAS PubMed.
- A. B. Smetana, K. J. Klabunde, G. R. Marchin and C. M. Sorensen, Langmuir, 2008, 24, 7457–7464 CrossRef CAS PubMed.
- E. T. Hwang, J. H. Lee, Y. J. Chae, Y. S. Kim, B. C. Kim, B. I. Sang and M. B. Gu, Small, 2008, 4, 746–750 CrossRef CAS PubMed.
- E. Navarro, F. Piccapietra, B. Wagner, F. Marconi, R. Kaegi, N. Odzak, L. Sigg and R. Behra, Environ. Sci. Technol., 2008, 42, 8959–8964 CrossRef CAS.
- J. Y. Liu and R. H. Hurt, Environ. Sci. Technol., 2010, 44, 2169–2175 CrossRef CAS PubMed.
- J. S. Kim, E. Kuk, K. N. Yu, J. H. Kim, S. J. Park, H. J. Lee, S. H. Kim, Y. K. Park, Y. H. Park, C. Y. Hwang, Y. K. Kim, Y. S. Lee, D. H. Jeong and M. H. Cho, Nanomedicine, 2007, 3, 95–101 CrossRef CAS PubMed.
- M. J. Hajipour, K. M. Fromm, A. A. Ashkarran, D. J. de Aberasturi, I. R. de Larramendi, T. Rojo, V. Serpooshan, W. J. Parak and M. Mahmoudi, Trends Biotechnol., 2012, 30, 499–511 CrossRef CAS.
- O. Choi, K. K. Deng, N. J. Kim, L. Ross, R. Y. Surampalli and Z. Q. Hu, Water Res., 2008, 42, 3066–3074 CrossRef CAS PubMed.
- M. Hassellöv, J. W. Readman, J. F. Ranville and K. Tiede, Ecotoxicology, 2008, 17, 344–361 CrossRef PubMed.
- A. Lopez-Serrano, R. M. Olivas, J. S. Landaluze and C. Camara, Anal. Methods, 2014, 6, 38–56 RSC.
- K. Tiede, A. B. A. Boxall, S. P. Tear, J. Lewis, H. David and M. Hassellöv, Food Addit. Contam., Part A, 2008, 25, 795–821 CrossRef CAS PubMed.
- K. Tiede, S. P. Tear, H. David and A. B. A. Boxall, Water Res., 2009, 43, 3335–3343 CrossRef CAS PubMed.
- S. Pabisch, B. Feichtenschlager, G. Kickelbick and H. Peterlik, Chem. Phys. Lett., 2012, 521, 91–97 CrossRef CAS PubMed.
- D. M. Mitrano, A. Barber, A. Bednar, P. Westerhoff, C. P. Higgins and J. F. Ranville, J. Anal. At. Spectrom., 2012, 27, 1131–1142 RSC.
- F. Laborda, S. Ruiz-Begueria, E. Bolea and J. R. Castillo, J. Chromatogr. A, 2011, 1218, 4199–4205 CrossRef CAS PubMed.
- E. P. Gray, T. A. Bruton, C. P. Higgins, R. U. Halden, P. Westerhoff and J. F. Ranville, J. Anal. At. Spectrom., 2012, 27, 1532–1539 RSC.
- B. Meermann, A. L. Fabricius, L. Duester, F. Vanhaecke and T. Ternes, J. Anal. At. Spectrom., 2014, 29, 287–296 RSC.
- H. Hagendorfer, R. Kaegi, J. Traber, S. F. L. Mertens, R. Scherrers, C. Ludwig and A. Ulrich, Anal. Chim. Acta, 2011, 706, 367–378 CrossRef CAS PubMed.
- B. Schmidt, K. Loeschner, N. Hadrup, A. Mortensen, J. J. Sloth, C. B. Koch and E. H. Larsen, Anal. Chem., 2011, 83, 2461–2468 CrossRef CAS PubMed.
- M. Baalousha, B. Stolpe and J. R. Lead, J. Chromatogr. A, 2011, 1218, 4078–4103 CrossRef CAS PubMed.
- E. Bolea, J. Jimenez-Lamana, F. Laborda and J. R. Castillo, Anal. Bioanal. Chem., 2011, 401, 2723–2732 CrossRef CAS PubMed.
- S. Dubascoux, F. von der Kammer, I. Le Hecho, M. P. Gautier and G. Lespes, J. Chromatogr. A, 2008, 1206, 160–165 CrossRef CAS PubMed.
- K. Loeschner, J. Navratilova, S. Legros, S. Wagner, R. Grombe, J. Snell, F. von der Kammer and E. H. Larsen, J. Chromatogr. A, 2013, 1272, 116–125 CrossRef CAS PubMed.
- J. Gigault, T. J. Cho, R. I. MacCuspie and V. A. Hackley, Anal. Bioanal. Chem., 2013, 405, 1191–1202 CrossRef CAS PubMed.
- N. Bendixen, S. Losert, C. Adlhart, M. Lattuada and A. Ulrich, J. Chromatogr. A, 2014, 1334, 92–100 CrossRef CAS.
- A. Ulrich, S. Losert, N. Bendixen, A. Al-Kattan, H. Hagendorfer, B. Nowack, C. Adlhart, J. Ebert, M. Lattuada and K. Hungerbühler, J. Anal. At. Spectrom., 2012, 27, 1120–1130 RSC.
- S. A. Cumberland and J. R. Lead, J. Chromatogr. A, 2009, 1216, 9099–9105 CrossRef CAS PubMed.
- BAM Federal Institute for Materials Research and Testing, Certified Reference Material BAM-N001, Particle Size Parameters of Nano Silver, Berlin, Germany, 2013 Search PubMed.
- E. Moreno-Gordaliza, D. Esteban-Fernandez, C. Giesen, K. Lehmann, A. Lazaro, A. Tejedor, C. Scheler, B. Canas, N. Jakubowski, M. W. Linscheid and M. M. Gomez-Gomez, J. Anal. At. Spectrom., 2012, 27, 1474–1483 RSC.
- A.-L. Fabricius, L. Duester, B. Meermann and T. Ternes, Anal. Bioanal. Chem., 2014, 406, 467–479 CrossRef CAS PubMed.
- H. Prestel, R. Niessner and U. Panne, Anal. Chem., 2006, 78, 6664–6669 CrossRef CAS PubMed.
- L. L. Schramm, Emulsions, Foams, Suspensions, and Aerosols: Microscience and Applications, Wiley, Weinheim, Germany, 2nd edn, 2014, vol. 1, ch. 5.3.2, p. 175 Search PubMed.
- A. R. Poda, A. J. Bednar, A. J. Kennedy, A. Harmon, M. Hull, D. M. Mitrano, J. F. Ranville and J. Steevens, J. Chromatogr. A, 2011, 1218, 4219–4225 CrossRef CAS PubMed.
- J. C. Giddings, in Field-Flow Fractionation Handbook, ed. M. Schimpf, K. Caldwell and J. C. Giddings, Wiley, New York, 1st edn, 2000, vol. 1, ch. 1, p. 12 Search PubMed.
- R. N. Qureshi and W. T. Kok, LC GC Eur., 2010, 23, 18–25 CAS.
- L. R. Snyder, J. J. Kirkland and J. W. Dolan, Introduction to Modern Liquid Chromatography, Wiley, Hoboken, New Jersey, 3rd edn, 2010, vol. 1, ch. 13.3.1.1, p. 580 Search PubMed.
Footnote |
| † Electronic supplementary information (ESI) available. See DOI: 10.1039/c5ja00297d |
| This journal is © The Royal Society of Chemistry 2015 |