 Open Access Article
Creative Commons Attribution 3.0 Unported Licence
Shading in TXRF: calculations and experimental validation using a color X-ray camera
Magnus
Menzel
a,
Oliver
Scharf
b,
Stanisław H.
Nowak
b,
Martin
Radtke
c,
Uwe
Reinholz
c,
Peter
Hischenhuber
f,
Günter
Buzanich
c,
Andreas
Meyer
d,
Velma
Lopez
e,
Kathryn
McIntosh
e,
Christina
Streli
f,
George Joseph
Havrilla
e and
Ursula Elisabeth
Adriane Fittschen
*g
aInstitute for Inorganic and Applied Chemistry, University of Hamburg, Martin-Luther-King-Platz 6, 20146 Hamburg, Germany
bIFG Institute for Scientific Instruments GmbH., 12489 Berlin, Germany
cBAM – Federal Institute for Materials Research and Testing, 12489 Berlin, Germany
dInstitute for Physical Chemistry, University of Hamburg, Grindelallee 117, 20146 Hamburg, Germany
eLANL Los Alamos National Laboratory, NM 87545, USA
fAtominstitut TU Wien, 1026 Wien, Austria
gWashington State University, Pullman, WA 99164, USA. E-mail: ursula.fittschen@wsu.edu; Tel: +1-509-335-9774
First published on 14th August 2015
Abstract
Absorption effects in total reflection X-ray fluorescence (TXRF) analysis are important to consider, especially if external calibration is to be applied. With a color X-ray camera (CXC), that enables spatially and energy resolved XRF analysis, the absorption of the primary beam was directly visualized for μL-droplets and an array of pL-droplets printed on a Si-wafer with drop-on-demand technology. As expected, deposits that are hit by the primary beam first shade subsequent droplets, leading to a diminished XRF signal. This shading effect was quantified with enhanced precision making use of sub-pixel analysis that improves the spatial resolution of the camera. The measured absorption was compared to simulated results using three different model calculations. It was found they match very well (average deviation < 10%). Thus errors in quantification due to absorption effects can be accounted for in a more accurate manner.
1. Introduction
In the semiconductor industry the impurities on a silicon-wafer are collected in a single droplet by vapor phase decomposition-droplet collection (VPD-DC), where the SiO2 surface is dissolved in HF. That single droplet is then analyzed with TXRF.1The amount of impurities is crucial, because every impurity changes the doping of the Si-crystal and therefore its electrical properties.2 For the quantification of these impurities, in general, external calibration is used.3 The standards for the calibration method ideally are required to show no absorption effects, meaning the thin film approximation is valid for the incoming beam as well as for the emitted fluorescence.4 For amounts of sample that exceed the critical thickness saturation effects are observed, which lead to errors in quantification.5
In total reflection X-ray fluorescence analysis the primary beam hits the sample and the fluorescence is usually detected by a semiconductor detector perpendicular to the surface. To achieve total reflection conditions the incident angle on the sample holder has to be 0.1° or below.6 The beam is then totally reflected off the sample holder which has two major effects: the excitation of the sample on the sample holder is enhanced – because simplified the beam passes the sample twice – and the beam penetration of the sample holder is drastically reduced.7 Both these effects improve the lower limit of detection into the ppb region, sometimes even better.8 With a primary beam almost parallel to the sample holder, matrix effects are important to consider. In an ideal thin sample below the critical thickness, matrix effects are eliminated and the fluorescence signal is directly proportional to the analyte concentration and to the thickness of the sample.4 The number of counts for low energy photons, emitted by low Z elements like scandium, and high energy photons, e.g. those emitted from copper, is the same for equal concentrations after their relative sensitivities (most notably fluorescence yield and efficiency of detection) have been taken into account. However real samples often exceed the critical thickness and matrix effects do occur: the sample absorbs way more of the primary beam, shading itself, so that parts further down in the beam path do not experience the same excitation than those hit by the beam first. This has an effect on the accuracy of the results for every specimen exceeding the critical thickness. If, for example, an internal standard is distributed in homogeneously and the sample exceeds the critical thickness, the fluorescence signal will be either too high if the standard is hit by the primary beam first, or too low if the standard is shaded by the sample.9,10 This shading effect is especially important if external calibration is to be applied.11
The second major effect besides the shading effect (absorption of the primary beam) is the absorption of the X-ray fluorescence within the sample. Low energy photons are readily absorbed prior to leaving the material and reaching the detector, which results in a lower peak area. This, like the primary beam absorption, can be described by eqn (1) assuming a monochrome parallel bundle of rays, where the mass-attenuation coefficient expresses the dependence of the absorption from the composition of the material and the energy of the X-ray photons.6
 | (1) |
In eqn (1)I is the intensity, I0 the primary beams intensity, μ/p the mass attenuation coefficient and d the distance the beam passes through the specimen of the density ρ.
Experimental visualization of the actual absorption is challenging, since it requires not only spatially resolved detection, but also covering enough of the studied specimen without moving it to monitor the brightened and the shaded parts of the sample at the same time. Scanning techniques change the illumination of the sample with each step of movement in the primary beam and are therefore not suitable. In the approach presented here the requirements are met by a new compact pnCCD-based color X-ray camera with high spatial and energy resolution.12 The camera enables full field XRF imaging and therefore the two major matrix effects described before can be measured. The severe influence of these effects is demonstrated for μL-droplets, which were analyzed immediately after preparation before drying. In principal liquids should be ideal objects to study absorption effects. A homogeneous mass distribution and a defined continuous shape can be assumed in an aqueous droplet. However, our experimental results show, that these assumptions need to be refined.
Absorption effects in TXRF have been the subject of model calculations.11,13 Horntrich et al. proposed a model in search for the ideal sample shape, meaning the highest fluorescence intensity and the lowest saturation effect.14–16 In their comparison of sample types of a cuboid, cylinder, spherical segment and ring shapes the ring shape exhibited the lowest saturation effect and lead to the highest fluorescence intensity.
Experimental validation of this model however was difficult, since liquids do not dry to give defined morphologies. This is where the sample preparation needs to provide as much a defined morphology as possible. Arrays of pL-droplets can be printed with ink jet printing technology.17 This technique provides fairly uniform deposits which can be analyzed with the CXC. The first results introducing this procedure were published recently in ref. 18. However, the data evaluation in that work was hampered, by the spatial resolution of the 2D fluorescence maps. Additionally, a simplified physical structure was assumed. In order to improve upon the initial results, sub-pixel analysis19 was used to enhance the spatial resolution of the CXC. This approach is especially important in assigning fluorescence counts to the deposits from which they are emitted. In this work we compare the experimental results to model calculations obtained with three different models. Since model calculations depend on the accuracy of the parameters used in the models a detailed analysis of the sample morphology was done with atomic force microscopy. This technique provides detailed information of the physical structure of the residues from the pL-droplets. The data enabled modeling using two other numerical approaches. The refinements on the physical structure in combination with these models will eventually enable to eliminate uncertainties introduced by morphology and allow to better understand other factors e.g. scattering and divergence of the primary beam. The work presented here significantly improves on the work reported in ref. 16. It presents the next logical step to a considerable improvement of TXRF analysis understanding of the shading effects.
It should be noted this initial modeling is designed to explain the measurements obtained. At this point it is not intended to do in-depth statistical evaluations of the merits of the different calculation models. However the quantification of absorption effects in TXRF analysis starts with understanding the measured data and this work shows the feasibility of this approach.
2. Experimental
2.1. Chemicals
Cu, Sc, Ni and Mn single element standard solutions (1 g L−1, Certipur ICP-standards, Merck, Darmstadt, Germany) were used for the preparation of the liquid drops on the microscope slide. A Ni standard solution (10 g L−1) was used for the preparation with the pL-pipette.2.2. Sample preparation
2.3. Measurements
Synchrotron TXRF measurements were carried out at the BAMline@BESSY II (Berlin, Germany) with an incident angle of 0.05°. The energy of the primary beam was set to 9.67 keV using a double W/Si multilayer monochromator system. This particular energy was selected due to its frequent use in lab instruments with X-ray tubes equipped with a tungsten target. In addition the excitation of the Ni Kα in the pL samples is high at 9.67 keV. More details about the beam line can be found elsewhere.212.4. Instruments
![[thin space (1/6-em)]](https://www.rsc.org/images/entities/char_2009.gif) 000 capillaries (Ø = 20 μm) enables full field X-ray imaging.12 Additionally, measurements with a higher spatial resolution were carried out using a prototype 8× magnifying conical shaped optic.22 This particular type of polycapillary lens (Ø = 2 μm) increases the resolution limit down to several micrometers. However, the prototype exhibited strong optical defects and could not be used for quantitative analysis.
000 capillaries (Ø = 20 μm) enables full field X-ray imaging.12 Additionally, measurements with a higher spatial resolution were carried out using a prototype 8× magnifying conical shaped optic.22 This particular type of polycapillary lens (Ø = 2 μm) increases the resolution limit down to several micrometers. However, the prototype exhibited strong optical defects and could not be used for quantitative analysis.
3. Results and discussion
3.1. μL-droplets
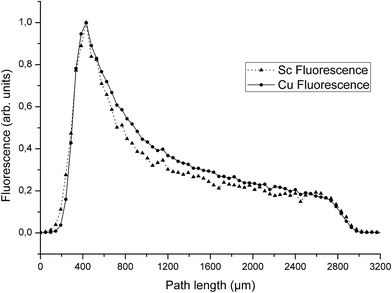
Absorption in droplets having μL volumes was studied with SR-TXRF. A homogeneous elemental distribution in each droplet was assumed. Besides the perimeter of the droplets, where fluorescence is lower due to lower heights of the droplet, an equal number of counts would be expected over the whole droplet if no absorption effects occur. Instead, because of the nearly parallel excitation beam a reduction of the incoming beam intensity over the traveled distance in the droplet is expected. For example by assuming a constant concentration of Cu and Sc of 1 g L−1 and using a diameter of 0.28 cm (which is the diameter determined from the fluorescence profile) calculation of the signal according to eqn (1) results in the reduction of the signal to I/I0 = 0.187. Similar reduction is observed by the experimental approach. Fig. 1 shows the result of a SR-TXRF measurement with 10 min live time. The combined Cu and Sc droplet (green, 4.7 × 2.8 mm2) absorbs the primary beam in such a way, that the Ni (purple, ø = 3.1 mm) and Mn (red, ø = 3.0 mm) droplets get only partly excited (note lighter color means higher intensity). The highest signals for these droplets are observed where the primary beam misses the combined droplet. Fig. 2 shows the middle part (1.5 × 3.2 mm2) of the combined Cu and Sc droplet seen in Fig. 1. In Fig. 3 the Cu and Sc fluorescence over the course of the droplet diameter is shown as a line scan. Within this volume the primary beam is almost completely absorbed.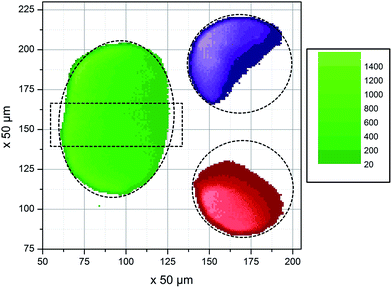 | ||
| Fig. 1 Absorption of the primary beam (coming from the left) demonstrated with four μL-droplets containing different elements: combined Cu and Sc droplet (green), Ni (purple) and Mn (red). Dashed lines represent assumed position of the droplets, as well as the part of the Cu & Sc droplet shown in Fig. 2. | ||
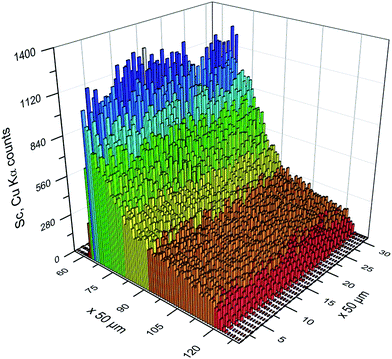 | ||
| Fig. 2 Detailed view on the fluorescence of the middle of the combined Cu and Sc droplet, showing the decreasing signal and hence the almost complete absorption of the primary beam. | ||
Besides the shading effect, the absorption of low energy fluorescence photons is the second effect, which has to be taken into account. The experimental data show that the Sc fluorescence count rate decreases stronger than the Cu counts in the middle of the droplet (Fig. 3). This is due to the higher mass attenuation coefficient for the Sc Kα radiation compared to Cu Kα radiation. The dimensions of the droplet are beyond thin film approximation,4 thus absorption effects occur and a reduction of fluorescence intensity of around 80% for Sc and around 50% for Cu compared to a thin film can be expected. The ratio between the counts of the Cu and the Sc fluorescence found here is around 1 at the upstream boundary of the droplet, and then increases over 350 μm into the droplet to stay between 6 and 8 over the middle of the droplet and decreases to around 1 at the downstream boundary (Fig. 4). It has to be stressed, that this comparison is only possible, because each pixel of the camera records a full spectrum from 3 to 40 keV.12
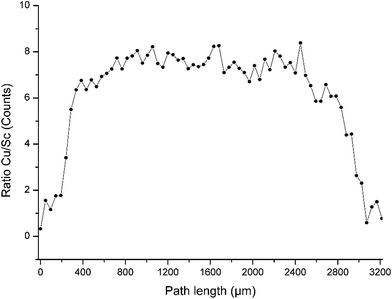 | ||
| Fig. 4 The ratio Cu to Sc X-ray fluorescence intensity shown for a part of the droplet is between 6 and 8 for most of the droplet except at the edges of the droplet. | ||
Though the concentration of Cu and Sc in the droplet are the same, the relative sensitivities for detecting their respective Kα-lines are different. For a better understanding of the experimental Cu/Sc ratio the expected ratio can be estimated from fundamental parameters. Therefore the fluorescence signal of an element (Ie) in TXRF can be calculated by the equation (Table 1):23–27
 | (2) |
In order to calculate the expected intensities for both elements Sc and Cu the most significant values are the photoelectric cross section (τe) and the fluorescence yield (ωe,K). ce, I0 and Pe,Kα are considered to be equal, as well as α, where the differences in detector efficiency are neglected. Although the difference in the edge jump ratio is small, it is not neglected. With data tabulated in ref. 28 the Cu/Sc intensity ratio was calculated for the energy of exiting X-ray beam (9.67 keV), as well as for 17.4 keV, for which relative sensitivities from a commercial benchtop instrument were available for comparison. The obtained results are shown in Table 2.
| Cu/Sc | |
|---|---|
| a Benchtop instrument: Model S2 Picofox (Bruker nano, Berlin, Germany), which was not used in this work for any measurements, only the rel. sensitivities are consulted for comparison, the energy of the primary beam is given by the molybdenum tube target. | |
| Calculated 9.67 keV | 4.92 |
| Calculated 17.4 keV | 5.44 |
| Calculated from rel. sensitivities 17.4 keVa | 5.07 |
The values calculated from fundamental parameters match quite well with the value calculated from relative sensitivities. In Fig. 4 the fluorescence ratio of Cu/Sc at the beginning of the droplet starts at 1, since no significant counts are recorded. The ratio then increases over the course of 350 μm into the droplet to Cu/Sc = 6.4. Cu/Sc ratios above 5 as determined from the relative sensitivities can be interpreted as a result of the absorption of the Sc fluorescence within the droplet, hence less Sc fluorescence reaches the detector and the ratio of Cu/Sc increases. The ratio ranges from 6 to 8 over the course of the droplet and then the ratio decreases similar to the increase observed at the beginning of the droplet.
Although these values seem reasonable, the absorption of the fluorescence within the droplet is very low. The primary beam intensity (E = 9.74 keV) as shown in Fig. 2 was reduced to 30% halfway through the droplet (ca.1400 μm). Consequently the low energy Sc fluorescence should experience strong absorption on its way through the droplet towards the detector. By assuming constant concentration (i.e. fluorescence) over the droplet height (assuming 1400 μm) and calculating the reduction due to absorption for Sc and Cu fluorescence separately, then integrating the reduced fluorescence intensities over the height of the droplet the fluorescence intensity is reduced to 13% (I/I0 = 0.126) for Sc and to 56% (I/I0 = 0.560) for Cu compared to the intensity expected without any absorption such as in a thin film. With the relative sensitivities taken into account the ratio of Cu/Sc should rise to values around 20. Hence, based on our calculations, the expected absorption leads to much higher ratios while assuming a homogeneous distribution and constant density near 1 g cm−3, as well as the height of the droplet of 0.14 cm.
Higher intensity of the Sc fluorescence could be caused by secondary excitation. The energy of the Cu fluorescence is sufficient to excite the Sc atoms, whereas no fluorescence is able to excite the Cu and the ratio of Cu/Sc decreases. By taking the photoelectric cross section of Sc at 8.04 keV (Cu Kα line) into account and calculating the fraction absorbed by Sc over a distance of 1400 μm the resulting intensity ratio is I/I0 = 0.97, which means 3% of the Cu Kα photons are absorbed by Sc and can give rise to additional fluorescence. Accordingly, the secondary fluorescence cannot account for the differences between measurement and calculation. Ratios of 6–8 for Cu/Sc can only occur if the absorption of fluorescence is much lower than assumed for our calculations. Accordingly, either the concentration or the distance assumed in the calculations according to eqn (1) are lower. It is most probable both situations are the case. Deegan29 has convincingly shown that “coffee-ring” like drying of droplets is caused by an outward transportation of material in the droplet which in the edges end up with all material at the rim of the dried droplet and no material in the inner region. This is supported by the final appearance of the dried deposit which is shown in Fig. 5.
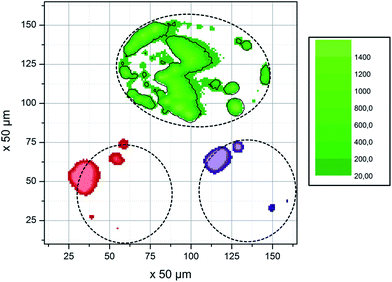 | ||
| Fig. 5 Dried residues from the droplets shown in Fig. 1. No uniform residue is formed, but rather small spots that tend to be near the edges of the droplets. It should be noted that the sample was moved between measurements, so the position of the pixels on the sample differs from Fig. 1. | ||
These processes have already negated our assumption of a constant concentration throughout the droplet. Additionally, it is likely that the droplet is already shrunken to a reduced height by evaporation by the time the measurements were performed.
3.2. pL-array
In TXRF usually dried residues from μL-sized volumes are analyzed. Dried residues from such large volumes do not produce a well-defined specimen, which makes it difficult to design a sample with defined morphology. A well-defined morphology of the specimen is desired to model and better understand the matrix effects. The Microplotter used here provides arrays of pL droplets, which dry to give well-defined residues. Fig. 6 shows a measurement displaying the 62 deposits of the array.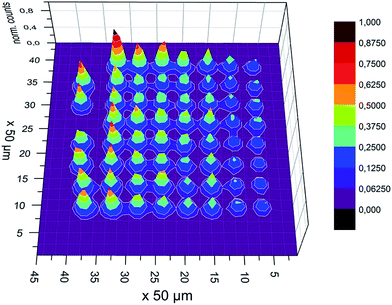 | ||
| Fig. 6 Ni XRF signal intensity measured with the color X-ray camera from the 62 deposits array with the exciting beam coming from the left. | ||
As expected, the deposits hit by the primary beam first usually show the highest fluorescence. Each deposit shades the subsequent deposits. The absorption of the primary beam is equivalent to the reduction in fluorescence intensity. Therefore, the fluorescence intensity of each deposit needs to be determined.
The mean diameter of the deposits was found to be 25 μm and the distance between the deposits varied from 171 to 224 μm using optical microscopy. This translates to 1/2 pixel covered by a deposits and 4–5 pixel covering the space in-between deposits. The spatial resolution of the polycapillary optic is in the range of the pixel diameter, so that the spatial resolution of the camera is determined by the pixel size of 48 × 48 μm2.30 Although the fluorescence signal of a 25 μm deposit is smaller than one pixel, the signal may expose more than one pixel, e.g. the boundary of two pixels is exposed. Consequently the deposits may overlap to a certain level, which hampers resolving of the individual residue intensities.
One approach to solve this problem is to define a high, linear background, so that only pixels with high fluorescence remain, and those are easier to assign to single deposits.16 Another way is to take into account additional information which is available on the position of an electron cloud generated by incoming fluorescence photons on the detector. That can be done by sub-pixel analysis, where the position of the photon hit is approximated from the electron cloud distribution.28 As a result one real pixel is separated in several theoretical sub-pixels, in this case 4 × 4. Sub-pixel analysis improves the spatial resolution to ∼45 μm (ref. 28) but more importantly it increases the available contrast and pixel separation between the deposits. We can then distinguishing between the deposits without losing counts as is illustrated in Fig. 7 and 8. Of particular note, in Fig. 8, most deposits have been clearly resolved compared to the deposits shown in Fig. 6, where a majority of the between-deposit space appears to be filled with signal.
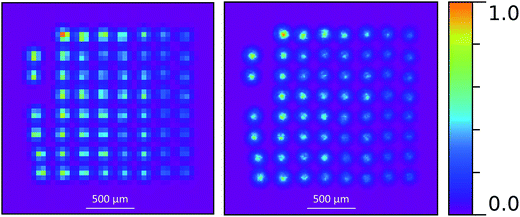 | ||
| Fig. 7 Comparison between no sub-pixel (left) and 4 × 4 (right) sub-pixel analysis. The latter shows a better resolution and more detailed structure. | ||
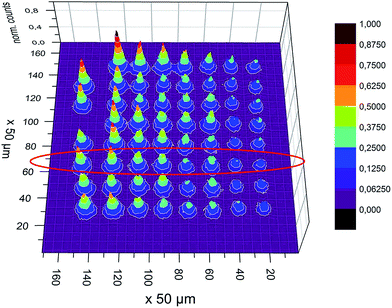 | ||
| Fig. 8 The same measurement as in Fig. 6, but with 4 × 4 sub-pixel analysis, clearly showing a more detailed structure. The red circled row of deposits were used in the model comparison. | ||
After implementing the sub-pixel data processing procedure the fluorescence intensity was integrated over each individual deposit. The results for the selected line of deposits circled in Fig. 8 are given in Table 3 going from left to right.
| Counts | Percentage | |
|---|---|---|
| I 1 | 26![[thin space (1/6-em)]](https://www.rsc.org/images/entities/char_2009.gif) 166 166 |
100% |
| I 2 | 24![[thin space (1/6-em)]](https://www.rsc.org/images/entities/char_2009.gif) 862 862 |
95.02% |
| I 3 | 21![[thin space (1/6-em)]](https://www.rsc.org/images/entities/char_2009.gif) 758 758 |
83.15% |
| I 4 | 19![[thin space (1/6-em)]](https://www.rsc.org/images/entities/char_2009.gif) 915 915 |
76.11% |
| I 5 | 14![[thin space (1/6-em)]](https://www.rsc.org/images/entities/char_2009.gif) 314 314 |
54.70% |
| I 6 | 17![[thin space (1/6-em)]](https://www.rsc.org/images/entities/char_2009.gif) 298 298 |
66.11% |
| I 7 | 11![[thin space (1/6-em)]](https://www.rsc.org/images/entities/char_2009.gif) 522 522 |
44.03% |
| I 8 | 9808 | 37.48% |
The fluorescence of the first deposit is set to 100%, assuming that the deposit hit by the beam first should show the highest signal. In order to understand how exactly the absorption took place three different models were used to simulate the data and are discussed in the following section.
3.3. Calculations
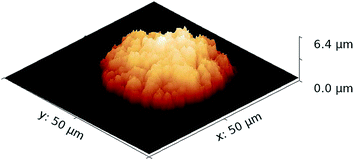 | ||
| Fig. 9 AFM measurement of one of the pL droplet residues with a maximum height of 6.39 μm and 2527 μm3 volume. The volume was determined from summing up the height of each pixel. | ||
Another parameter that was subject to consideration is the density. In (16) only the density of Ni is considered. In this work the density of the residue Ni(NO3)2 × 6H2O is taken into account, where the amount of Ni is known through the preparation process. We assume the formation of Ni(NO3)2 × 6H2O, since it is very stable and the sample is used in ambient air, so no anhydrous form, which is hygroscopic, can be expected. The tabulated value for the density of Ni(NO3)2 × 6H2O is 2.05 g cm−3.32 However it is reasonable to assume the actual density is lower, since the residue does not dry to form a single crystal, is not completely uniform and might include cavities. Consequently, in this work the density of the residues was a fitting parameter. A density near 1 g cm−3 gave the best results, presumably because the deposit is not a single crystal.
3.4. Comparison of the calculation models to measured data
The main difficulty in modeling the TXRF intensities of dried deposits is related to the density of the residues. It appears that in all three models the density had to be significantly lowered (ρ = 1.15 g cm−3) with respect to the tabulated value for Ni(NO3)2 × 6H2O (ρ = 2.05 g cm−3). We believe that this reduced density is caused by the morphology of the deposits, which does not dry to give a single crystal. We observed scratches, granulation and cavities in the optical images of the deposit. Provided that the density variation is justified, all calculation models appear to describe the measured decrease of TXRF intensity rather well. However, an unusual variation of the intensity for the fifth (I5) and sixth deposit (I6) is only reproduced by model C.Models A and B do not take into account the refined sample morphology. Both models assume the deposits to be perfectly aligned and have the same idealized shape. The AFM measurements clearly show that is not the case.
When a droplet is printed on the wafer it occupies a certain area. The evaporation of the solvent leads to a smaller residue. Due to the hydrophobic surface of a Si wafer, the residue usually forms within the area that was once occupied by the droplet, because the droplet did not spread out, but contracts as it dries. However the fact that the residue is smaller than the original liquid droplet is conceivable because the residue is within a much larger area wetted by the original liquid droplet. This means there is some degree of variability for the final location of the residue, and results in the residues not being perfectly aligned on the micrometer scale. As a consequence consecutive deposits are not shaded in the same way and fluorescence variations are expected to occur.
Model C uses information from microscopic images to estimate the exact shape and position of the deposits. Therefore this model can “see” the morphological alternations and consequently approximate the resulting intensity variations.
The comparison of the measured XRF and the simulated results of the three different models are shown in Fig. 10 and Table 4.
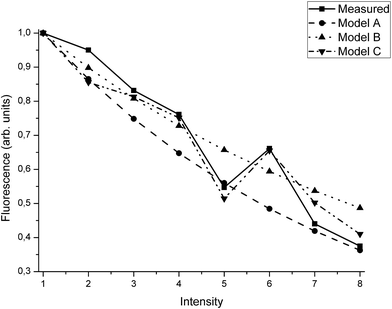 | ||
| Fig. 10 Comparison of the measured intensity and the three calculation models. The agreement is good, and model C is able to follow the measured values best. The values are shown in Table 4. | ||
| Model A | Model B | Model C | |
|---|---|---|---|
| I 1 | 0.00% | 0.00% | 0.00% |
| I 2 | 8.51% | 5.22% | 9.47% |
| I 3 | 8.31% | 2.35% | 1.84% |
| I 4 | 11.36% | 3.31% | 0.96% |
| I 5 | 1.31% | 11.00% | 3.27% |
| I 6 | 17.65% | 6.71% | 0.59% |
| I 7 | 2.11% | 9.67% | 6.20% |
| I 8 | 1.22% | 11.22% | 3.53% |
| Average (without I0) | 7.21% | 7.07% | 3.70% |
On average, model C predicts the deposit intensity better by a factor of 2 compared to models A and B. On the other hand, the simple models require less information to work properly.
The performance of model C is illustrated in the following section. It produces a spatially resolved fine structure of fluorescence correlated to specimen morphology. The comparison to high resolution Ni fluorescence maps show that this fine structure is also found in the experiment. In order to identify the local variation of fluorescence intensity and trace the shading effects an additional measurement was carried out using an 8![[thin space (1/6-em)]](https://www.rsc.org/images/entities/char_2009.gif) :
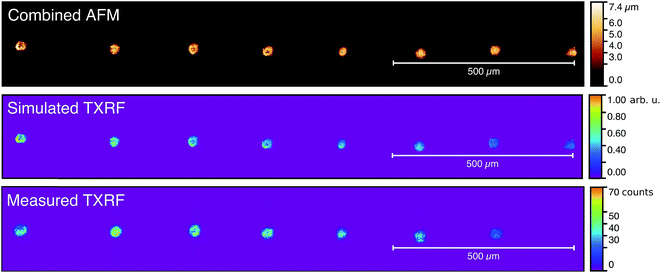
:![[thin space (1/6-em)]](https://www.rsc.org/images/entities/char_2009.gif) 1 magnifying polycapillary optic. Unfortunately the quality of the measurements was low due to the diminished XRF signal caused by the magnifying optic. Therefore the measurements compared to the calculation models were performed with a straight polycapillary without magnification. In Fig. 11 the image recorded with the color X-ray camera is compared to the simulation using model C as well as to a combined AFM image that provided the morphology input for the model. The pictures are aligned with the X-ray beam direction which runs from left to right. Accordingly, for each pixel row, calculations were performed independently.
1 magnifying polycapillary optic. Unfortunately the quality of the measurements was low due to the diminished XRF signal caused by the magnifying optic. Therefore the measurements compared to the calculation models were performed with a straight polycapillary without magnification. In Fig. 11 the image recorded with the color X-ray camera is compared to the simulation using model C as well as to a combined AFM image that provided the morphology input for the model. The pictures are aligned with the X-ray beam direction which runs from left to right. Accordingly, for each pixel row, calculations were performed independently.
For all images deviation in the alignment of the deposits is clearly visible. In addition simulated TXRF shows the correlation between height of the droplet and fluorescence intensity. Shading is visible for at least three effects: (1) the total intensity from consecutive deposits decreases, (2) the deposits hit by the primary beam first exhibit higher fluorescence intensity, and (3) for the deposits that are not fully shaded by the previous residues (e.g. deposits 4 and 6) the shaded region has a much lower intensity. Accordingly increased intensity of deposit 6 (I6) can be explained by the deviation from the perfect alignment caused by the drying process of the residue. At the same time the intensity drop for the fifth residue (I5) can be explained by a reduced volume.
The image recorded with the X-ray color camera shows the same features as the simulation. Positioning, deposit size and shading effects correspond well to the modeled ones. However, due to polycapillary imperfections the relative intensity varies much along the structure, e.g. the first deposit appears less intense and the last deposit is totally missing as it lies beyond the field of view of the magnifying optic. Therefore the measurement with magnifying optic is not suited for qualitative comparison of the intensity.
4. Conclusions and outlook
The color X-ray camera measurements of the absorption in liquid μL-droplets deposited on microscope slide and excited with SR-TXRF show that shading is a severe effect. Until recently – though model calculations had predicted effects of the magnitude found here – no experimental approach for visualizing the shading was available. We show that within a few millimeters of a combined Cu and Sc standard (1 g L−1) the monochromatic synchrotron beam of 9.67 keV is absorbed almost completely. Within the same droplet the absorption of fluorescence photons could be shown by the ratio of Sc/Cu counts over the course of the droplet. However, there are still open questions e.g. the calculations show a less steep decrease in intensity. The proposed experimental approach will allow detailed study and refinement of our knowledge on shading and may eventually probe the mass transport in a drying droplet by applying the refined models.Turning to smaller droplets in the pL-range we show that even the small, dried residues from pL-droplets printed with the SonoPlot Microplotter show considerable absorption of the primary beam. Within one line of eight subsequent deposits each containing 550 pg Ni the last deposit gets excited by only about 40% of the primary beams intensity. However, the precision of the measurements was greatly improved with the use of sub-pixel analysis. The amount of absorption was simulated with three different models in good agreement with the measured data. Best results were obtained with the most sophisticated model; however model C requires the most detailed knowledge of the samples morphology and alignment of the deposits. The good agreement of calculation and experiment enables the calculation and quantification of absorption effects, although it should be noted that the morphology of the sample should be as well-known as possible to ensure accurate results.
It seems evident that without precise knowledge on sample morphology a detailed analysis of dried deposits would be hindered. Dedicated TXRF stations that would combine AFM imaging with X-ray intensity measurements seems to be a potential challenge. Even though the current simulation procedure seems demanding the authors suggest that simpler physical models, such as the attenuation law can be adapted to accept more advanced morphology input. In that respect a combination of AFM with the X-ray color camera, preferably with a high-quality, high-resolution optic, appears to be the most suitable method for advanced investigations.
Acknowledgements
The authors would like to thank Gerald Falkenberg and Philipp Alraun from the DESY for letting us use their microscope and help with the LM-micrographs. We thank the BAM and HZB for the allocation of synchrotron radiation beam time. Thanks also to Markus Krämer (AXO Dresden, Germany) for fruitful discussions. Subpixel analysis has been supported by Marie Curie Actions – Initial Training Networks (ITN) as an Integrating Activity Supporting Postgraduate Research with Internships in Industry and Training Excellence (SPRITE) under EC contract no. 317169. S.H.N acknowledges financial support by the Swiss National Science Foundation (SNSF), Project No. P2FRP2_148569. P.H. and C.S. acknowledge this research project has been supported by the European Commission under the 7th Framework Program through the ‘Research Infrastructure’ action of the ‘Capacities’ program, CALIPSO Grant number 312284.References
- C. Neumann and P. Eichinger, Ultra-trace analysis of metallic contaminations on silicon wafer surfaces by vapour phase decomposition/total reflection X-ray fluorescence (VPD/TXRF), Spectrochim. Acta, Part B, 1991, 46, 1369–1377 CrossRef.
- U. Hilleringmann, in Silizium-Halbleitertechnologie, B.G. Teubner: Stuttgart Leipzig, 1999, p. 150 Search PubMed.
- Y. Mori, Summary of ISO/TC 201 Standard: XIX ISO17331: 2004—Surface chemical analysis—Chemical methods for the collection of elements from the surface of silicon-wafer working reference materials and their determination by total-reflection X-ray fluorescence (TXRF) spectroscopy, Surf. Interface Anal., 2005, 37, 522–523 CrossRef CAS PubMed.
- R. Klockenkämper and A. von Bohlen, Determination of the critical thickness and the sensitivity for thin-film analysis by total reflection X-ray fluorescence spectrometry, Spectrochim. Acta, Part B, 1989, 44, 461–469 CrossRef.
- Y. Gohshi, Y. Mori, N. Yabumoto, K. Kawai, K. Araki, A. Urano, S. Kozono, H. Shibata, A. Shimazaki, S. Taniike, T. Nakama, K. Nishihag, H. Horie, M. B. Shabani, K. Yakushiji and M. Yamagami, ISO/TC201/WG2 Activities: VPT-TXRF Round Robin Results and Perspective, TXRF conference, Trento, Italy, 2007 Search PubMed.
- R. Klockenkamper, in Total-Reflection X-Ray Fluorescence Analysis, John Wiley & Sons, New York, 1997, pp. 2–17 Search PubMed.
- P. Wobrauschek, Total reflection X-ray fluorescence analysis – a review, X-Ray Spectrom., 2007, 36, 289–300 CrossRef CAS PubMed.
- R. Klockenkämper and A. von Bohlen, Elemental Analysis of Environmental Samples by Total Reflection X-Ray Fluorescence: a Review, X-Ray Spectrom., 1996, 25, 1556–2162 CrossRef.
- A. Prange and H. Schwenke, Trace element analysis using total reflection X-ray fluorescence spectrometry, Adv. X-Ray Anal., 1992, 35, 899–923 Search PubMed.
- C. Horntrich, S. Smolek, A. Maderitsch, R. Simon, P. Kregsamer and C. Streli, Investigation of element distribution and homogeneity of TXRF samples using SR-micro-XRF to validate the use of an internal standard and improve external standard quantification, Anal. Bioanal. Chem., 2011, 400, 2649–2654 CrossRef CAS PubMed.
- C. Horntrich, P. Kregsamer, S. Smolek, A. Maderitsch, P. Wobrauschek, R. Simon, A. Nutsch, M. Knoerr and C. Streli, Influence of the excitation energy on absorption effects in Total Reflection X-ray analysis, J. Anal. At. Spectrom., 2012, 27, 340–345 RSC.
- O. Scharf, S. Ihle, V. Arkadiev, A. Bjeoumikhov, G. Buzanich, R. Hartmann, M. Kühbacher, M. Lang, M. Langhoff, A. Liebel, M. Radtke, U. Reinholz, H. Riesemeier, H. Soltau, L. Strüder, A. F. Thünemann and R. Wedell, Compact pcCCD-Based X-ray Camera with High Spatial and Energy Resolution: A Color X-ray Camera, Anal. Chem., 2011, 83, 2532–2538 CrossRef CAS PubMed.
- D. Hellin, W. Fyen, J. Rip, T. Delande, P. W. Mertens, S. de Gendt and C. Vinckie, Saturation effects in TXRF on micro-droplet residue samples, J. Anal. At. Spectrom., 2004, 19, 1517–1523 RSC.
- C. Horntrich, P. Kregsamer, P. Wobrauschek and C. Streli, Considerations on the ideal sample shape for Total Reflection X-ray Fluorescence Analysis, Spectrochim. Acta, Part B, 2011, 66, 815–821 CrossRef CAS PubMed.
- C. Horntrich, S. Smolek, A. Maderitsch, R. Simon, P. Kregsamer and C. Streli, Investigation of element distribution and homogeneity of TXRF samples using SR-micro-XRF to validate the use of an internal standard and improve external standard quantification, Anal. Bioanal. Chem., 2011, 400(8), 2649–2654 CrossRef CAS PubMed.
- C. Horntrich, P. Kregsamer, J. Prost, F. Stadlbauer, P. Wobrauschek and C. Streli, Production of the ideal sample shape for Total Reflection X-ray Fluorescence analysis, Spectrochim. Acta, Part B, 2012, 77, 31–34 CrossRef CAS PubMed.
- U. E. A. Fittschen and G. J. Havrilla, Picoliter Droplet Deposition Using a Prototype Picoliter Pipette: Control Parameters and Application in Micro X-ray Fluorescence, Anal. Chem., 2010, 82, 297–306 CrossRef CAS PubMed.
- U. E. A. Fittschen, M. Menzel, O. Scharf, M. Radkte, U. Reinholz, G. Buzanich, V. M. Lopez, K. McIntosh, C. Streli and G. J. Havrilla, Observation of X-ray shadings in synchrotron radiation-total reflection X-ray fluorescence using a color X-ray camera, Spectrochim. Acta, Part B, 2014, 99, 179–184 CrossRef CAS PubMed.
- S. H. Nowak, A. Bjeoumikhov, J. Baronay, J. Buchriegler, F. Munnik, M. Petric, M. Radtke, A. D. Renno, U. Reinholz, O. Scharf and R. Wedell, Sub-pixel resolution with color X-ray camera SLcam, arXiv:1501.06825v1 [physics.ins-det], 2015.
- B. J. Larson, S. D. Gillmor and M. G. Lagally, Controlled deposition of picoliter amounts of fluid using an ultrasonic driven micropipette, Rev. Sci. Instrum., 2004, 75(4), 832–836 CrossRef CAS PubMed.
- H. Riesemeier, K. Ecker, W. Görner, B. R. Müller, M. Radtke and M. Krumrey, Layout and first XRF applications of the BAMline at BESSY II, X-Ray Spectrom., 2005, 34, 160–163 CrossRef CAS PubMed.
- S. H. Nowak, A. Bjeoumikhov, J. von Borany, J. Buchriegler, F. Munnik, M. Petric, A. D. Renno, M. Radtke, U. Reinholz, O. Scharf, L. Strüder, R. Wedell and R. Ziegenrücker, Examples of XRF and PIXE imaging with few microns resolution using SLcam® a color X-ray camera, X-Ray Spectrom., 2015, 44(3), 135–140 CrossRef CAS PubMed.
- R. Glocker and H. Schreiber, Quantitative Röntgenspektralanalyse mit Kalterregung des Spektrums, Ann. Phys., 1928, 390, 1089–1102 CrossRef PubMed.
- J. Sherman, The theoretical derivation of fluorescent X-ray intensities from mixtures, Spectrochim. Acta, 1955, 7, 288–306 CrossRef.
- J. Sherman, Simplification of a formula in the correlation of fluorescent X-ray intensities from mixtures, Spectrochim. Acta, 1959, 15, 466–470 CrossRef.
- T. Shiraiwa and N. Fujino, Theoretical Calculation of Fluorescent X-ray Intensities in Fluorescent X-ray Spectrochemical Analysis, Jpn. J. Appl. Phys., 1966, 5, 886–899 CrossRef CAS.
- J. V. Gilfrich and L. S. Birks, Spectral distribution of X-ray tubes for quantitative X-ray fluorescence analysis, Anal. Chem., 1968, 40, 1077–1080 CrossRef CAS.
- www.csrri.iit.edu/periodic-table.html .
- R. D. Deegan, O. Bakajin, T. F. Dupont, G. Huber, S. R. Nagel and T. A. Witten, Capillary flow as the cause of ring strains from dried liquid drops, Nature, 1997, 389, 827–829 CrossRef CAS.
- S. H. Nowak, A. Bjeoumikhov, J. von Borany, J. Buchriegler, F. Munnik, M. Petric, M. Radtke, A. D. Renno, U. Reinholz, O. Scharf and R. Wedell, Sub-pixel resolution with color X-ray camera SLcam® arXiv.org>Physics, arXiv preprint arXiv:1501.06825., 2015, pp. 1–8.
- D. Nečas and P. Klapetek, Gwyddion: an open-source software for SPM data analysis, Cent. Eur. J. Phys., 2010, 10, 181–188 Search PubMed.
- GESTIS Stoffdatenbank, CAS Nr. 13478-00-7, last accessed 15.07.2015.
- C. Horntrich, Characterization of the influence of the sample shape on accuracy, statistics and reproducibility in TXRF analysis of semiconductor surfaces, Doctoral Thesis, TU Wien, 2011.
- P. Hischenhuber, Diploma thesis, TU Wien, 2014.
- S. H. Nowak, F. Reinhardt, B. Beckhoff, J.-C. Dousse and J. Szlachetko, Geometrical optics modelling of grazing incidence X-ray fluorescence of nanoscaled objects, J. Anal. At. Spectrom., 2013, 28, 689–696 RSC.
| This journal is © The Royal Society of Chemistry 2015 |

