
Enhancing photosynthetic production of ethylene in genetically engineered Synechocystis sp. PCC 6803†
Tao
Zhu‡
a,
Xiaoman
Xie‡
ab,
Zhimin
Li
a,
Xiaoming
Tan
a and
Xuefeng
Lu
*a
aKey Laboratory of Biofuels, Shandong Provincial Key Laboratory of Energy Genetics, Qingdao Institute of Bioenergy and Bioprocess Technology, Chinese Academy of Sciences, No. 189 Songling Road, Qingdao 266101, China. E-mail: lvxf@qibebt.ac.cn; Fax: +86-532-80662629; Tel: +86-532-80662629
bUniversity of Chinese Academy of Sciences, Beijing 100049, China
First published on 10th September 2014
Abstract
Ethylene is widely used in the petrochemical industry and has traditionally been produced via the steam cracking of petroleum-based feedstock. The exploration of sustainable and carbon-neutral methods of producing ethylene from the renewable feedstock seems promising. The direct photosynthetic production of ethylene after the recycling of carbon dioxide shows great potential. In this study, continuous and stable ethylene production was achieved in Synechocystis sp. PCC 6803 by introducing a codon-optimized ethylene-forming enzyme (EFE) from Pseudomonas syringae pv. sesami and using 2-oxoglutarate (2-OG) as the substrate. Based on diverse promoter screening, PcpcB was proved to be a highly efficient promoter for ethylene production in cyanobacteria. The genes encoding 2-OG decarboxylase (OGDC) and succinic semialdehyde dehydrogenase (SSADH) in the tricarboxylic acid (TCA) cycle in Synechocystis sp. PCC 6803 were identified, and the TCA cycle was genetically modified by blocking these two enzymes with the simultaneous overexpression of EFE. Meanwhile, a gene encoding 2-OG permease (KgtP) from E. coli was introduced into the phaAB loci to increase the 2-OG supply. A peak volumetric production rate of 9.7 mL L−1 h−1 for ethylene was eventually achieved in the Synechocystis recombinant (XX110), with the genetic modification of the TCA cycle and heterologous expression of 2-oxoglutarate permease by the modified semi-continuous cultivation.
Introduction
Ethylene is the raw material for a number of downstream chemical products, such as polyethylene (PE), polyethylene terephthalate (PET), polyvinyl chloride (PVC) and polystyrene (PS), as well as fibers widely used in the chemical industry and consumer markets. It is also a gaseous plant hormone frequently used in agriculture to promote crop growth and control the ripening of fruit.1 Although the global ethylene market has exceeded 143 million tons per year, the demand for ethylene is expected to continue rising.2 The traditional approach for ethylene production mainly relies on the steam cracking of unrenewable petroleum derivatives, and this process causes serious environmental pollution and the greenhouse effect.3 Bioethanol-based ethylene production has already been excessively explored. However, food competition (from food-based biomass) and cost-effectiveness (from lignocellulose-based biomass) are hurdles to be overcome, and the related production processes still require a full commercial demonstration.4 Hence, it is more and more urgent to explore innovative and sustainable ways to produce this fundamental raw material.Thus far, three biological pathways for ethylene synthesis have been identified. (i) High plants produce ethylene via a three-step reaction (the ACC pathway), in which methionine is first converted to S-adenosyl-L-methionine, then to L-aminocyclopropane-L-carboxylic acid (ACC), and finally to ethylene, as progressively catalyzed by methionine adenosyltransferase, ACC synthase and ACC oxidase.5,6 (ii) In most prokaryotes, ethylene is formed from methionine via 2-keto-4-methyl-thiobutyric acid (KMBA) catalyzed by an NADH:Fe(III)EDTA oxidoreductase in a two-step process (the KMBA pathway).7,8 (iii) In many plant pathogens, such as Pseudomonas syringae, ethylene is directly synthesized by a single enzyme (ethylene forming enzyme, EFE) from an important TCA cycle intermediate, 2-oxoglutarate (2-OG)9,10 (Fig. 1A). The 2-OG dependent ethylene-producing pathway has been tentatively explored in bacteria,11 fungi12,13 and yeast14,15 using genetic and metabolic engineering strategies. However, ethylene productivity was still at low levels in these microbial model systems.
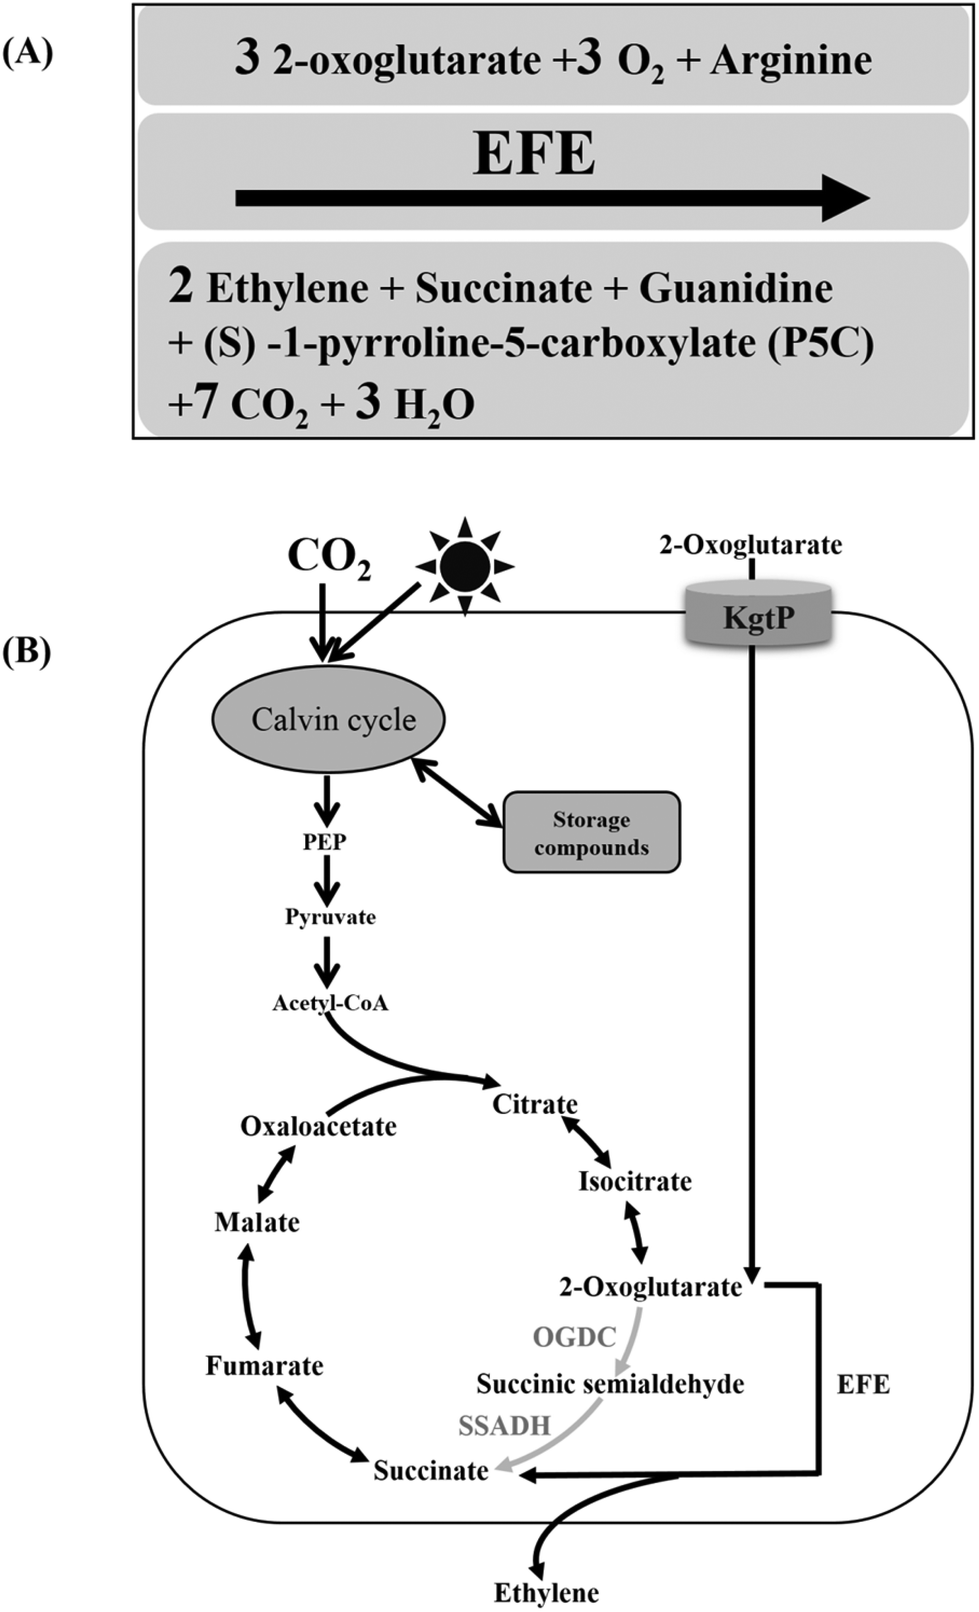 | ||
| Fig. 1 Biochemical reaction catalyzed by ethylene-forming enzyme (EFE) (A) and the schematic diagram for ethylene production in Synechocystis sp. PCC 6803 (B). | ||
Unlike heterotrophic microorganisms, cyanobacteria are a type of photoautotroph that can perform oxygen-evolving photosynthesis.16 It is this ability of sequestering and recycling CO2 into organic matter that qualifies cyanobacteria as potential candidates for the direct photosynthetic production of biofuels and biochemicals.17 Early studies on the cyanobacterial production of ethylene were performed in Synechococcus elongatus PCC 7942. The efe gene from Pseudomonas syringae was introduced into host cells by two strategies: using a shuttle vector18,19 or being incorporated into the chromosome by homologous recombination.20 In both cases, the exogenous efe was under the control of the psbA1 promoter, and the amount of carbon incorporated into ethylene could be up to 5.84% of the total carbon fixed, according to Sakai et al.19 However, all Synechococcus recombinants in these studies were genetically unstable, and the ethylene-producing phenotype was lost over a few generations. Recently, stable efe expression and continuous ethylene production have been achieved in Synechocystis sp. PCC 6803 by the modification of the efe sequence.3 The regulated expression of efe was also investigated in Synechocystis sp. PCC 6803, and a well-regulated Lac promoter variant was identified.21 By increasing the efe copy number and resuspending ethylene-producing recombinants in 5 × BG11 in a semi-continuous cultivation, a peak production rate of 5650 μl L−1 h−1 was finally achieved when efe was under the control of the psbA promoter from pea plant chloroplasts.3 The metabolic fate of photosynthetically fixed carbon in recombinant ethylene-producing cyanobacteria mainly includes ethylene production, biomass accumulation and storage compounds (e.g. glycogen and polyhydroxybutyrate, PHB), etc. It has been reported that less than 5% of the fixed carbon is directed to the TCA cycle in Synechocystis sp. PCC 6803 under photoautotrophic growth conditions.3,22 As one of the most iconic pathways in the central metabolism, the TCA cycle has a dual role in ATP synthesis and precursor metabolite (e.g. oxaloacetate, succinate and 2-OG) supply.23 The introduction of two copies of efe redirected ∼5.5% of the total fixed carbon toward ethylene production (surpassing the carbon partition rate into the TCA cycle), indicating that the amount of EFE enzyme was one of the rate-limiting factors for ethylene production.3 Multiple copies of efe might meet the need for a higher partition rate of fixed carbon toward ethylene production. On the other hand, EFE catalyzes the conversion of 2-OG to succinate, along with the production of ethylene; therefore, the exogenous EFE pathway provides an alternative to the 2-OG decarboxylase (OGDC) and succinic semialdehyde dehydrogenase (SSADH) of the cyanobacterial TCA cycle.3,24 Based on such recognition, inactivating the genes encoding the identified OGDC and SSADH by inserting the efe gene should reduce the metabolic flux toward the native TCA cycle and actively redirect metabolic flux toward the ethylene-producing pathway (Fig. 1B).
In addition to the EFE enzyme, the intracellular pool of 2-OG is an important factor affecting ethylene production. 2-OG is not only the substrate of ethylene biosynthesis but also serves as a sensitive signal of the carbon and nitrogen status of the host cells. It is also the precursor of a wide variety of compounds in cyanobacteria, including heme, chlorophyll and phycobiliproteins.24 Perturbations in the 2-OG pool are likely to manifest themselves as changes in carbon flux and carbon partitioning within the cell.3 Cyanobacteria bearing KgtP (2-oxoglutarate permease) from E. coli were previously reported to be able to assimilate extracellular 2-OG actively,25 so the introduction of kgtP was thought to make a positive contribution to ethylene production by controlling 2-OG substrate provision and/or metabolic regulation.
After a promising recombinant ethylene-producing strain was constructed, we developed an efficient and cost-effective method for cell cultivation and gas product collection. The initial cultivation of these ethylene producers was mainly performed in shake flasks, and the collection and the production analysis of ethylene took place in sealed bottles with a volume of approximately 10 mL.3,18–21 Here, we not only evaluated the ethylene-producing capacity of the efe transformants using traditional cultivating and collecting methods, but we also preliminarily developed a gaseous/aqueous two-phase photobioreactor for the successive cultivation of cyanobacterial cells and continuous collection of ethylene products.
In this study, Synechocystis sp. PCC 6803 was chosen as the starting strain for ethylene production. Enhanced ethylene production (9.7 mL L−1 h−1) was achieved by codon optimization of the efe gene, promoter screening, genetic modification of the TCA cycle, heterologous expression of 2-oxoglutarate permease, and optimization of the cultivation process. Approximately 51 mL of the ethylene gas product could be collected using the 1 L gaseous/aqueous two-phase photobioreactor during 16-day continuous cell cultivation. Herein, the Synechocystis recombinants constructed and the bioreactor developed show great potential for the direct photosynthetic production of ethylene from carbon dioxide.
Materials and methods
Chemicals and reagents
Taq DNA polymerase and restriction enzymes were obtained from Fermentas (Canada) or Takara (Japan). The kits used for molecular cloning were from Omega (USA) or Takara (Japan). The antibodies and chemicals used for western blotting were from Tiangen (China). Pure ethylene gas standard was purchased from Heli (Qingdao, China). The 2-oxoglutarate (α-ketoglutarate) assay kit was ordered from Sigma-Aldrich (USA). Unless otherwise specified, all other chemical reagents were purchased from Sigma-Aldrich (USA).Plasmid construction
All plasmids and primers used in this study are listed in Table 1, and the details are described as follows. The clones of PCR products were confirmed by sequencing.| Plasmids, strains and primers | Derivation and/or relevant characteristicsa | Reference or source |
|---|---|---|
| a Ap, ampicillin; Km, kanamycin; Sp, spectinomycin; Cm, chloramphenicol; Em, erythromycin; Gm, gentamicin. b Restriction enzyme sites added in the primers were underlined and listed. | ||
| Plasmids | ||
| pXT37b | AprSpr, pUC9′ derivative containing upstream and downstream fragments of slr0168, omega, PpetE and LacZ | 28 |
| pMD18-T | Apr, cloning vector | Takara |
| pMD18-T simple vector | Apr, cloning vector | Takara |
| pET32a | AprKmr, overexpression vector | Novagen |
| pFL-XS | AprCmr, a Biobrick “T” vector used for functional block assembling | This study |
| pTZ14 | Apr; pMD18-T simple vector derivative containing upstream and downstream fragments of sll1981 | This study |
| pTZ15 | Apr; pMD18-T simple vector derivative containing upstream and downstream fragments of slr0370 | This study |
| pTZ16 | AprKmr, pTZ14 derivative used to inactive sll1981 | This study |
| pTZ17 | AprCmr (Emr), pTZ15 derivative used to inactive slr0370 | This study |
| pZL105 | pET32a derivative used to express sll1981 in vitro | This study |
| pZL106 | pET32a derivative used to express slr0370 in vitro | This study |
| pXX16 | Apr, pMD18-T derivative containing synthetic efe gene | This study |
| pTZ10b | AprSpr, pXT37b derivative used as a promoter-probing vector | This study |
| pXX29 | AprSpr, pTZ10b derivative used to detect promoter strength of P6803psbA2 | This study |
| pXX32 | AprSpr, pTZ10b derivative used to detect promoter strength of P7942psbA1 | This study |
| pXX33 | AprSpr, pTZ10b derivative used to detect promoter strength of P7942psbA2 | This study |
| pXX47 | AprSpr, pTZ10b derivative used to detect promoter strength of PcpcB | This study |
| pXX48 | AprSpr, pTZ10b derivative used to detect promoter strength of Prbc | This study |
| pXX49 | AprSpr, pTZ10b derivative used to detect promoter strength of Pci | This study |
| pXX50 | AprSpr, pTZ10b derivative used to detect promoter strength of PpsbD | This study |
| pXX53 | AprSpr, pTZ10b derivative used to detect promoter strength of PglnA | This study |
| pXX54 | AprSpr, pTZ10b derivative used to detect promoter strength of PgroESL | This study |
| pXX55 | Apr, pFL-XS derivative containing PcpcB-efe expression cassette | This study |
| pXT170n | AprCmr, pMD18-T derivative (NdeI eliminated) containing Cmr cassette with BglII and SpeI added | This study |
| pXT170k | AprKmr, pXT170n derivative containing the Kmr cassette | This study |
| pXT170s | AprSpr, pXT170n derivative containing the Spr cassette omega | This study |
| pXX60 | AprKmr, pFL-XS derivative containing Kmr-PcpcB-efe expression cassette | This study |
| pXX61 | AprCmr, pFL-XS derivative containing Cmr-PcpcB-efe expression cassette | This study |
| pXX64 | AprKmr, pTZ14 derivative used to express efe at sll1981 gene locus | This study |
| pXX65 | AprCmr, pTZ15 derivative used to express efe at slr0370 gene locus | This study |
| pXX56 | Apr, pFL-XS derivative containing E.coli kgtP gene | This study |
| pXX58 | Apr, pFL-XS derivative containing the Gmr cassette aacC1 | This study |
| pZZ008 | Apr, pFL-XS derivative containing PcpcB of Synechocystis sp. PCC 6803 | This study |
| pXX62 | AprGmr, pFL-XS derivative containing Gmr-PcpcB expression cassette | This study |
| pXX69 | AprGmr, pFL-XS derivative containing Gmr-PcpcB-kgtP expression cassette | This study |
| pKC104 | Apr, pMD18-T derivative containing upstream and downstream fragments of phaAB operon | 29 |
| pXX70 | AprGmr, pKC104 derivative used to express kgtP at phaAB operon | This study |
| pRL446 | AprKmr, plasmid containing the Kmr cassette | 26 |
| pRL271 | AprCmr (Emr), plasmid containing the Cmr/Emr cassette | 27 |
| pLY216 | AprGmr, pLY216 containing the Gmr cassette | Unpublished data |
| Synechocystis strains | ||
| PCC 6803 | Synechocystis sp. PCC6803 wild type | Prof. X. Xu |
| XX55 | slr0168::Spr-P7942psbA1-efe | This study |
| XX56 | slr0168:: Spr-P7942psbA2-efe | This study |
| XX57 | slr0168:: Spr-P6803psbA2-efe | This study |
| XX76 | slr0168:: Spr-PcpcB-efe | This study |
| XX77 | slr0168:: Spr-Prbc-efe | This study |
| XX78 | slr0168:: Spr-PcI-efe | This study |
| XX79 | slr0168:: Spr-PpsbD-efe | This study |
| XX80 | slr0168:: Spr-PglnA-efe | This study |
| XX81 | slr0168:: Spr-PgroESL-efe | This study |
| XX102 | sll1981::Kmr | This study |
| XX103 | slr0370:: Cmr/Emr | This study |
| XX104 | sll1981:: Kmr/slr0370:: Cmr/Emr | This study |
| XX105 | sll1981:: Kmr-PcpcB-efe | This study |
| XX106 | slr0370:: Cmr-PcpcB-efe | This study |
| XX107 | slr0168:: Spr-PcpcB-efe/sll1981:: Kmr-PcpcB-efe | This study |
| XX109 | slr0168:: Spr-PcpcB-efe/sll1981:: Kmr-PcpcB-efe/slr0370:: Cmr-PcpcB-efe | This study |
| XX110 | slr0168:: Spr-PcpcB-efe/sll1981:: Kmr-PcpcB-efe/slr0370:: Cmr-PcpcB-efe/phaAB:: Gmr-PcpcB-kgtP | This study |
| Primers (5′→3′)b | ||
| sll1981-1 | GGGCTTCGTTAGGTTGTGTGGC | |
| sll1981-2 | CCGCATGGCCGTTTCCAACTCC | |
| slr0370-1 | GCCGAGGAATACTTAGCCGATG | |
| slr0370-2 | CTGCCCTATGAACCGAATATGG | |
| sll1981exp-1 | AAATTT![[G with combining low line]](https://www.rsc.org/images/entities/char_0047_0332.gif) ![[A with combining low line]](https://www.rsc.org/images/entities/char_0041_0332.gif) ![[T with combining low line]](https://www.rsc.org/images/entities/char_0054_0332.gif) ![[C with combining low line]](https://www.rsc.org/images/entities/char_0043_0332.gif) ATGGGGCAAATGAACACCGCAGACC ATGGGGCAAATGAACACCGCAGACC |
BamHI |
| sll1981exp-2 | AATAATTTATTCCCAAATTTCACAGGCC |
XhoI |
| slr0370exp-1 | AAATGGCGATCGCCACTATTAATCCG |
BamHI |
| slr0370exp-2 | TTCCCTTAAACTGGAAGTTCCC |
XhoI |
| 03psbA2-1 | CGCGTGCAAGGCCCAGTG |
KpnI |
| 03psbA2-2 | GGTTGGTTATAATTCCTTAGTTCAGATTGGAACTGACT |
NdeI |
| 42psbA1-1 | CCCTGGATTTAGCGTCTTC |
KpnI |
| 42psbA1-2 | GGATCGATCTTGAGGTTG |
NdeI |
| 42psbA2-1 | CGAAAAGTCTGAAAGTTC |
KpnI |
| 42psbA2-2 | GTTTGCGATGAGTCCTTAGGAGACTTAATAGCCTCG |
NdeI |
| cpcB-1 | TTTCGTTATAAAATAAACT |
KpnI |
| cpcB-2 | TATTAATCTCCTACTTGAC |
NdeI |
| rbcL-1 | GCCTTTACCCGCTTACTGCGTCC |
KpnI |
| rbcL-2 | GGGTCAGTCCTCCATAAACATTGAAT |
NdeI |
| psbD-1 | CCACCTTCAACAGTCTCCACG |
KpnI |
| psbD-2 | CTGCAAATCCTCTTGCGTAGCTAGC |
NdeI |
| ci-F | TTCGAGTAACACCGT |
KpnI |
| ci-R | TGTTTTCCTCCAGCA |
NdeI |
| groESL-1 | GTGCTTCGCGAGCGCGACAACTGT |
KpnI |
| groESL-2 | GGGAGTTTTGAGTAAACGTCG |
NdeI |
| glnA-1 | GGCTTGTTACTGCATCGCGCATTCC |
KpnI |
| glnA-2 | GCGTGTTACTCCTTCTCTGCC |
NdeI |
| efe-1 | ATGACTAACTTACAAACCTTCG | |
| efe-5 | GACTAACTTACAAACCTTCG |
NdeI |
| efe-6 | GTTAGTGGTGGTGGTGGTGGTGGGAACCGGTGGCGCGCGTA |
XhoI |
| kgtP-1 | ATGGCTGAAAGTACTGTAACGG | |
| kgtP-2 | TTAAAGACGCATCCCCTTCCCT | |
| Gm-F | TCCTTGTGTATAAGGGGACACT | |
| Gm-R | GGCCGGGAAGCCGATCTCGGCT | |
| slr0168-1 | ACCTCTCCACGCTGAATTAG | |
| slr0168-2 | TTCCAGGCCACATTGTTGTC | |
| phaAB-1 | GGGGACCATCCTGACTACACGG | |
| phaAB-2 | TGTTGATGGTGGGTATCGTGGTG | |
| Cm-F | TCCGAATAAATACCTGTGACGGAAGATCATC |
BglII |
| Cm-R | TTTCTGCCATTCATCCGCTTATTATCAC |
SpeI |
| X-F1 | TTCCGAATAAATACCTGTGACGG |
XcmI |
| S-R1 | TTCTCTGCCATTCATCCGCTTAT |
XcmI |
Generation of cyanobacterial transformants
The transformation of wild-type and mutants of Synechocystis sp. PCC 6803 was performed as in the established procedures, with minor changes.30 The cells of the mid-exponential phase were collected by centrifugation, washed three times with fresh liquid BG11 medium and resuspended to a cell concentration of approximately 1 × 10⁹ cells mL−1. Next, the cell suspension was mixed with plasmid DNA (final concentration of 10 μg mL−1). After incubation for approximately 4 h at 30 °C, 30 μmol photons m−2 s−1, the mixture was spread onto nitrocellulose filters, which were rested on BG11 agar plates without antibiotics for 24 h. The filters were then moved to selective BG11 agar plates containing antibiotics at an appropriate concentration. After 1–2 weeks incubation, the resulting transformants were streaked on plates and cultured in liquid medium under selective pressure from antibiotics. Plasmids pXX32, pXX33, pXX29, pXX47, pXX48, pXX49, pXX50, pXX53, pXX54, pTZ16, pTZ17, pXX64 and pXX65 were transformed into Synechocystis sp. PCC 6803 to generate the mutant strains XX55, XX56, XX57, XX76, XX77, XX78, XX79, XX80, XX81, XX102, XX103, XX105 and XX106, respectively. The plasmid pTZ16 was transformed into the Synechocystis mutant strain XX103 to generate the double mutant strains XX104. The plasmid pXX64 was transformed into the Synechocystis mutant strain XX76 to generate the XX107 mutant strain. The plasmid pXX65 was transformed into the recombinant Synechocystis strain XX107 to generate XX109. The plasmid pXX70 was transformed into the recombinant Synechocystis strain XX109 to generate XX110. The Synechocystis mutant strains used are listed in Table 1, and their genotypes were confirmed by PCR (Fig. 4A) using the primers listed in Table 1.Cultivation of cyanobacterial strains
Mutants were grown by adding the corresponding antibiotics of appropriate concentrations for all of the cultivation manners mentioned above (kanamycin, 30 μg mL−1; spectinomycin 10 μg mL−1; chloramphenicol, 10 μg mL−1; gentamycin, 10 μg mL−1. When two or more antibiotics were used, the concentrations of antibiotics were reduced by half).
Chlorophyll a determination and photosynthetic activity analysis
Wild type and recombinant Synechocystis strains were grown autotrophically to a mid-exponential growth phase (OD730 ∼ 2.5). Cells were then collected by centrifugation and resuspended in fresh BG11 medium to OD730 ∼ 1. Oxygen evolution rates were measured with a Clark-type oxygen electrode at 30 °C with a saturating actinic light of 300 μmol photons m−2 s−1. Chlorophyll a concentrations in the cultures were determined spectrophotometrically in 90% methanol extracts of the cells, according to Meeks and Castenholz.31Protein expression and purification in E. coli
E. coli BL21 (DE3) (Takara) was transformed with plasmids pZL105 and pZL106, respectively. One liter of LB medium was inoculated with 10 mL of the overnight cultured transformed E. coli BL21 (DE3) from a single colony and grown at 37 °C. Cell cultures were induced by adding 0.1 mM isopropyl-D-thiogalactopyranoside (IPTG) at OD600 ∼ 0.6, and the cultures were incubated at 16 °C overnight while shaking at 180 rpm. Thereafter, cells were harvested by centrifugation, resuspended in binding buffer (20 mM Tris-HCl, 50 mM NaCl and 5 mM imidazole, pH 7.5), and lysed by sonication. The cell lysate was pelleted by centrifugation at 10![[thin space (1/6-em)]](https://www.rsc.org/images/entities/char_2009.gif) 000g and 4 °C for 30 min. The supernatant was immediately added to the Ni-NTA resin (Novagen) and pre-equilibrated with the binding buffer, which was gently agitated at 4 °C for 1 h. The resin was transferred into a 5 mL column that was washed sequentially with 5 column volumes of the binding buffer, five column volumes of the washing buffer containing 20 mM, 60 mM, and 100 mM imidazole to remove nonspecifically bound proteins, and then 25 mL of the washing buffer containing 250 mM imidazole to elute the target protein. The eluted proteins were examined by 12% sodium dodecyl sulfate-polyacrylamide gel electrophoresis (SDS-PAGE). The purified proteins were subsequently desalinated with 20 mM Tris-HCl (pH 7.5) and concentrated in 30% PEG20000 before quantitation using the Bradford method and measurements of enzymatic activity.
000g and 4 °C for 30 min. The supernatant was immediately added to the Ni-NTA resin (Novagen) and pre-equilibrated with the binding buffer, which was gently agitated at 4 °C for 1 h. The resin was transferred into a 5 mL column that was washed sequentially with 5 column volumes of the binding buffer, five column volumes of the washing buffer containing 20 mM, 60 mM, and 100 mM imidazole to remove nonspecifically bound proteins, and then 25 mL of the washing buffer containing 250 mM imidazole to elute the target protein. The eluted proteins were examined by 12% sodium dodecyl sulfate-polyacrylamide gel electrophoresis (SDS-PAGE). The purified proteins were subsequently desalinated with 20 mM Tris-HCl (pH 7.5) and concentrated in 30% PEG20000 before quantitation using the Bradford method and measurements of enzymatic activity.
Sample preparation for the crude enzyme analysis of cyanobacterial cells
Cyanobacteria cultures (30 mL) of the mid-exponential phase (OD730 ∼ 2.0) were centrifuged. The harvested cells were quickly frozen with liquid nitrogen and resuspended in 1 mL ice-cold Tris buffer (50 mM Tris-HCl, pH 8.0) with 0.1 mM phenylmethylsulfonyl fluoride (PMSF). The cells were disrupted using glass beads (0.25 to 0.30 mm; Sigma-Aldrich) by vigorous vortex mixing of the tube for 10 min in cycles of mixing for 30 s and cooling on an ice-water bath for 30 s. The homogenate was subsequently centrifuged to remove the cell debris and unbroken cells at 12000g, 4 °C, for 30 min. The supernatant was then collected for western blotting analysis or enzymatic assay.
OGDC and SSADH activity assay in vitro
OGDC- and SSADH-coupled reactions were conducted according to Zhang and Bryant,24 with minor modifications. The reaction mixture (0.2 mL) contained 4 mM 2-OG, 100 mM K-phosphate, pH 7.0, 0.3 mM TPP, 2 mM DTT, 1 mM MgCl2, 2 mM NADP+, 50 μg purified Sll1981 (OGDC) and 50 μg purified Slr0370 (SSADH). The production of NADPH was monitored at 340 nm immediately after the reaction mixture was incubated to room temperature using a Beckman-coulter DU-800 spectrophotometer. Control experiments were performed by removing the 2-OG substrate or one of the enzymes. We also used the crude enzyme of wild type, sll1981 mutant (XX102), slr0370 mutant (XX103) and the double mutant (XX104) to complete the functional complementation enzymatic assay.Western blotting analysis
Total soluble proteins extracted from the samples were separated by 12% SDS-PAGE according to the standard procedure and electroblotted onto PVDF membranes, which were sealed in 5% nonfat milk-TBST (0.05% Tween-20 in TBS) at room temperature for 30 min. First, the membranes were incubated with the anti-His6-tag monoclonal antibodies for 1 h and washed three times with TBST (15 min each). Second, the membranes were incubated with an alkaline phosphatase-linked secondary antibody for 1 h and washed three times with TBST (15 min each). Finally, the membranes were colored with nitroblue tetrazolium and 5-bromo-4-chloro-3-indolyl phosphate as substrates.Addition and concentration determination of 2-oxoglutarate
One milliliter of cyanobacterial culture of OD730 ∼ 3.0 was transferred to a sterile 10 mL penicillin bottle. After adding 150 nmol 2-OG (the final 2-OG concentration in the culture was 150 μM), the bottle was sealed and incubated for 1 h under the standard culturing conditions. Then, the culture was centrifuged at 10000g, and the changes of 2-OG in the supernatant was determined using a 2-OG assay kit (Sigma-Aldrich, USA).
In this kit, the 2-OG converting enzyme (glutamic-pyruvic transaminase) catalyzes the reaction of 2-OG with pyruvate and glutamate. The 2-OG development enzyme mix (Pyruvate oxidase and horseradish peroxidase) then catalyzes a nearly colorless specialized fluorescent probe (fluorescent peroxidase substrate) into a red-fluorescent oxidation product (resorufin), which has fluorescence excitation and an emission maxima of approximately 571 nm and 585 nm and an absorbance maxima of 570 nm. The colorimetric detection (OD570) approach was employed in this study. The procedures were as follows: (i) preparation of the standard. Six concentrations of 0 (blank), 2, 4, 6, 8, and 10 nmol per well standards were prepared using 2-OG assay buffer for a total volume of 50 μl in a 96-well flat-bottom plate. (ii) Preparation of samples. The pipetted supernatant medium samples needed to be tested on the 96-well plate (50 μl per well). (iii) Preparation of the reaction mixture. Add 50 μl of the appropriate reaction mix (containing 46 μl 2-OG assay buffer, 2 μl 2-OG converting enzyme, 2 μl 2-OG development enzyme and 2 μl fluorescent peroxidase substrate) to each of the blank, standard, and test wells. Mix well by pipetting, and incubate the reaction for 1 h at 37 °C, protecting the plate from light during the incubation. (iv) A standard curve for 2-OG quantification was constructed based on the 2-OG standard by measuring the OD570. Changes of the 2-OG in the sample were calculated based on this standard curve. Prior to extracellular 2-OG determination, the ethylene production was analyzed using a gas chromatograph (GC) equipped with a flame ionization detector (FID), as mentioned below.
Ethylene production assay
During the experiment, one milliliter of the cultured Synechocystis cells was transferred to a sterile 10 mL penicillin bottle, sealed with a sterile rubber stopper, and then incubated for 1 h under the same conditions as those for cultivating the cells. At the end of the incubation period, 200 μl gas samples were extracted from the headspace with a gas-tight syringe (500 μl measurement range) for the following analysis. Qualitative analysis of the gas product was performed by gas chromatography-mass spectrometry (GC-MS) using an Agilent 7890A system equipped with a HP-INNOWax column (30 m × 250 μm × 0.25 μm) through the comparison of retention times and mass spectra with the pure ethylene standard (Fig. S2B†). The quantitation analysis of ethylene production was performed on a GC-FID with the help of an ethylene calibration curve (Fig. S2A†). The injection and oven temperature was 100 °C, and the detector temperature was 200 °C. Nitrogen (constant flow 1 mL min−1) was used as the carrier gas.Results and discussion
Stable production of ethylene in Synechocystis sp. PCC 6803 by introducing a codon-optimized efe gene
The ethylene forming enzyme (EFE) is a member of the superfamily of Fe2+/ascorbate oxidases. Two reactions, the L-arginine-dependent ethylene formation reaction and the 2-OG-dependent dioxygenase reaction, are simultaneously catalyzed by EFE.32 The EFE-catalyzing ethylene synthetic pathway was first reported for Penicillium digitatum and has been extensively studied in Pseudomonas syringae.18,33 Although it had been reported that there is a functional ethylene-binding domain in the slr1212 coding sequence in Synechocystis sp. PCC 6803,34 ethylene was proved to have no influence on the growth of Synechocystis, either at high levels (95%) or low levels (1%).3,21Although the efe of Pseudomonas syringae pv. phaseolicola was frequently used for ethylene biosynthesis in genetically engineered cyanobacteria and other microorganisms in previous studies,3,14,15,18–21Pseudomonas syringae sesami was proved to be more productive (approximately 4 × 10⁻⁷ nL cell−1 h−1) than other strains, according to the ethylene production rate screening assay of different Pseudomonas syringae pathovars described by Weingart et al.35. Hence, the efe of Pseudomonas syringae sesami was used for ethylene production in this study. Actually, there are two single-base pair substitutions present, leading to one amino acid sequence change between the efe copies of these two ethylene-producing strains.35 The efe of Pseudomonas syringae sesami was synthesized by Sangon (Shanghai, China) with two major modifications. It was codon-optimized according to Synechocystis sp. PCC 6803, and three hot spots of spontaneous mutations (CGATG) were avoided by silent mutations (Fig. S1†). We also introduced a His6-Tag to EFE using the primer efe-6 (Table 1) in order to track the expression of the EFE protein in recombinant Synechocystis strains.
The promoter of psbA2, which encodes a D1 protein homolog in the reaction center of the photosynthetic photosystem II of Synechocystis sp. PCC 6803, is an efficient promoter widely used for protein expression in cyanobacteria.36,37 In this study, we modified the sequence of PpsbA2 (using primers 03psbA2-2 in Table 1) by deleting the AT box (9–18 bp upstream from the ATG start codon) to enhance the mRNA stability.36,38 The synthetic efe gene was driven by the modified PpsbA2 and integrated into the Synechocystis genome at a neutral site (slr0168) by homologous recombination. Compared with the wild-type, the resulting recombinant strain (XX57) exhibited a similar growth rate (Fig. S3A†). In order to calculate the ethylene yield of the transformants, a serial dilution of vaporized pure ethylene standards was prepared, and an ethylene calibration curve was constructed based on the amount of ethylene relative to the peak area from GC analysis (Fig. S2A†). We further confirmed that the gas product generated by efe transformants was ethylene by GC-MS analysis (Fig. S2B†). Our results indicated that the XX57 strain could reach a peak specific ethylene production rate of 518 μL L−1 h−1 OD730−1 (ethylene production rate of 121 μL L−1 h−1) under standard culture conditions (Fig. S3B†) while maintaining a stable ethylene synthetic capacity in the following subculture process (data not shown).
Promoter screening for higher ethylene productivity
While photoautotrophic cyanobacteria are well-recognized as promising microbial cell factories for the production of biofuels and biochemicals, the development of biosynthetic parts for this organism lags behind what has been developed for their heterotrophic companions.37 In previous studies, promoters or their variants developed in E. coli and yeast often did not function as expected in cyanobacteria.39 In terms of ethylene biosynthesis in cyanobacteria, native metal-inducible promoters (PpetE, PcoaT, PsmtA, etc.) have been tested using a shuttle vector but failed to produce a high ethylene yield.21 The E. coli-originated Trc promoter and Lac promoter variant (PA1lacO-1) were also investigated, and it was found that the control of the Lac-derived promoter became progressively more relaxed as the cyanobacterial culture grew denser.21 Thus, it is important to select an appropriate promoter for effective EFE expression to achieve higher ethylene productivity.Eight identified strong promoters, including PcpcB (promoter of the cpcBAC operon, which encodes the protein phycocyanin40), Prbc (promoter of the rbc operon, which encodes ribulose-1,5-bisphosphate carboxylase/oxygenase41) and PpsbD (promoter of the psbD gene, which encodes the photosystem II D2 protein42) from Synechocystis sp. PCC 6803; PpsbA1 (promoter of psbA1, which is one of the three genes encoding the photosystem II D1 protein43), PpsbA2 (promoter of psbA2, which is one of the three genes encoding the photosystem II D1 protein) and PgroESL (promoter of the groESL operon, which encodes the heat shock protein44) from Synechococcus elongatus PCC 7942; PglnA (promoter of the glnA operon, which encodes glutamine synthetase45) from Anabaena sp. PCC 7120; and PcI (promoter of the CI repressor protein) from λ-phage were incorporated into the promoter-probing vector pTZ10b and integrated into the genome of Synechocystis sp. PCC 6803 at the slr0168 neutral site (Fig. 2A). To evaluate the strength of the aforementioned promoters, both the ethylene production rate and specific ethylene production rate of the resulting Synechocystis recombinants were measured. Our results indicated that the specific ethylene production rate and volumetric ethylene production rate varied greatly based on different promoters. PcpcB and Prbc were stronger than the frequently used PpsbA in cyanobacterial ethylene biosynthesis. This was especially true for PcpcB (XX76), which reached a peak specific ethylene production rate of 774 μL L−1 h−1 OD730−1 and a volumetric ethylene production rate of 221 μL L−1 h−1 during a 8-day cultivation (Fig. 2B,C). Guerrero et al. described that the method of efe introduction into the host cells (chromosomal integration versus plasmid-based) appeared to have no influence on the ethylene's evolutionary stability.21 Our findings were consistent with those reported by Sakai and coworkers, who also emphasized the importance of promoters.19 According to the results of promoter screening, PcpcB was used for ethylene production in the following study.
 | ||
| Fig. 2 Promoter screening for improving ethylene production. The ethylene forming enzyme gene in genetically engineered Synechocystis strains was under the control of PcpcB (XX76), Prbc (XX77), PpsbD (XX79) and PpsbA2 (XX57) from Synechocystis sp. PCC 6803; PpsbA1 (XX55), PpsbA2 (XX56) and PgroESL (XX81) from Synechococcus elongatus PCC 7942; PglnA (XX80) from Anabaena sp. PCC 7120; and PcI (XX78) from λ-phage. Ethylene productivity was measured daily for 8 days. (A) The schematic structure of the promoter-probing vector pTZ10b shows how the expression cassettes were integrated into the slr0168 neutral site of Synechocystis sp. PCC 6803. (B) Comparison of the highest specific ethylene production rate. (C) Comparison of the highest volumetric ethylene production rate. Data presented are the means and standard deviation of two independent experiments, each with three replicates. | ||
Improving ethylene production by genetic modification of the TCA cycle
The recent identification of 2-OG decarboxylase (OGDC) and succinic semialdehyde dehydrogenase (SSADH) in Synechococcus sp. PCC 7002, which perform the function of the missing 2-OG dehydrogenase (OGDH), closed the long-lasting misinterpreted cyanobacterial TCA cycle.24,46 Zhang and Bryant showed that both the deletion and overexpression of either SynPCC7002_A2770 (encoding OGDC) or SynPCC7002_A2771 (encoding SSADH) in Synechococcus sp. PCC 7002 affected the cell growth rate (particularly the overexpression of SynPCC7002_A2770). Although the reasons resulting in these phenotypes remain unclear, interpretations based on the intracellular levels of TCA intermediates have been proposed.46,47 As the ethylene-producing pathway employed in this study can catalyze the conversion of 2-OG and arginine into ethylene and succinate, it can actually provide an alternative to OGDC and SSADH of the cyanobacterial TCA cycle. Hence, substituting EFE for the OGDC-SSADH pathway might be a feasible strategy to redirect the metabolic flux toward the alternative EFE pathway and to improve the ethylene productivity.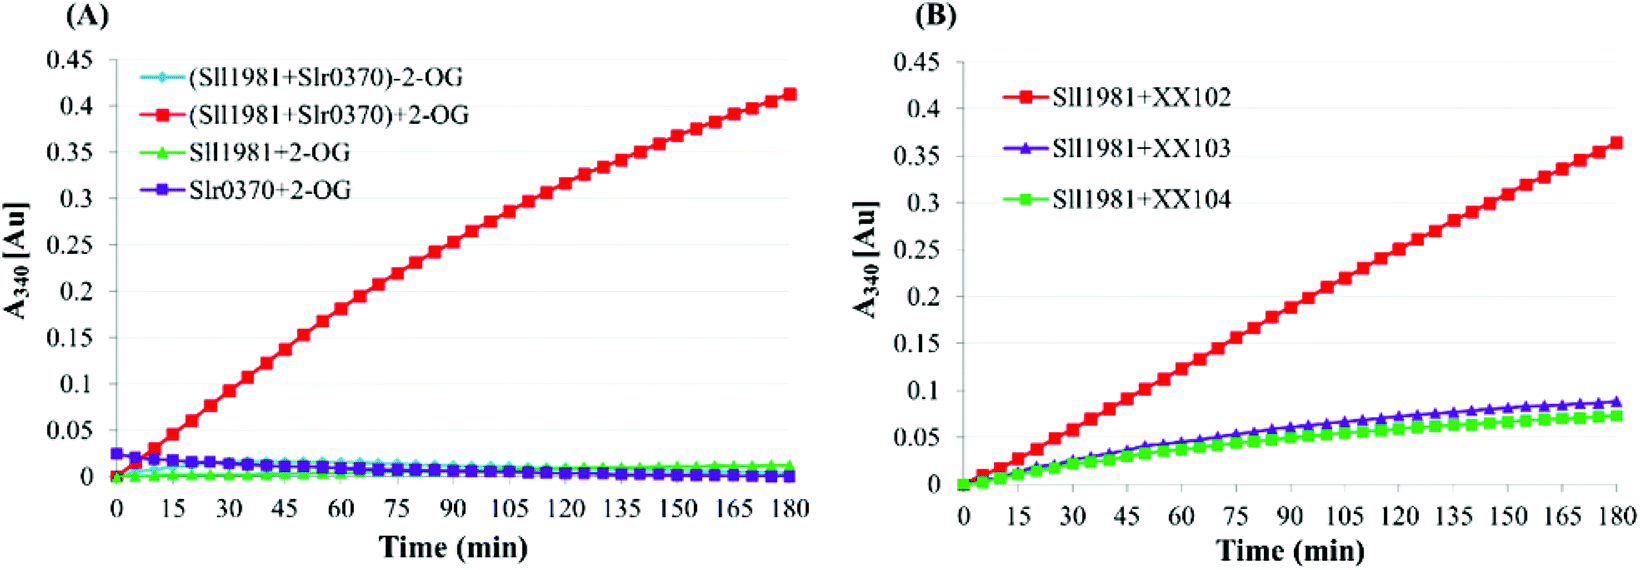 | ||
| Fig. 3 Enzymatic assays for the OGDC and SSADH activity of Synechocystis sp. PCC 6803 by monitoring the absorbance increase at 340 nm for NADPH production. (A) Enzymatic assay using purified Sll1981 and Slr0370. The reaction mixture was set as indicated in the materials and methods section. (Sll1981+Slr0370)+2-OG: Sll1981 and Slr0370 coupled reaction; (Sll1981+Slr0370)-2-OG: coupled reaction lacking of 2-OG; Sll1981+2-OG: coupled reaction without Slr0370 protein; Slr0370+2-OG: coupled reaction without Sll1981 protein. (B) Functional complementation assay using the purified protein and the whole-cell crude extracts of mutants. The reaction mixtures were set as indicated, and 50 μg of the whole-cell extracts was used. The Sll1981+XX102: coupled reaction was catalyzed by the purified Sll1981 and the whole-cell crude extracts of the sll1981 mutant (XX102); the Sll1981+XX103: coupled reaction was catalyzed by the purified Sll1981 and the whole-cell crude extracts of slr0370 mutant (XX103); and the Sll1981+XX104: coupled reaction was catalyzed by the purified Sll1981 and the whole-cell crude extracts of the sll1981/slr0370 double mutant (XX104). | ||
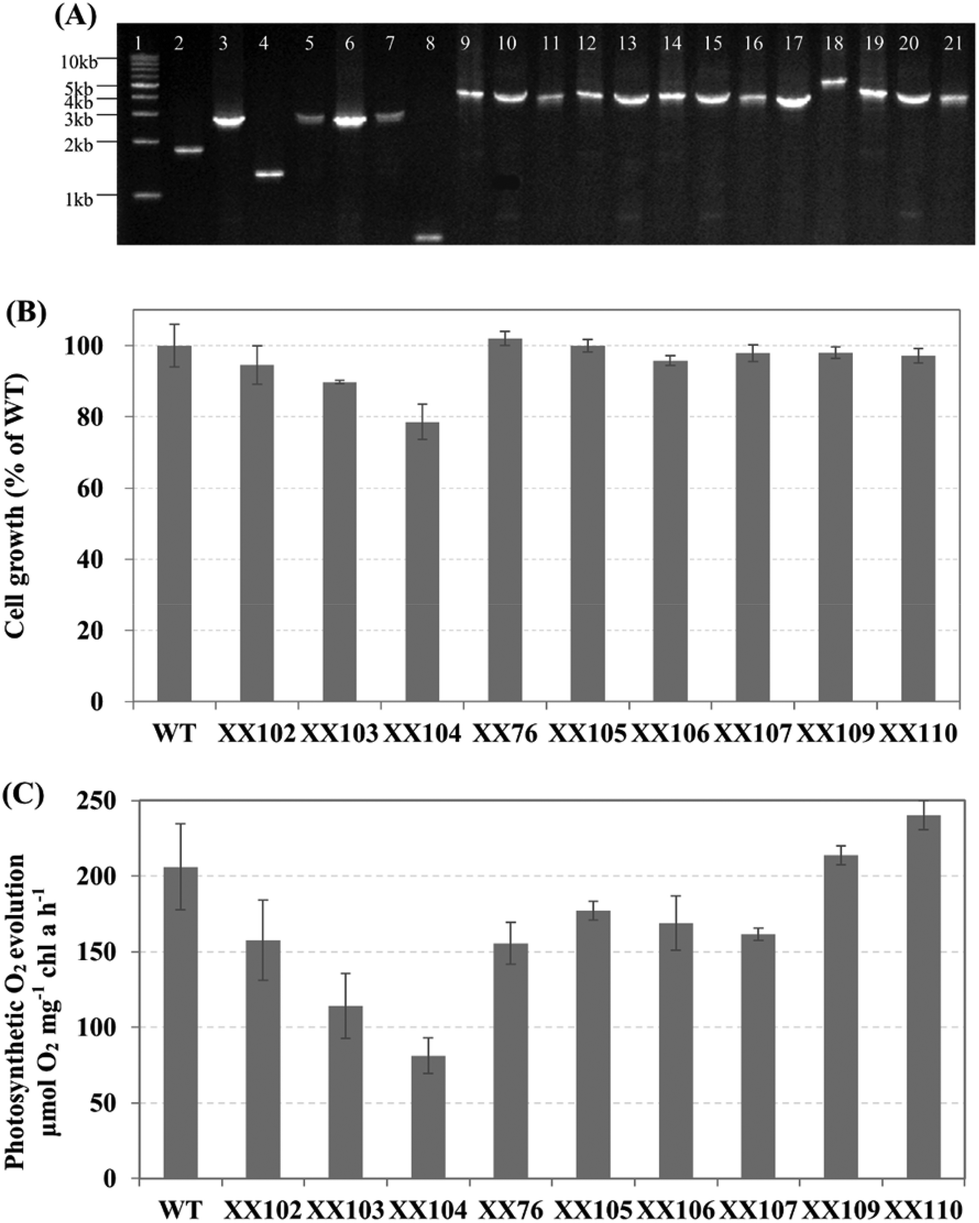 | ||
| Fig. 4 (A) Genotype analysis of Synechocystis sp. PCC 6803 recombinants. Lane 1: 1 kb DNA Ladder; lane 2: genomic DNA of wild-type was amplified by primers sll1981-1 and sll1981-2 (control); lane 3: genomic DNA of XX102 was amplified by primers sll1981-1 and sll1981-2; lane 4: genomic DNA of wild-type was amplified by primers slr0370-1 and slr0370-2 (control); lane 5: genomic DNA of XX103 was amplified by primers slr0370-1 and slr0370-2; lane 6: genomic DNA of XX104 was amplified by primers sll1981-1 and sll1981-2; lane 7: genomic DNA of XX104 was amplified by primers slr0370-1 and slr0370-2; lane 8: genomic DNA of wild-type was amplified by primers slr0168-1 and slr0168-2 (control); lane 9: genomic DNA of XX76 was amplified by primers slr0168-1 and slr0168-2; lane 10: genomic DNA of XX105 was amplified by primers sll1981-1 and sll1981-2; lane 11: genomic DNA of XX106 was amplified by primers slr0370-1 and slr0370-2; lanes 12, 13: genomic DNA of XX107 was amplified by primers sll1981-1/sll1981-2 and slr0370-1/slr0370-2, respectively; lanes 14–16: genomic DNA of XX109 was amplified by primers slr0168-1/slr0168-2, sll1981-1/sll1981-2 and slr0370-1/slr0370-2, respectively; lane 17: genomic DNA of wild-type was amplified by primers phaAB-1 and phaAB-2 (control); lanes 18–21: genomic DNA of XX110 was amplified by primers phaAB-1/phaAB-2, slr0168-1/slr0168-2, sll1981-1/sll1981-2 and slr0370-1/slr0370-2. (B) The cell growth ability of Synechocystis sp. PCC 6803 wild type and mutants. All strains were initially inoculated at OD730 ∼ 0.05 and cultured for 7 days under standard conditions. The data presented are the ratios of the final OD730 to that of the Synechocystis sp. PCC 6803 wild type. (C) Photosynthesis activities of Synechocystis sp. PCC 6803 wild type and mutants. Oxygen evolution rates were measured as indicated in the materials and methods section. Data presented are the mean and standard deviation of two independent experiments, each with three replicates. | ||
Previously, Sll1981 of Synechocystis sp. PCC 6803 was putatively assigned as a bifunctional enzyme with conserved domains for both acetolactate synthase (ALS) activities48 and L-myo-inositol 1-phosphate synthase (MIPS).49 Nevertheless, our enzymatic analysis showed that Sll1981 and Slr0370 functioned as OGDC and SSADH, respectively. Meanwhile, our results were in line with the metabolic flux analysis observed by Knoop and coworkers.23
To determine the effects of introducing EFE on the OGDC and SSADH pathways, the efe gene was inserted into the sll1981 and slr0370 sites, respectively. Interestingly, we found that the introduction of the ethylene-producing pathway eliminated the metabolic stress caused by the lack of OGDC and SSADH. As shown in Fig. 4B and C, sll1981::Kmr-PcpcB-efe (XX105) and slr0370::Cmr-PcpcB-efe (XX106) completely recovered their cell growth and oxygen evolution ability. Meanwhile, the fact that the physiological phenotypes of these efe transformants showed no significant differences from those of Synechocystis sp. PCC 6803 wild-type further verified the stable expression of the codon-optimized efe gene (Fig. 4B, C).
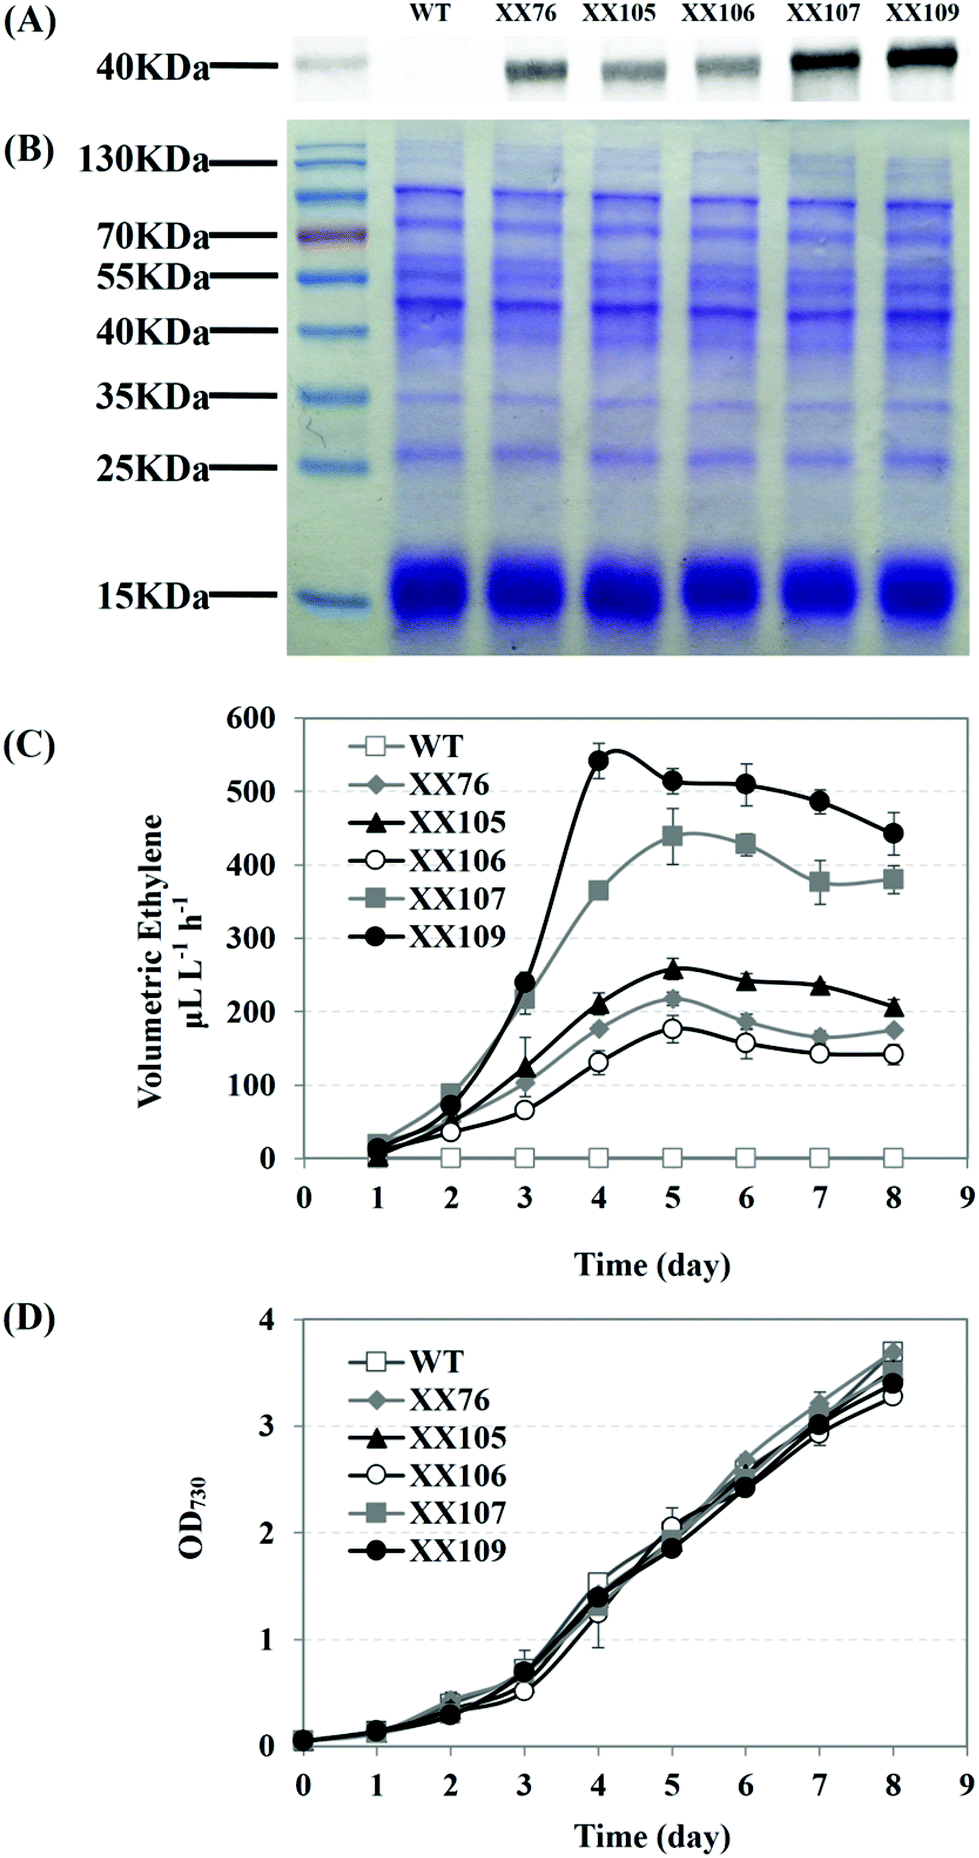 | ||
| Fig. 5 Ethylene production by Synechocystis sp. PCC 6803 mutants with expression of multiple efe copies at different gene loci. (A) Western blotting detection of EFE in recombinant ethylene-producing strains. Synechocystis sp. PCC 6803 wild-type was used as a control. (B) SDS-PAGE electrophoretogram. The proteins were loaded at equal amounts. (C) Comparison of ethylene production from Synechocystis recombinants harboring one copy of efe driven by PcpcB at slr0168 locus (XX76), sll1981 locus (XX105) and slr0370 (XX106); two copies of efe driven by PcpcB at both slr0168 and sll1981 loci (XX107); or three copies of efe driven by PcpcB at these three gene loci (XX109). Synechocystis sp. PCC 6803 wild-type was used as a control. (D) Growth curves of Synechocystis sp. PCC 6803 mutants. Synechocystis sp. PCC 6803 wild-type was used as a control. Data presented are means and standard deviation of two independent experiments, each with three replicates. | ||
The XX107 recombinant strain, which harbors two efe copies at the sites of slr0168 and sll1981, reached an ethylene productivity of 439 μL L−1 h−1 in the aerated cultivation (5% CO2) in 250 mL flasks. The strain with triple copies of efe (XX109) achieved a maximum ethylene production rate of 542 μL L−1 h−1, accompanied by the highest EFE expression level among all of the recombinants (Fig. 5A, B). All of these efe transformants showed similar growth abilities, according to the growth curve shown in Fig. 5D. Comparing the ethylene productivity of XX105 with that of XX76 indicated that the disruption of sll1981 led some metabolic flux to the ethylene-producing branch and then to higher ethylene productivity. Regarding XX106 and XX76 only inactivation of slr0370 seemed to have a tiny effect on the ethylene productivity. The improvement of the ethylene productivity might be explained as an integrated effect of increasing efe copy numbers and blocking the TCA cycle shunts.
Improving ethylene production by heterologous expression of 2-OG permease
The supply of 2-OG, the substrate of the EFE enzyme, is of great importance for ethylene production; 2-OG is also the carbon skeleton for the assimilation of nitrogen within cyanobacteria. 2-OG permease (KgtP) from E. coli, which showed 28% amino acid sequence identity to the glucose permease (GlcP) of Synechocystis sp. PCC 6803, has been reported to be able to actively incorporate 2-OG in Synechococcus elongatus PCC 7942 but to be detrimental to the growth of the kgtP-bearing strain.25 Since the inactivation of the phaAB operon had no effect on the cell growth reported by Taroncher-Oldenburg et al.50 the E. coli kgtP driven by PcpcB was integrated into the phaAB sites on the genome of Synechocystis strain XX109 in this study, resulting in strain XX110 (Fig. 4A, S5†). The XX110 strain grew normally in 1 × BG11 medium when it was cultivated in 50 mL shaking flasks without aeration and on the plate (data not shown). However, its growth was severely impacted when it was cultured in 1 × BG11 medium bubbled with 5% CO2 (Fig. 6A). Furthermore, XX110 lost the growing ability completely when it was cultivated under the aeration conditions with the addition of 1000 μM 2-OG (Fig. 6A). Possibilities leading to the negative effect of 2-OG feeding on the cell growth of the kgtP-bearing cyanobacteria mutant include the following: imbalance of metabolites within the cells, bioenergetic shortage caused by 2-OG transport and affecting other membrane transport functions, and the change of intracellular pH caused by the influx of a dicarboxylate, etc.25 Our finding that bubbling with 5% CO2 imposed greater stress on the growth of the kgtP-bearing mutant provoked us to focus on changing the culture conditions for a stable growth of XX110 under 2-OG feeding conditions. When the culture medium was changed to 5 × BG11*, the recombinant Synechocystis strain XX110 exhibited a stable growth phenotype, similar to XX109 under aerating conditions, regardless of whether 2-OG was added or not (Fig. 6A). Hence, these optimal culture conditions were used for the following ethylene production assays.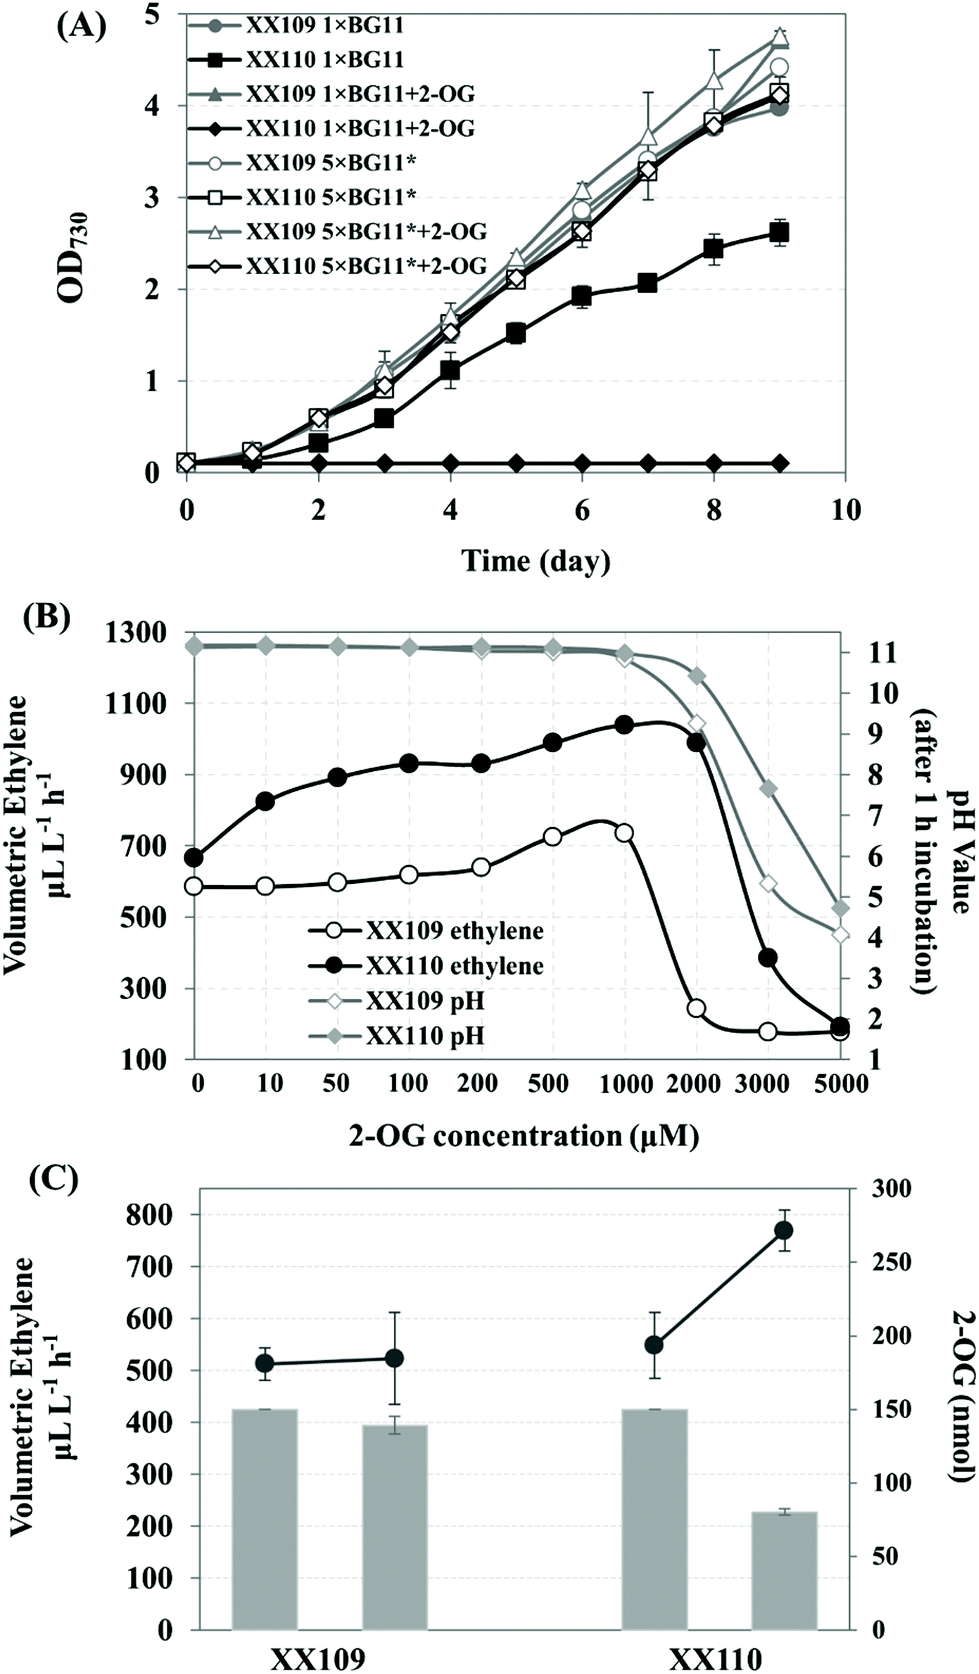 | ||
| Fig. 6 Effect of introducing the kgtP gene from E. coli on the growth and ethylene production in Synechocystis recombinants harboring triple copies of efe. (A) Growth curve of XX109 and XX110 in 1 × BG11 and 5 × BG11* medium, with or without 2-OG added. (B) Ethylene production and pH value (after 1 h incubation) of the culture of XX109 and XX110 at different concentrations of 2-OG. One milliliter normally cultivated cyanobacterial culture (OD730 ∼ 3.0) was split into sterile 10 mL penicillin bottles. Then a gradient concentration of 2-OG (from 0 to 5000 μM) were added to the corresponding bottles. The bottle was sealed and incubated for 1 h under standard culture conditions. Ethylene productivity was measured as mentioned in the materials and methods section. The pH values of the culture after the 1 h incubation were measured using a pH electrode. (C) Analysis of the incorporation of 2-OG within the ethylene-forming pathway in Synechocystis recombinants XX109 and XX110 fed with 2-OG. The amount of 2-OG in the culture medium was shown by grey columns. Left columns represent before 1 hour incubation, and right columns represent after 1 hour after incubation. The increasing ethylene production was shown by lines above the grey columns. Data presented are the means and standard deviation of two independent experiments, each with three replicates. | ||
For the sake of determining whether the addition of 2-OG promotes ethylene production, a series of concentrations of 2-OG were added to the 5 × BG11* culture medium. As shown in Fig. 6B, the ethylene productivity of XX110 increased more than that of XX109 when both strains were fed with less than 1 mM 2-OG. It is reasonable to suggest that XX110 can assimilate 2-OG actively from the medium; however, the uptake of 2-OG in XX109 is dependent on diffusion. Surprisingly, when the concentration of 2-OG rose beyond 1 mM, the ethylene productivity of XX109 decreased sharply, whereas XX110 encountered a similar problem when the concentration of 2-OG exceeded 2 mM (Fig. 6B). This phenomenon was most likely caused by the acid stress on the cell because the pH value in the medium started to decrease at 1 mM 2-OG. As a result, 1 mM was used as the optimal concentration of exogenous added 2-OG for ethylene production.
The amount of 2-OG flowing to the ethylene-forming pathway was calculated using the 2-OG concentration assay kit. To avoid the effect of low-affinity uptake mentioned by Vazquez-Bermudez and coworkers at high 2-OG concentrations,25 a total amount of 150 nmol 2-OG was added to 1 mL culture sealed in a penicillin bottle (2-OG concentration in the culture was 150 μM). As shown in Fig. 6C, the extracellular 2-OG in the culture of XX110 (OD730 ∼ 3.0) dropped from 150 nmol to 80 nmol, while no obvious decrease was found in the culture of XX109 (OD730 ∼ 3.0). In the meantime, there was an increase in ethylene production from 548 μL−1 L−1 h−1 to 769 μL−1 L−1 h−1 in XX110 culture. Based on the reaction catalyzed by EFE (Fig. 1A),51 the increased 221 nL (221 μL−1 L−1 h−1 × 1 mL × 1 h) ethylene needs approximately 9.886 nmol of 2-OG substrate, accounting for 14% of the uptaken 2-OG (70 nmol), which means that 14% of the uptaken 2-OG flows into the EFE pathway in 1 hour at a feeding concentration of 150 μM. As mentioned above, 2-OG stands at the crossroad between the carbon and nitrogen metabolism. The incorporated 2-OG in XX110 might function not only as a substrate for ethylene synthesis but also as a regulator affecting C/N metabolic flux. Transporting 2-OG into the cells, in combination with increasing the concentration of nutrients, afforded the kgtP-bearing strain XX110 a stable and improved ethylene-producing capacity. The phenotypes of cell growth and oxygen evolution of XX110 in 5 × BG11* indicated a coordinated metabolic status in this recombinant strain (Fig. 4B, C). Ultimately, 2-OG feeding led to a higher ethylene volumetric production rate of 1038 μL L−1 h−1 (Fig. 6B).
Improving ethylene production by modifying semi-continuous cultivation
It was reported that fresh BG11 medium resuspension could recover the ethylene synthetic capacity of the recombinant ethylene-producing strains.3 Although the components of such a medium leading to this recovery were not clear yet, it was known that neither nitrogen-addition nor nitrogen-depletion contributed to the ethylene yield.3 At the same time, it was found that the intracellular concentration of 2-OG increased under nitrogen starvation conditions.52,53 Because ethylene production and nitrogen assimilation are competitive pathways, the condition of relatively limited nitrogen might facilitate cyanobacterial self-regulation of an intracellular pool of 2-OG, glutamine, amino acids and γ-aminobutyric acid (GABA), enabling higher ethylene productivity. So, in the semi-continuous cultivation here, 5 × BG11* was used to resuspend the previously cultured recombinant strain XX110 in 250 mL flasks containing 200 mL culture. The initial inoculation concentration was OD730 ∼ 0.1, and a 6-day culture process followed by a 21-day collection–resuspension repeating process was employed. The resuspension of the previous culture (without dilution) in fresh 5 × BG11* was repeated every 3 days. Ethylene production was measured every day over the course of the experiment. During incubation in the sealed penicillin bottle, 1 mM 2-OG was added to XX110 culture; the sample without 2-OG was used as the control. As shown in Fig. 7, the ethylene production rate varied according to the resuspension time point and as to whether 2-OG was added. High-level ethylene production resumed gradually after resuspension in fresh 5 × BG11* and declined after reaching a peak yield at the end of each resuspension cycle (Fig. 7A). Obviously the ethylene productivity of XX110 fed with 2-OG was higher than that without 2-OG. At the end of the third resuspension cycle, the ethylene productivity had reached 6120 μL L−1 h−1, which surpassed the highest cyanobacterial ethylene production (5650 μL L−1 h−1) that had ever been reported.3 The peak ethylene production rates of 9739 μL L−1 h−1 (2-OG feeding) and 7514 μL L−1 h−1 (no 2-OG feeding) were achieved finally in the semi-continuous culture of XX110 (Fig. 7A). Compared with the collection–resuspension process, the rise in volumetric ethylene production rate was not so high in the early culture process (the first 6 days); this might be the result of the primary carbon flux toward biomass accumulation. Hence, it is reasonable to suggest that the specific ethylene production rate went through a rapid decline when normalizing a high OD730 (Fig. 7B). Even so, the specific ethylene production rate achieved in this study exceeded all others ever reported, and the highest rate of 858 μL L−1 h−1 OD730−1 was reached in the culture process (Fig. 7B). Regular medium replenishment could recover the cell growth which it otherwise should have ceased, and the tendency toward cell growth was generally in agreement with what was reported by Ungerer and coworkers3 (Fig. 7C). 2-OG feeding was proven to have no obvious promoting effect on the ethylene production of the XX109 (Fig. S6†), further verifying the viewpoint that extracellular 2-OG cannot be effectively assimilated by the Synechocystis sp. PCC 6803 wild-type.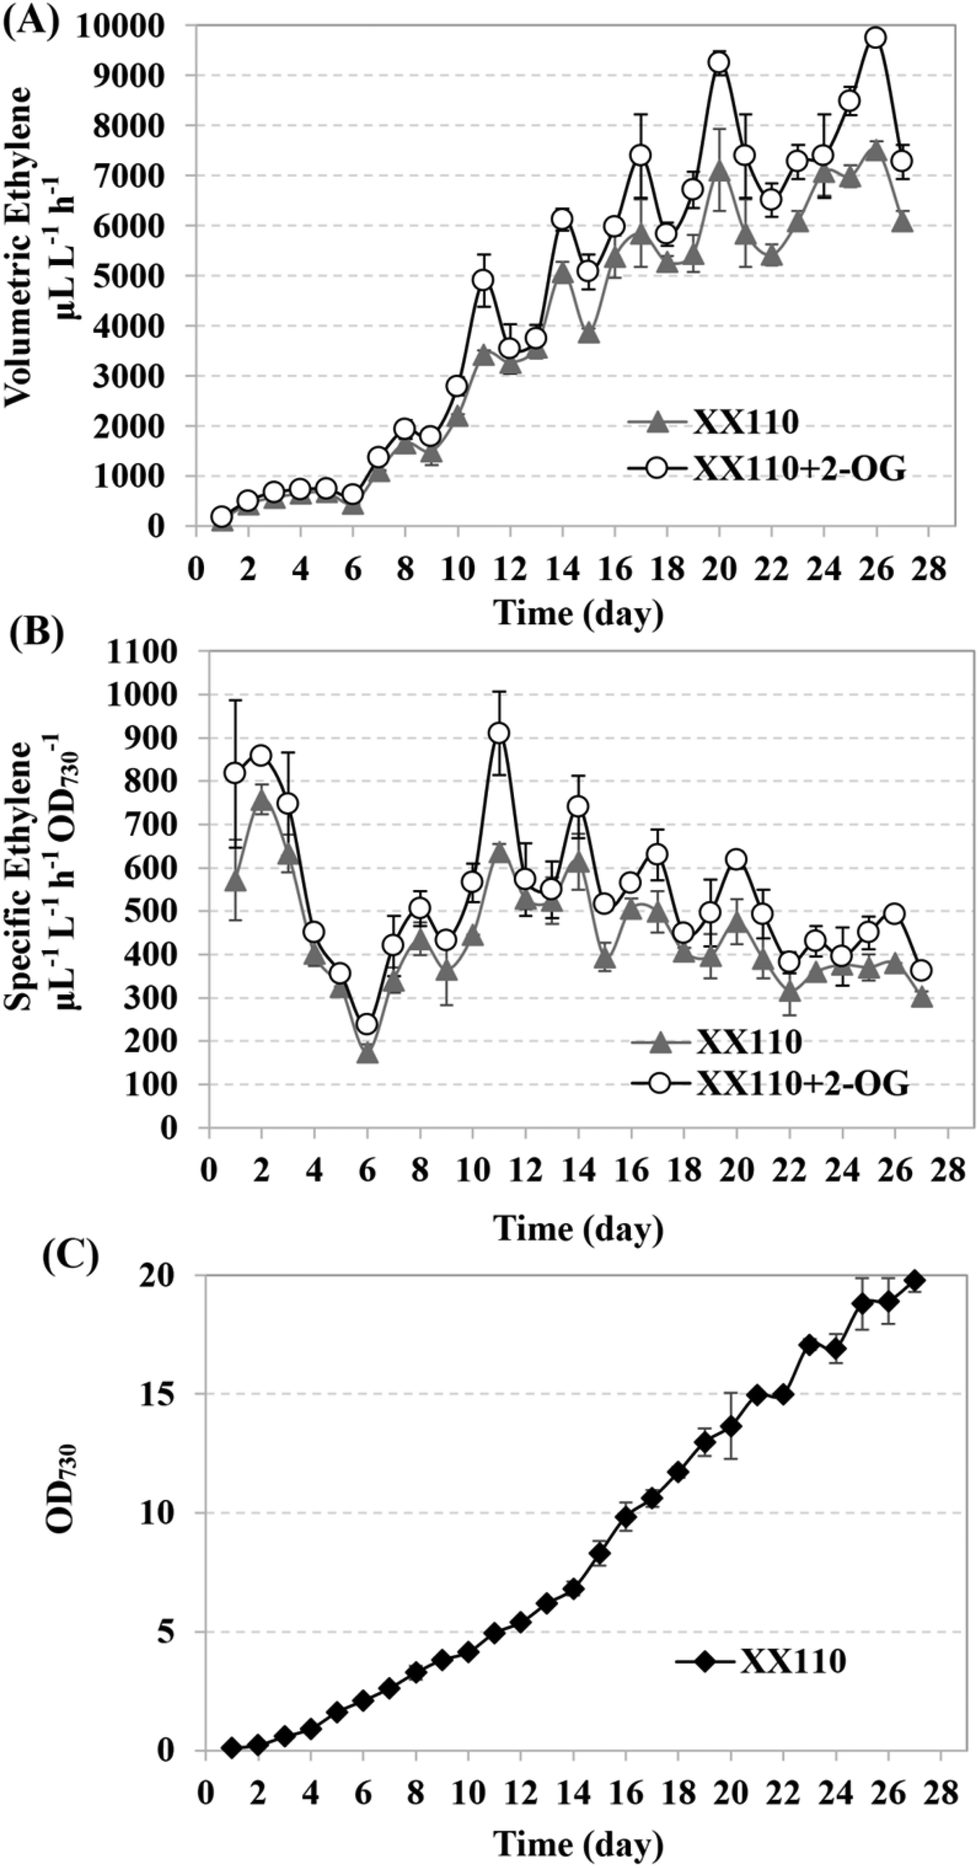 | ||
| Fig. 7 Cultivation and resuspension of XX110 recombinants in fresh 5 × BG11* medium, with 2-OG added or not. (A) Total ethylene production rate; (B) specific ethylene production rate; (C) growth curve of XX110 in 5 × BG11* medium in the semi-continuous cultivation. Data presented are the means and standard deviation of two independent experiments, each with three replicates. | ||
Finally, a modified gaseous/aqueous two-phase photobioreactor54 was used for ethylene continuous collection (Fig. S7†). As shown in Fig. S8A,† the three dilutions administered in the experiment changed the cell density from OD730 ∼ 4.0 (prior to the dilution) to about OD730 ∼ 2.5 (after the dilution) for both XX109 and XX110 cultures. A total of more than 31119 μL ethylene in XX109 and 50633 μL ethylene in XX110 with 2-OG feeding was finally collected during the fed-bath culture process (Fig. S8B†). These results once again reinforced the advantage of introducing KgtP and 2-OG feeding for ethylene biosynthesis. Although a preliminary gaseous/aqueous two-phase photobioreactor for cyanobacterial ethylene production was developed and showed potential in this study, it remains to be optimized for ethylene production with higher efficiency and feasible scalability.
Conclusions
In this study, a series of genetically engineered Synechocystis strains were constructed for the photosynthetic production of ethylene. First, stable ethylene production was achieved by introducing a codon-optimized efe gene from Pseudomonas syringae pv. sesami. Second, PcpcB was identified as an appropriate promoter for ethylene biosynthesis with a high efficiency in Synechocystis sp. PCC 6803. Third, the EFE protein expression level and the ethylene production were significantly enhanced with the increasing efe copy number at the gene loci of ogdc and ssadh of the TCA cycle, and the metabolic stress caused by the inactivation of ogdc and/or ssadh was well released by the introduction of the EFE enzyme as an alternative. Fourth, feeding 2-OG was efficiently assimilated by the recombinants with an exogenous 2-OG permease (KgtP) at the phaAB operon, and at least 14% of the incorporated 2-OG was used for ethylene biosynthesis. The recombinant Synechocystis XX110 strain displayed robust growth and high-efficiency ethylene productivity under the modified cultivation conditions, and a peak ethylene production rate of 9739 μL L−1 h−1 (295 mg L−1 day−1) was achieved. Finally, a modified gaseous/aqueous two-phase photobioreactor with an efficient ethylene collecting section was developed. By the fed-bath cultivation of the ethylene producer XX110 with a period of 16 days in the 1 L photobioreactor, a total of more than 50 mL ethylene product was collected. The achieved ethylene productivity in the study shows the promising application potential for direct photosynthetic production of ethylene.Acknowledgements
This work was supported by the Excellent Youth Award of Shandong Natural Science Foundation (JQ201306 to X. Lu), the Shandong Taishan Scholarship (X. Lu) and the Youth Innovation Promotion Association (Z. Li and X. Tan). We would like to thank Prof. X. Xu for kindly offering the plasmids pRL271 and pRL446, and C. Wang, Z. Zhu, F. Liang, X. Liu, and L. Yao for their technical assistance.References
- J. R. Ecker, Science, 1995, 268, 667–675 CrossRef CAS.
- L. Koottungal, Oil Gas J., 2013, 111, 96–103 Search PubMed.
- J. Ungerer, L. Tao, M. Davis, M. Ghirardi, P. C. Maness and J. P. Yu, Energy Environ. Sci., 2012, 5, 8998–9006 CAS.
- P. Haro, P. Ollero and F. Trippe, Fuel Process. Technol., 2013, 114, 35–48 CrossRef CAS PubMed.
- D. O. Adams and S. F. Yang, Proc. Natl. Acad. Sci. U. S. A., 1979, 76, 170–174 CrossRef CAS.
- H. Kende, Annu. Rev. Plant. Physiol., 1993, 44, 283–307 CrossRef CAS.
- H. Fukuda, T. Ogawa and S. Tanase, Adv. Microb. Physiol., 1993, 35, 275–306 CrossRef CAS.
- H. Fukuda, M. Takahashi, T. Fujii, M. Tazaki and T. Ogawa, FEMS Microbiol. Lett., 1989, 60, 107–111 CAS.
- K. Nagahama, K. Yoshino, M. Matsuoka, M. Sato, S. Tanase, T. Ogawa and H. Fukuda, Microbiology, 1994, 140, 2309–2313 CrossRef CAS PubMed.
- K. Nagahama, T. Ogawa, T. Fujii, M. Tazaki, S. Tanase, Y. Morino and H. Fukuda, J. Gen. Microbiol., 1991, 137, 2281–2286 CrossRef CAS PubMed.
- J. P. Wang, L. X. Wu, F. Xu, J. Lv, H. J. Jin and S. F. Chen, Bioresour. Technol., 2010, 101, 6404–6409 CrossRef CAS PubMed.
- L. Tao, H. Dong, X. Chen, S. Chen and T. Wang, Appl. Microbiol. Biotechnol., 2008, 80, 573–578 CrossRef CAS PubMed.
- X. Chen, Y. Liang, J. Hua, L. Tao, W. S. Qin and S. F. Chen, Int. J. Biol. Sci., 2010, 6, 96–106 CrossRef CAS.
- I. Pirkov, E. Albers, J. Norbeck and C. Larsson, Metab. Eng., 2008, 10, 276–280 CrossRef CAS PubMed.
- N. Johansson, P. Quehl, J. Norbeck and C. Larsson, Microb. Cell. Fact., 2013, 12 Search PubMed.
- X. F. Lu, Biotechnol. Adv., 2010, 28, 742–746 CrossRef CAS PubMed.
- I. M. P. Machado and S. Atsumi, J. Biotechnol., 2012, 162, 50–56 CrossRef CAS PubMed.
- H. Fukuda, M. Sakai, K. Nagahama, T. Fujii, M. Matsuoka, Y. Inoue and T. Ogawa, Biotechnol. Lett., 1994, 16, 1–6 CrossRef CAS.
- M. Sakai, T. Ogawa, M. Matsuoka and H. Fukuda, J. Ferment. Bioeng., 1997, 84, 434–443 CrossRef CAS.
- K. Takahama, M. Matsuoka, K. Nagahama and T. Ogawa, J. Biosci. Bioeng., 2003, 95, 302–305 CrossRef CAS.
- F. Guerrero, V. Carbonell, M. Cossu, D. Correddu and P. R. Jones, PLoS One, 2012, 7(11) CAS , e50470.
- J. D. Young, A. A. Shastri, G. Stephanopoulos and J. A. Morgan, Metab. Eng., 2011, 13, 656–665 CrossRef CAS PubMed.
- H. Knoop, M. Grundel, Y. Zilliges, R. Lehmann, S. Hoffmann, W. Lockau and R. Steuer, PLoS Comput. Biol., 2013, 9 Search PubMed.
- S. Zhang and D. A. Bryant, Science, 2011, 334, 1551–1553 CrossRef CAS PubMed.
- M. F. Vazquez-Bermudez, A. Herrero and E. Flores, J. Bacteriol., 2000, 182, 211–215 CrossRef CAS.
- J. Elhai and C. P. Wolk, Gene, 1988, 68, 119–138 CrossRef CAS.
- T. A. Black, Y. P. Cai and C. P. Wolk, Mol. Microbiol., 1993, 9, 77–84 CrossRef CAS PubMed.
- X. M. Tan, L. Yao, Q. Q. Gao, W. H. Wang, F. X. Qi and X. F. Lu, Metab. Eng., 2011, 13, 169–176 CrossRef CAS PubMed.
- X. M. Tan, F. Y. Liang, K. Cai and X. F. Lu, Appl. Microbiol. Biotechnol., 2013, 97, 6373–6382 CrossRef CAS PubMed.
- J. G. K. Williams, in Methods in Enzymology, ed. A. N. G. Lester Packer, Academic Press, 1988, vol. 167, pp. 766–778 Search PubMed.
- J. C. Meeks and Rw. Castenho, Arch. Microbiol., 1971, 78, 25–41 CAS.
- H. Fukuda, T. Ogawa, M. Tazaki, K. Nagahama, T. Fujii, S. Tanase and Y. Morino, Biochem. Biophys. Res. Commun., 1992, 188, 483–489 CrossRef CAS.
- H. Fukuda, T. Ogawa, K. Ishihara, T. Fujii, K. Nagahama, T. Omata, Y. Inoue, S. Tanase and Y. Morino, Biochem. Biophys. Res. Commun., 1992, 188, 826–832 CrossRef CAS.
- F. I. Rodriguez, J. J. Esch, A. E. Hall, B. M. Binder, G. E. Schaller and A. B. Bleecker, Science, 1999, 283, 996–998 CrossRef CAS.
- H. Weingart, B. Volksch and M. S. Ullrich, Phytopathology, 1999, 89, 360–365 CrossRef CAS PubMed.
- X. Y. Liu, J. Sheng and R. Curtiss, Proc. Natl. Acad. Sci. U. S. A., 2011, 108, 6899–6904 CrossRef CAS PubMed.
- B. M. Berla, R. Saha, C. M. Immethun, C. D. Maranas, T. S. Moon and H. B. Pakrasi, Front. Microbiol., 2013, 4, 246 Search PubMed.
- G. K. Agrawal, H. Kato, M. Asayama and M. Shirai, Nucleic Acids Res., 2001, 29, 1835–1843 CrossRef CAS PubMed.
- T. Heidorn, D. Camsund, H. H. Huang, P. Lindberg, P. Oliveira, K. Stensjo and P. Lindblad, Methods Enzymol., 2011, 497, 539–579 CAS.
- M. Imashimizu, S. Fujiwara, R. Tanigawa, K. Tanaka, T. Hirokawa, Y. Nakajima, J. Higo and M. Tsuzuki, J. Bacteriol., 2003, 185, 6477–6480 CrossRef CAS.
- T. Onizuka, H. Akiyama, S. Endo, S. Kanai, M. Hirano, S. Tanaka and H. Miyasaka, FEBS Lett., 2003, 542, 42–46 CrossRef CAS.
- L. A. Allison and P. Maliga, EMBO J., 1995, 14, 3721–3730 CAS.
- U. Nair, C. Thomas and S. S. Golden, J. Bacteriol., 2001, 183, 1740–1747 CrossRef CAS PubMed.
- R. Webb, K. J. Reddy and L. A. Sherman, J. Bacteriol., 1990, 172, 5079–5088 CAS.
- A. Valladares, A. M. Muro-Pastor, A. Herrero and E. Flores, J. Bacteriol., 2004, 186, 7337–7343 CrossRef CAS PubMed.
- D. Steinhauser, A. R. Fernie and W. L. Araujo, Trends Plant Sci., 2012, 17, 503–509 CrossRef CAS PubMed.
- J. C. Meeks, Science, 2011, 334, 1508–1509 CrossRef CAS PubMed.
- O. Maestri and F. Joset, Mol. Microbiol., 2000, 37, 828–838 CrossRef CAS.
- A. Chatterjee, K. G. Dastidar, S. Maitra, A. Das-Chatterjee, H. Dihazi, K. Eschrich and A. L. Majumder, Planta, 2006, 224, 367–379 CrossRef CAS PubMed.
- G. Taroncher-Oldenburg, K. Nishina and G. Stephanopoulos, Appl. Environ. Microbiol., 2000, 66, 4440–4448 CrossRef CAS.
- H. Fukuda, T. Ogawa, M. Tazaki, K. Nagahama, T. Fujii, S. Tanase and Y. Morino, Biochem. Biophys. Res. Commun., 1992, 188, 483–489 CrossRef CAS.
- A. Merida, P. Candau and F. J. Florencio, J. Bacteriol., 1991, 173, 4095–4100 CAS.
- M. I. Muro-Pastor, J. C. Reyes and F. J. Florencio, J. Biol. Chem., 2001, 276, 38320–38328 CAS.
- F. K. Bentley and A. Melis, Biotechnol. Bioeng., 2012, 109, 100–109 CrossRef CAS PubMed.
Footnotes |
| † Electronic supplementary information (ESI) available. See DOI: 10.1039/c4gc01730g |
| ‡ These authors contributed equally to this work. |
| This journal is © The Royal Society of Chemistry 2015 |