
Conversion of wheat straw into formic acid in NaVO3–H2SO4 aqueous solution with molecular oxygen†
Muge
Niu
a,
Yucui
Hou
b,
Shuhang
Ren
a,
Weize
Wu
*a and
Kenneth N.
Marsh
*c
aState Key Laboratory of Chemical Resource Engineering, Beijing University of Chemical Technology, Beijing 100029, China. E-mail: wzwu@mail.buct.edu.cn; Fax: +86 10 64427603
bDepartment of Chemistry, Taiyuan Normal University, Taiyuan 030031, China
cCenter for Energy, School of Mechanical and Chemical Engineering, The University of Western Australia, Crawley, WA 6009, Australia. E-mail: ken.marsh@uwa.edu.au
First published on 12th September 2014
Abstract
Formic acid (FA) is an important material widely used in the chemical industry and in processes involved in energy storage and transformation. In this work, production of FA from wheat straw, an abundant lignocellulosic biomass, in NaVO3–H2SO4 aqueous solution with molecular oxygen (O2) was studied. The conversion showed high efficiencies: 47% (based on carbon, 75.2% based on mass) of FA and 7.3% (based on carbon, 7.6% based on mass) of acetic acid were obtained. The products mainly come from polysaccharides (hemicellulose and cellulose) in wheat straw. Acetic acid is derived from the acetyl groups in (1) the hemicellulose structure or (2) the deep hydrolysis product, levulinic acid. The removal of each lignocellulosic component in wheat straw follows the order: hemicellulose, lignin and cellulose. The catalytic system shows good reusability, and multiple feedings led to a high concentration of FA, which is beneficial to reduce FA–water separation cost.
1. Introduction
Formic acid (FA), the simplest carboxylic acid, is an important material widely used in industry. Besides the traditional use in chemical, agricultural, pharmaceutical, textile and rubber industries, FA recently has been recognized as a form of hydrogen storage as it is easily degraded to hydrogen at room temperature by catalytic conversion.1–6 Furthermore, FA can be used in fuel cells to efficiently generate electricity.7–9 Conversion of biomass, the most abundant renewable resource to FA could be considered as a “green” energy transformation from a low grade energy form to a higher grade form.Recently, FA production from biomass in hot water with molecular oxygen (O2) as an oxidant using a vanadium(V)-containing homogeneous catalyst has been demonstrated to be a promising process.10–14 This conversion has a high selectivity to FA. The conversion is efficient when the bio-based monosaccharides are used as substrates. Wasserscheid et al.10 first studied biomass conversion under hydrothermal conditions from 60 to 90 °C using the heteropoly acid H5PV2Mo10O40 as a catalyst. The pentavalent vanadium was found to be the active component of the catalyst. Monosaccharides could be fully converted and the FA yields could reach ≈50% (based on carbon, 7 h at 70 °C). Fu et al.11 studied glucose conversion to FA using the same catalyst at elevated temperatures from 100 to 170 °C. The FA yield from glucose (55% in 3 h at 100 °C) was comparable to the results of Wasserscheid et al. The efficiency was low when cellulose, the highly polymerized biomass, was transformed. Cellulose was minimally converted and the FA yield was very low (7% in 24 h at 90 °C12 and 3% in 9 h at 170 °C11). When organic acid (p-toluene sulfonic acid, TSA12) and inorganic acid (HCl11) were chosen to accelerate the cellulose degradation, the FA yield was raised to 19% and 34%, respectively. Subsequently, an alternative heteropoly acid H8PV5Mo7O40 was synthesized and used as a catalyst with TSA as an additive, and a 28% yield of FA was obtained.13
In our previous work, the readily-available NaVO3 was used as the catalyst to convert cellulose to yield FA in H2SO4 aqueous solution.14 When dissolved in acidic solution with pH less than 1, NaVO3 exists in the form of VO2+, which shows a high activity to catalyze the conversion to yield FA. The FA yield could reach ≈60% in 2 h at 160 °C. In NaVO3–H2SO4 aqueous solution, cellulose can be relatively easily converted and FA can be obtained in high yield compared with the use of V-containing heteropoly acid aqueous solution.
From the viewpoint of industrial applications the direct transformation of raw materials to chemicals is preferable. Due to the high content of polysaccharides, raw lignocellulosic materials, which are abundant and widely distributed, have great potential to produce FA. So far, the conversion of raw lignocellulosic materials to FA is inefficient, and related research is limited.12
Wheat straw, the second largest biomass feedstock in the world,15 is an abundant agriculture residue with low commercial value. In this work, conversion of wheat straw in the highly efficient NaVO3–H2SO4 aqueous solution with O2 along with the effects of various reaction parameters on the conversion were studied. The results showed that the conversion of wheat straw could yield 47% FA and 7.3% acetic acid. The contributions of each component of wheat straw and the reason for acetic acid formation were investigated in detail. Then the removal order of each component of wheat straw was studied by 13C CPMAS NMR. Lastly, the reusability of the catalytic solution was investigated, and the result demonstrates good reusability through several runs.
2. Experimental section
2.1 Materials and analysis method
Wheat straw was obtained from Xinjiang county, Shanxi province. It was dried at 60 °C for 24 h and milled into powder (<40 mesh) before use. The elemental analysis of wheat straw was carried out through a CHNS elemental analyzer (Vario EL cube, Germany). The components (water extracts, cellulose, hemicellulose, lignin and ash) of wheat straw were analyzed according to the Van Soest method.16 The analysis results are shown in Tables 1 and 2. Microcrystalline cellulose (96%), xylan and sodium metavanadate (NaVO3, AR) were purchased from Aladdin Reagent Inc. (Shanghai, China). Sulfuric acid (H2SO4, 98%) was purchased from Beijing Modern Oriental Fine Chemical Co., Ltd (Beijing, China). Oxygen (O2, 99.995%) and nitrogen (N2, 99.999%) were supplied by Beijing Haipu Gases Co., Ltd (Beijing, China). All reagents were of analytical grade and were used without further purification.| Element | C | H | O | N | S |
|---|---|---|---|---|---|
| 100w | 41.73 | 5.434 | 52.115 | 0.556 | 0.165 |
| Component | Extraction | Cellulose | Hemicellulose | Lignin | Ash |
|---|---|---|---|---|---|
| a The components of wheat straw were analyzed according to the Van Soest method. | |||||
| 100w | 27.4 | 38.2 | 29.3 | 4.1 | 1.0 |
2.2 Conversion of substrates
A series of NaVO3–H2SO4 aqueous solutions with different mass fractions (NaVO3: 0.35%, H2SO4: 0%, 0.7%, 1%, 1.5%, 2% and 2.5%) were prepared before the conversion. In a typical procedure, a known amount of NaVO3 was first dissolved in distilled water by ultrasonic heating. Then, a known mass of H2SO4 was diluted with distilled water and mixed with the NaVO3 solution. The mixed solution was then diluted to a known volume with distilled water to make the mass fractions listed above.The conversion was carried out in a 25 cm3 batch reactor made of Hastelloy alloy (HC 276) containing a magnetic stirrer. In a typical procedure, a known mass of the substrate and 6.0 cm3 of NaVO3–H2SO4 aqueous solution were loaded into the reactor. The reactor was then sealed and purged with O2. After that, O2 was charged into the reactor to a desired pressure. Next, the reactor was put into a furnace with a heating rate of 24 to 30 °C min−1 and stirred at 1000 r min−1. The pressure and the temperature of the reactor were monitored using a pressure transducer with an uncertainty of ±0.025 MPa and a thermocouple with an uncertainty of ±0.5 °C, respectively. The reaction time was recorded from the time when the desired reaction temperature was reached (about 5 min after being put into the furnace). After the required reaction time, the reactor was quenched in a cold water bath, and when the reactor reached room temperature, the gases in the reactor were released and the liquid mixture was filtered. The residues were washed with distilled water and dried in an oven at 60 °C for 24 h before further analysis. The liquid samples were analyzed by HPLC.
2.3 Analysis of products
The liquid samples were analyzed by high-performance liquid chromatography (HPLC, Waters 2695, USA) with a Shodex SH 1011 column (Shodex, Japan). A differential refractive index detector (Waters 4110, USA) was employed to analyze other products. The column oven temperature was 55 °C and the mobile phase was diluted H2SO4 aqueous solution with a concentration of 0.01 mol dm−3 and a flow rate of 0.5 cm3 min−1. The yields of products were calculated on a carbon base, unless otherwise specified. The conversion of wheat straw was calculated by the difference in solid mass before and after the reaction. The 13C CPMAS NMR investigations of the original wheat straw and the residues after conversion were performed on a Bruker AV300 NMR spectrometer at a resonance frequency of 75.47 MHz. Chemical shifts were referenced relative to TMS.2.4 Recycle of the catalytic system
After completion of the conversion, the solid was separated by filtration. The liquid products were extracted with diethyl ether. Then the diethyl ether dissolved in the liquid was swept by N2 at 50 °C in 10 min. Water was added to the recovered liquid system to fit the original volume before the next run.3. Results and discussion
3.1 Conversion of wheat straw
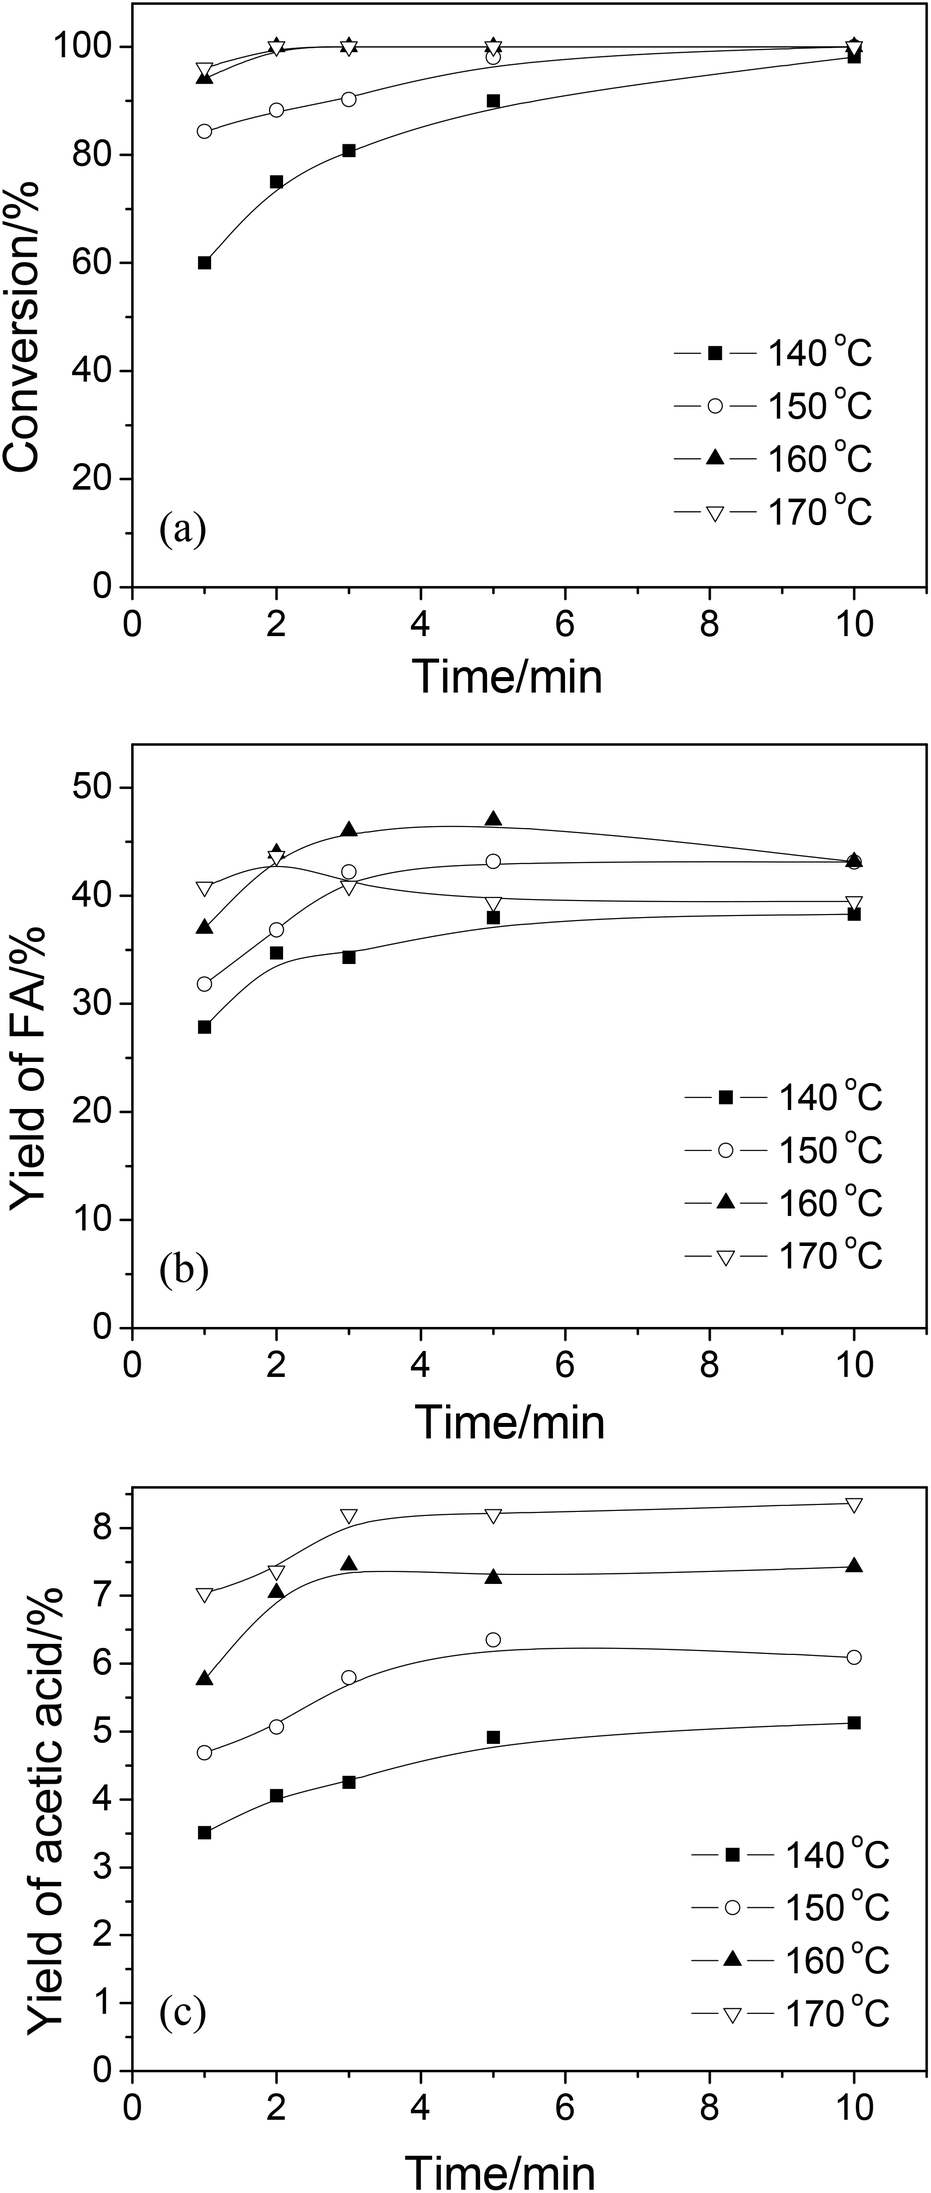 | ||
| Fig. 1 The effect of temperature on (a) conversion of wheat straw, (b) FA yield and (c) acetic acid yield at different reaction times. Conditions: wheat straw, 0.05 g; H2SO4, mass fraction w = 2%; NaVO3, w = 0.35%; H2O, 6.0 cm3; O2, 3 MPa. | ||
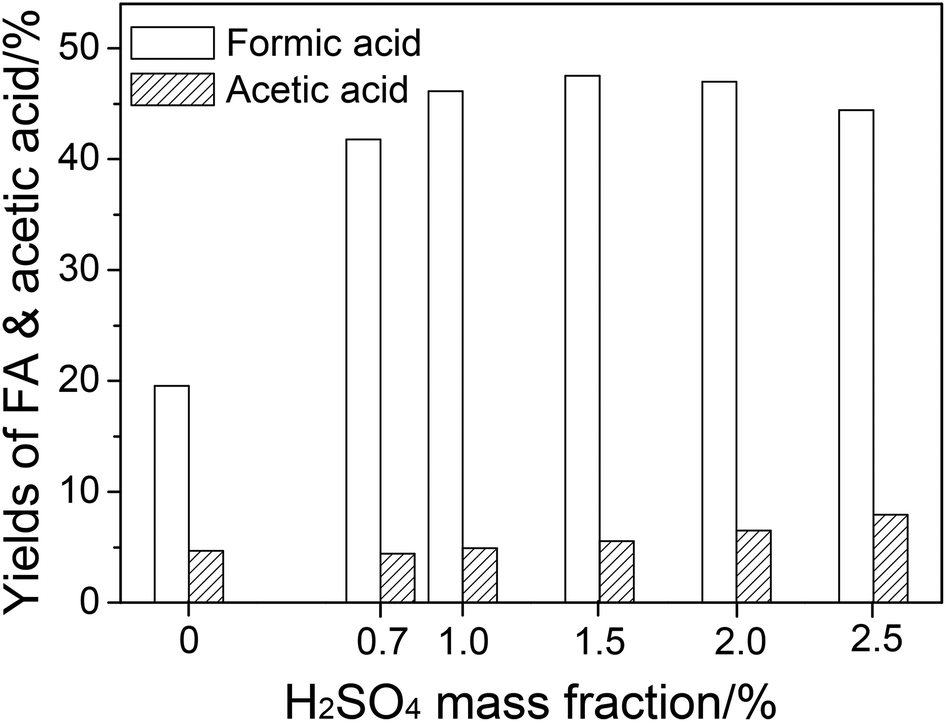 | ||
| Fig. 2 The effect of H2SO4 mass fraction on FA and acetic acid yields. Conditions: wheat straw, 0.05 g; NaVO3, w = 0.35%; H2O, 6.0 cm3; O2, 3 MPa; temperature, 160 °C; time, 5 min. | ||
FA and acetic acid are oxidative products in the catalytic system. Hence, O2 pressure could influence the product distribution significantly. The effect of O2 pressure on the yields of FA and acetic acid is shown in Fig. 3. When the O2 pressure was increased, the catalytic oxidation to FA was accelerated, so the FA yield increased. When O2 pressure was raised to 5 MPa, FA became unstable and was overoxidized, resulting in a decrease in FA yield (Fig. S3†). At low O2 pressure, the production rate of acetic acid was low. An increase in the O2 pressure increased the oxidation rate, which led to an increase of acetic acid yield. At high O2 pressure, the catalytic oxidation from monosaccharides to FA also accelerated and had a competitive relationship with deep hydrolysis, which led to acetic acid formation (via levulinic acid by oxidation, as described in the last paragraph). Therefore, the acetic acid yield decreased.
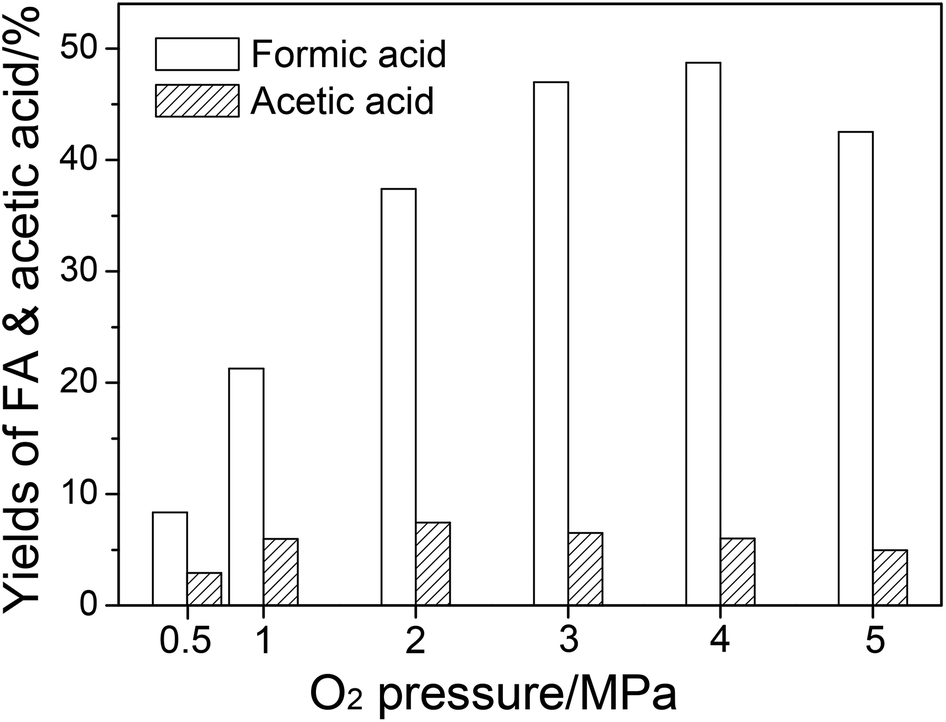 | ||
| Fig. 3 The effect of O2 pressure on FA and acetic acid yields. Conditions: wheat straw, 0.05 g; H2SO4, w = 2%; NaVO3, w = 0.35%; H2O, 6.0 cm3; temperature, 160 °C; time, 5 min. | ||
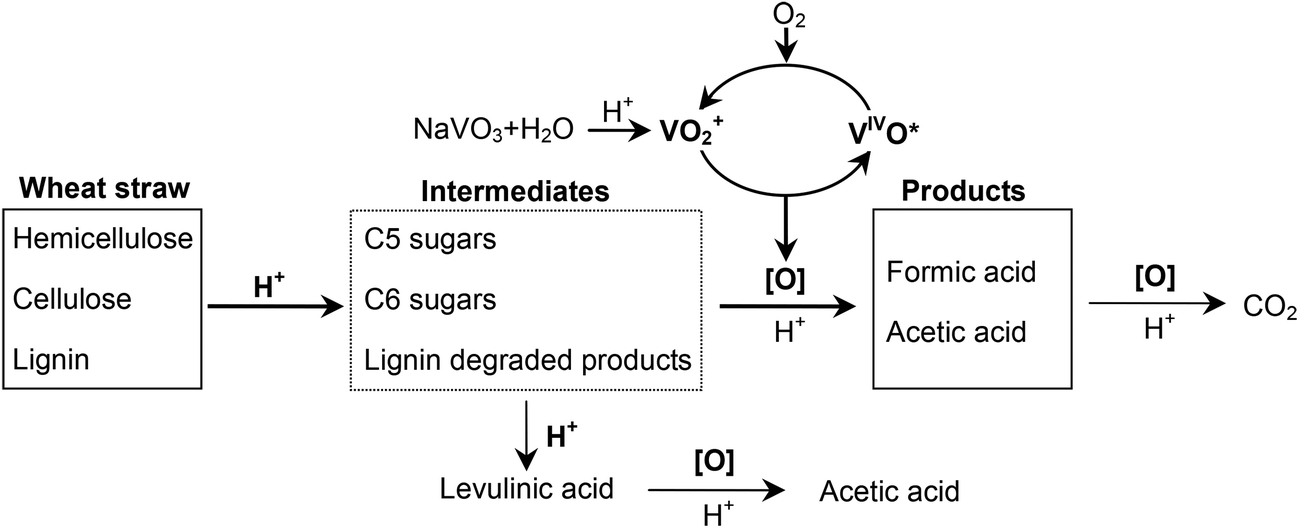 | ||
| Fig. 4 Proposed reaction pathways for the wheat straw conversion into FA and acetic acid and the role of VO2+ in NaVO3–H2SO4 aqueous solution with O2. | ||
3.2 The sources of products in wheat straw conversion
As shown above, two main products—FA and acetic acid—were formed after the conversion. In Table 3, experiments with various lignocellulosic components as substrates were carried out to give the contribution of each component to the products. For convenience, the yields mentioned in this section were based on mass. The contribution of each component to the product was calculated using the following formula:| Contribution = yield of product × mass fraction of the component in wheat straw |
| Entry | Substrate | Conversion w/% | FA yield w/% | Acetic acid yield w/% | Contribution to FA w/% | Contribution to acetic acid w/% |
|---|---|---|---|---|---|---|
| Conditions: substrate, 0.05 g; H2SO4, w = 2%; NaVO3, w = 0.35%; H2O, 6.0 cm3; O2: 3 MPa; temperature, 160 °C; time, 5 min.a No O2 (replaced by N2) or NaVO3.b No NaVO3. | ||||||
| 1 | Wheat straw | 100 | 75.2 | 7.6 | 75.2 | 7.6 |
| 2 | NDF | 100 | 101.4 | 9.7 | 73.6 | 7.0 |
| 3 | ADF | 100 | 91.8 | 5.7 | 39.7 | 2.5 |
| 4 | Lignin | 88.0 | 16.5 | 4.5 | 0.7 | 0.2 |
| 5 | Cellulose | 97.6 | 94.6 | 1.9 | 36.1 | 0.7 |
| 6 | Xylan | 80.6 | 85.6 | 4.2 | 25.1 | 1.2 |
| 7a | Wheat straw | 82.4 | — | 1.8 | — | 1.8 |
| 8b | Wheat straw | 96.8 | 30.3 | 7.2 | 30.3 | 7.2 |
The mass fraction of each component was based on the data in Table 2.
The conversion of wheat straw in the catalytic system is listed for comparison (Table 3, entry 1). The neutral detergent fiber (NDF, obtained after a neutral detergent wash of wheat straw using the Van Soest method16), mainly containing the structured components: cellulose, hemicellulose and lignin, gave contributions of 73.6% and 7.0% to FA and acetic acid, respectively (Table 3, entry 2). These contributions are very close to those of the raw material, wheat straw (75.2% and 7.6%, Table 3, entry 1). This indicates that most of the FA and acetic acid are obtained from the structured components in wheat straw: cellulose, hemicellulose and lignin (see Fig. 4).
Acidic detergent fiber (ADF, obtained after an acidic detergent wash of wheat straw using the Van Soest method16), which mainly contains cellulose and lignin, gave contributions of 39.7% and 2.5% to FA and acetic acid, respectively (Table 3, entry 3). This result also shows that the contributions of hemicellulose to FA and acetic acid are 33.9% (73.6% down to 39.7%) and 4.5% (7.0% down to 2.5%), respectively.
Lignin produces very limited FA and acetic acid under the same conditions, and the contributions to FA and acetic acid are very small (0.7% and 0.2%, respectively, Table 3, entry 4). Thus, it can be concluded that the FA and acetic acid are mainly formed from the structured polysaccharides: cellulose and hemicellulose.
The purchased microcrystalline cellulose and xylan were also used as substrates (Table 3, entries 5 and 6). These two polysaccharides cannot be fully converted, and the contributions to FA and acetic acid are relatively low compared with the corresponding components in wheat straw. The purchased polysaccharides (microcrystalline cellulose and xylan) are quite different in structure than the corresponding components in lignocellulosic materials. Purchased materials have higher crystallinities and are more difficult to convert.
According to our recent work, FA was formed through a catalytic conversion of polysaccharides.14 Where does the considerable amount of acetic acid come from? The contribution of hemicellulose to acetic acid (4.5%) is more than that of cellulose (2.3%). As a polymer of sugars, hemicellulose has a similar structure to cellulose, except for the non-ignorable amount of acetyl groups linked in the side chains.21 In the hydrolysis process of lignocellulosic materials, acetic acid comes from the hydrolysis of the acetyl groups attached to the hemicellulose.22 Thus, the acetic acid formation is most likely due to the breaking of bonds to the acetyl groups. An experiment without O2 or NaVO3 was carried out (Table 3, entry 7). This conversion turns out to be hydrolysis. Acetic acid was formed, but the yield was low (1.8%). When O2 was added, the yield of acetic acid was raised to 7.2% (Table 3, entry 8), which was very close to that of catalytic conversion (7.3%, Table 3, entry 1). O2 pressure accelerates the removal of acetyl groups significantly without the help of the catalyst. In section 3.1.2, oxidation of levulinic acid, which comes from deep hydrolysis of cellulose, can also produce acetic acid. Thus, we draw the conclusion that the acetic acid formed in catalytic conversion of wheat straw is (1) from the bond breaking of acetyl groups, which are distributed in the hemicellulose structure, and (2) from levulinic acid in deep hydrolysis of polysaccharides (cellulose and hemicellulose).
3.3 The solid degradation in wheat straw conversion
Lignocellulose is composed of three major components: cellulose, hemicellulose and lignin. Cellulose consists of linear polysaccharides with β-1,4 linkages of D-glucopyranose monomers. Compared with cellulose, hemicellulose is a more branched sugar polymer of various monosaccharides, among which hydroxyl groups are often substituted with acetyl groups or carboxylic groups. Lignin is an amorphous polymer consisting of methoxylated phenylpropane structures. Lignin and hemicellulose combine with each other to fill the space between cellulosic fibers. Each of them has a unique chemical structure. The behaviors of lignocellulosic components in the catalytic conversion need to be better understood. To investigate the degradation of the three components, the 13C CPMAS NMR spectra of residues after different reaction times were studied (see Fig. 5).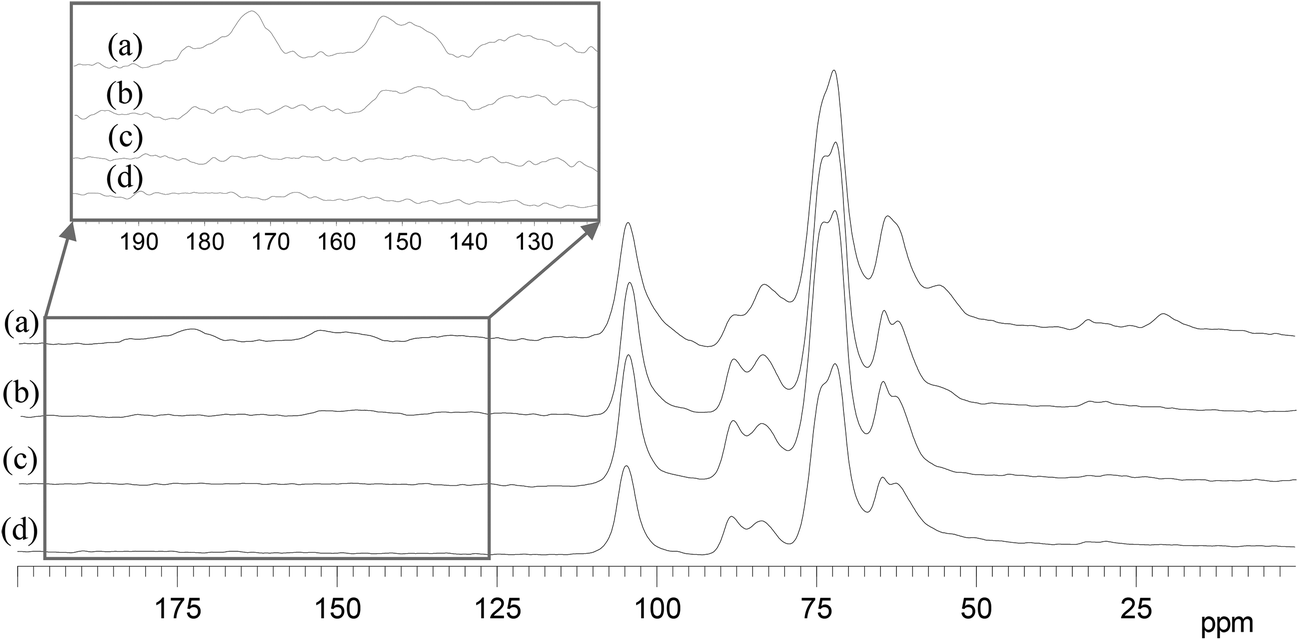 | ||
| Fig. 5 13C CPMAS NMR spectra of (a) wheat straw and residues after reaction of (b) 5 min, (c) 20 min, and (d) 40 min. Conditions: wheat straw, 1 g; H2SO4, w = 2%; NaVO3, w = 0.35%; H2O, 12.0 cm3; O2, 3 MPa; temperature, 160 °C. | ||
In Fig. 5, (a) is for wheat straw, the lignocellulosic material; (b), (c) and (d) are for residues after 5 min, 20 min and 40 min, respectively (in order to facilitate the NMR measurement, 1 g of wheat straw and a longer reaction time were employed). The signals and the corresponding carbons in wheat straw are shown as follows.23–25 The region between 60 ppm and 110 ppm is specific to carbons of cellulose. The signals at 20 ppm and 173 ppm are assigned to the methyl and carbonyl carbons in the acetyl group attached to hemicellulose, respectively. The region between 120 ppm and 160 ppm is specific to aromatic carbons of lignin. The signal at 55 ppm is assigned to the methoxyl carbon in lignin. The signals at 20 ppm and 173 ppm disappear in 5 min (see Fig. 5a and 5b), indicating that the acetyl groups in hemicellulose degrade fast in the transformation. Although the signals of cellulose and hemicellulose are highly overlapped, the splits of the signals at 72 ppm and 63 ppm suggest the disappearance of the corresponding signals, which are assigned to carbons of hemicellulose.24,26 Compared with the degradation rate of hemicellulose, the degradation rate of lignin is slower, as shown by the gradual weakening of the signals of the aromatic carbons (between 120 ppm and 160 ppm) and methoxyl carbon (56 ppm) at longer reaction times (see Fig. 5a, 5b and 5c). The signals assigned to cellulose remain unchanged in the whole process. It suggests that cellulose degradation is the slowest transformation. The relative decrease in signal at 83 ppm (C-4 of amorphous cellulose) compared with that at 88 ppm (C-4 of crystalline cellulose) shows that the amorphous cellulose degradation is faster than the crystalline cellulose. This confirms the known fact that amorphous cellulose has a more disordered structure and is easier to convert than crystalline cellulose.
It is interesting to compare this catalytic conversion with hydrolysis pretreatment, in which lignin is the last component remaining.17,27 Considering the structure of lignocellulose and the conversions of these two reactions (see Table 3, entries 1 and 7), we can conclude that it is the oxidation that makes the wheat straw conversion easier by following the hemicellulose–lignin–cellulose removal order.
3.4 The reuse of the catalytic system
The reusability of NaVO3–H2SO4 aqueous solution in wheat straw conversion was studied, and the result is shown in Fig. 6. After four runs, the yields of FA and acetic acid were maintained without a significant decrease.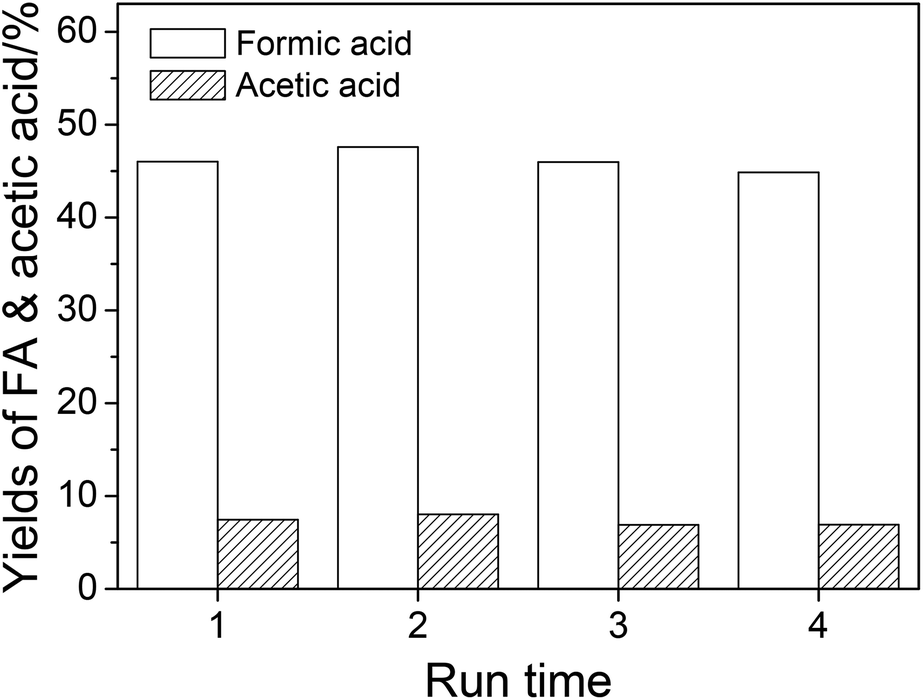 | ||
| Fig. 6 The reuse of the catalytic solution. Conditions: wheat straw, 0.05 g; H2SO4, w = 2%; NaVO3, w = 0.35%; H2O, 6.0 cm3; O2, 3 MPa; temperature, 160 °C; time, 5 min. | ||
Although the conversion is efficient (the yield of FA is 75.2% based on mass), the concentration of FA in aqueous solution after reaction is low (mass fraction of 0.63%). The separation of FA from an aqueous solution with such a low concentration is difficult. From the viewpoint of industrial application, increasing the concentration of FA in aqueous solution is of great importance for reducing the energy consumption of separation. Thus, the amount of substrate needs to be increased. However, like most lignocelluloses, wheat straw has a very fluffy structure.28 As a consequence, the amount of feedstock in one pot is limited. Based on the results of the catalytic system reusability, adding wheat straw repeatedly to the used catalytic system is considered to be the most suitable method to increase FA mass fraction. FA mass fraction after each feed is shown in Fig. 7. After 5 feed times (0.05 g of wheat straw each time), FA mass fraction in aqueous solution is raised from 0.63% to 2.84%.
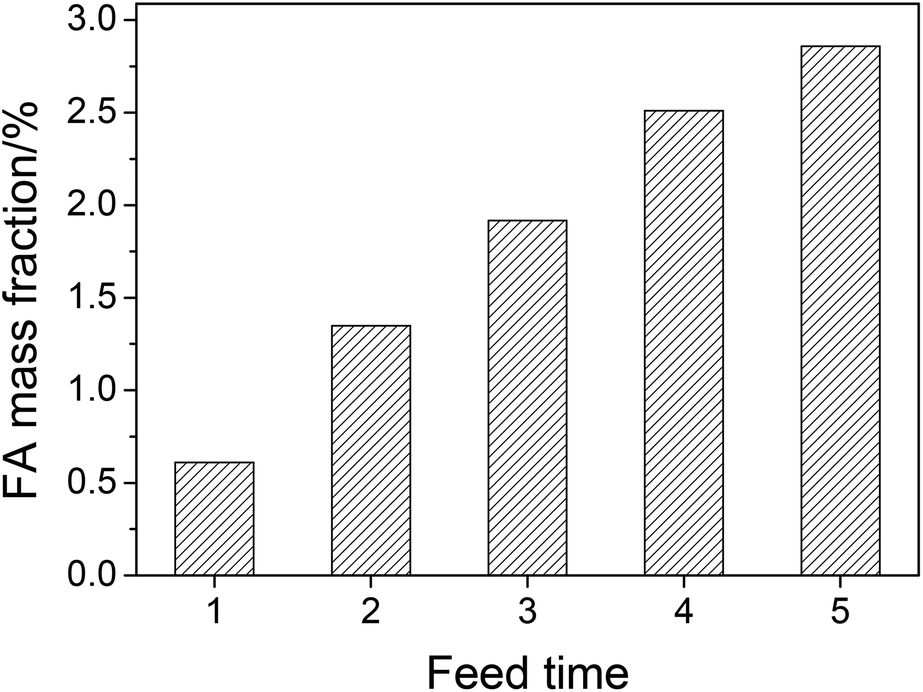 | ||
| Fig. 7 The FA mass fraction after multiple feed experiments. Conditions: wheat straw (each time), 0.05 g; H2SO4, w = 2%; NaVO3, w = 0.35%; H2O, 6.0 cm3; O2, 3 MPa; temperature, 160 °C; time, 5 min. | ||
4. Conclusions
The conversion of wheat straw in NaVO3–H2SO4 aqueous solution with O2 produces a high yield of FA (47%) and acetic acid (7.3%). These products mainly come from polysaccharides (hemicellulose and cellulose). Acetic acid is formed mainly from the acetyl groups that are part of the hemicellulose structure or from the deep hydrolysis product, levulinic acid. The removal of each lignocellulosic component during the conversion follows the order of hemicellulose, lignin and cellulose. Based on the demonstrated reusability of the catalytic system, multiple feedings of wheat straw can achieve high mass fractions of FA, which is beneficial to reduce the FA–water separation costs.Acknowledgements
The authors thank Professors Zhenyu Liu and Qingya Liu for valuable suggestions and discussion. This work was financially supported by the Natural Science Foundation of China (21076138), the National Basic Research Program of China (2011CB201303) and the Program for New Century Excellent Talents in University (NCET-08-0710).References
- A. Boddien, D. Mellmann, F. Gartner, R. Jackstell, H. Jungle, P. J. Dyson, G. Laurenczy, R. Ludwig and M. Beller, Science, 2011, 333, 1733–1736 CrossRef CAS PubMed.
- Y. Himeda, Eur. J. Inorg. Chem., 2007, 3927–3941 CrossRef CAS.
- Y. Himeda, Green Chem., 2009, 11, 2018–2022 RSC.
- R. Tanaka, M. Yamashita and K. Nozaki, J. Am. Chem. Soc., 2009, 131, 14168–14169 CrossRef CAS PubMed.
- Z. Wang, J. Yan, Y. Ping, H. Wang, W. Zheng and Q. Jiang, Angew. Chem., Int. Ed., 2013, 52, 4406–4409 CrossRef CAS PubMed.
- T. Zell, B. Butschke, Y. Ben-David and D. Milstein, Chem. – Eur. J., 2013, 19, 8068–8072 CrossRef CAS PubMed.
- M. Weber, J. T. Wang, S. Wasmus and R. F. Savinell, J. Electrochem. Soc., 1996, 143, 158–160 CrossRef PubMed.
- C. Rice, S. Ha, R. I. Masel, P. Waszczuk, A. Wieckowski and T. Barnard, J. Power Sources, 2002, 111, 83–89 CrossRef CAS.
- N. V. Rees and R. G. Compton, J. Solid State Electrochem., 2011, 15, 2095–2100 CrossRef CAS PubMed.
- R. Wölfel, N. Taccardi, A. Bösmann and P. Wasserscheid, Green Chem., 2011, 13, 2759–2763 RSC.
- J. Li, D. Ding, L. Deng, Q. Guo and Y. Fu, ChemSusChem, 2012, 5, 1313–1318 CrossRef CAS PubMed.
- J. Albert, R. Wölfel, A. Bösmann and P. Wasserscheid, Energy Environ. Sci., 2012, 5, 7956–7962 CAS.
- J. Albert, D. Lüders, A. Bösmann, D. M. Guldi and P. Wasserscheid, Green Chem., 2014, 16, 226–237 RSC.
- W. Wang, M. Niu, Y. Hou, W. Wu, Z. Liu, Q. Liu, S. Ren and K. N. Marsh, Green Chem., 2014, 16, 2614–2618 RSC.
- F. Talebnia, D. Karakashev and I. Angelidaki, Bioresour. Technol., 2010, 101, 4744–4753 CrossRef CAS PubMed.
- H. K. Goering and P. J. V. Soest, Forage fiber analysis (USDA-ARS Agriculture Handbook 379), Government Printing Office, Washington, DC, 1970 Search PubMed.
- Y. Sun and J. Cheng, Bioresour. Technol., 2002, 83, 1–11 CrossRef CAS.
- C. Chang, P. Cen and X. Ma, Bioresour. Technol., 2007, 98, 1448–1453 CrossRef CAS PubMed.
- D. C. Crans, J. J. Smee, E. Gaidamauskas and L. Yang, Chem. Rev., 2004, 104, 849–902 CrossRef CAS PubMed.
- A. Sadoc, S. Messaoudi, E. Furet, R. Gautier, E. L. Fur, L. l. Pollès and J.-Y. Pivan, Inorg. Chem., 2007, 46, 4835–4843 CrossRef CAS PubMed.
- F. M. Gírio, C. Fonseca, F. Carvalheiro, L. C. Duarte, S. Marques and R. Bogel-Łukasik, Bioresour. Technol., 2010, 101, 4775–4800 CrossRef PubMed.
- S. Gámez, J. J. González-Cabriales, J. A. Ramírez, G. Garrote and M. Vázquez, J. Food Eng., 2006, 74, 78–88 CrossRef PubMed.
- H. Wikberg and S. L. Maunu, Carbohydr. Polym., 2004, 58, 461–466 CrossRef CAS PubMed.
- G. Gilardi, L. Abis and A. E. G. Cass, Enzyme Microb. Technol., 1995, 17, 268–275 CrossRef CAS.
- S. L. Maunu, Prog. Nucl. Magn. Reson. Spectrosc., 2002, 40, 151–174 CrossRef CAS.
- A. M. Gil and C. P. Neto, Annu. Rep. NMR Spectrosc., 1999, 37, 75–117 CrossRef CAS.
- M. J. Taherzadeh and K. Karimi, Bioresources, 2007, 2, 472–499 CAS.
- S. Mani, L. G. Tabil and S. Sokhansanj, Biomass Bioenergy, 2004, 27, 339–352 CrossRef PubMed.
Footnote |
| † Electronic supplementary information (ESI) available. See DOI: 10.1039/c4gc01440e |
| This journal is © The Royal Society of Chemistry 2015 |