The mechanism of lowering cholesterol absorption by calcium studied by using an in vitro digestion model†
Liliya
Vinarova
a,
Zahari
Vinarov
a,
Slavka
Tcholakova
*a,
Nikolai D.
Denkov
a,
Simeon
Stoyanov
b and
Alex
Lips
cd
aDepartment of Chemical and Pharmaceutical Engineering, Faculty of Chemistry and Pharmacy, Sofia University, 1164 Sofia, Bulgaria. E-mail: SC@DCE.UNI-SOFIA.BG; Fax: (+359-2) 962 5643; Tel: (+359-2) 962 5310
bUnilever R&D, Vlaardingen, The Netherlands
cUniversity of Edinburgh, School of Physics and Astronomy, James Clerk Maxwell Building, Mayfield Road, Edinburgh, EH9 3JZ, UK
dUnilever Discover, Port Sunlight Laboratory, Quarry Road East, Bebington, CH63 3JW, Wirral, UK
First published on 8th October 2015
Abstract
Studies in humans show that a calcium-enriched diet leads to lower cholesterol in blood serum. This phenomenon is usually explained in the literature with a reduced cholesterol absorption in the small intestine. Our study aims to clarify the effect of calcium on the solubilisation of cholesterol and fatty acid in the dietary mixed micelles (DMM), viz. on the bioaccessibility of these lipophilic substances in the gut. We use an in vitro digestion model which mimics very closely the intestinal pH-profile and the composition of the intestinal fluids. We quantified the effects of Ca2+ concentration on the lipid solubilization for fats and oils with different saturated/unsaturated fatty acid (FA) contents. We found that the increase of calcium significantly decreases the solubilization of cholesterol, FA and MG. Most importantly, we observe a clear positive correlation between the amounts of solubilized cholesterol, on one side, and solubilized free fatty acids and monoglycerides, on the other side. The main conclusion is that Ca2+ ions strongly affect the bioaccessibility of both cholesterol and saturated FA. Therefore, calcium may decrease the serum cholesterol via two complementary mechanisms: (1) fatty acid precipitation by calcium ions reduces the solubilisation capacity of the DMM, thus decreasing the levels of solubilised (bioaccessible) cholesterol; (2) the observed strong decrease of the bioaccessible saturated FA, in its own turn, may suppress the cholesterol synthesis in the liver.
1. Introduction
Cholesterol takes part in the formation of the eukaryotic cell membrane and serves as a precursor for the biosynthesis of steroidal hormones and bile salts in humans.1 However, high plasma concentrations of cholesterol are associated with atherosclerosis, which increases the risk of myocardial infarction and other cardio-vascular diseases.2,3 Thus, significant effort has been devoted to find effective strategies for reduction of plasma cholesterol.There are multiple reports from both animal4–13 and human studies14–24 which demonstrate that the increased intake of calcium decreases the total and LDL-cholesterol in blood plasma. During these studies, it was also observed that dietary calcium may increase the fecal excretion of bile salts (BS),5,7 saturated fatty acids (SFA)22,23 and cholesterol itself.5,7 On this basis, several mechanisms were proposed to explain the cholesterol-lowering effect of calcium, all of which take place in the gastro-intestinal tract:25 (1) inhibition of the re-absorption of bile salts (BS) in the gut; (2) inhibition of the absorption of saturated fatty acids (SFA), and (3) inhibition of the intestinal absorption of cholesterol.
The first mechanism is related to the role of cholesterol as a precursor in BS metabolism – increasing the faecal excretion of BS should be compensated by enhanced BS synthesis from cholesterol in the liver.
The second mechanism is related to the observation that the increased absorption of saturated fats in the gut enhances the cholesterol synthesis in vivo26 – thus one may expect that reducing SFA absorption should be related to decreased cholesterol synthesis in the body.
The third mechanism proposes that calcium decreases cholesterol absorption.27,28 However, in contrast to the direct ionic interactions between positively charged Ca2+ ions and BS or SFA (both containing negatively charged acidic groups), cholesterol does not possess an acidic group and is, therefore, not expected to interact directly with calcium. Wells & Cooper hypothesized that calcium exerts its effect by interacting with the dietary fatty acids and/or phospholipids, because the cholesterol absorption was reduced only in the presence of fat in the intestine.27 Still, there are no data in the literature to verify this interesting hypothesis.
During digestion in the gastro-intestinal tract, cholesterol is solubilized and then transported through the intestinal mucus layer by the dietary mixed micelles (DMM): molecular aggregates of BS, phospholipids (PL) and lipid digestion products (fatty acids and monoglycerides).29–33 High concentrations of calcium in the intestine can precipitate both the BS and the FA,34,35 which would change the solubilizing properties of DMM.
One of the approaches to study the solubilization of hydrophobic molecules (such as cholesterol, FA etc.) in the gastro-intestinal tract is to use in vitro digestion models.36–41 These models mimic the composition of the intestinal fluids during lipid digestion, including enzymes, BS, phospholipids etc. However, the data for the effect of calcium on the solubilization of cholesterol are very scarce.40
Recently, we performed a systematic study of the effect of calcium on the solubilization of cholesterol and lipolysis products.40 We applied a new in vitro digestion model which uses bicarbonate as a buffer for neutral pH (as it is in vivo) and matches closely the intestinal pH-profile. Using this in vitro model we demonstrated that the increase of Ca2+ decreases the concentration of cholesterol and FA in the DMM. We also observed a positive correlation between the concentrations of solubilized cholesterol and solubilized FA, which evidenced for co-solubilization of these two components. No systematic investigation of this subtle relationship between the solubilised lipid components has been completed so far.
In our previous study, we used single oil as an enzyme substrate: sunflower oil which contains mostly unsaturated FA.40 In foods, there are plenty of edible fats which contain a higher fraction of saturated FA (SFA). The SFA have a number of physical properties, which differ from those of the unsaturated ones: melting point above 37 °C (viz. they are solid at body temperature), different molecular configurations and packing, higher hydrophobicity, etc.42 These differences can lead to different interactions of SFA with calcium, BS and cholesterol. It is then important to check whether the previously observed co-solubilization of FA and cholesterol persists when SFA-rich fats are used as lipolysis substrates.
The aims of the current article are the following: (1) to study systematically the effect of Ca2+ on the solubilization of cholesterol and lipolysis products, after in vitro digestion of fats and oils with different saturated/unsaturated fatty acid contents; (2) to clarify the mechanism by which calcium decreases cholesterol solubilization and absorption.
The article is organized as follows: the used materials and methods are described in section 2. Section 3.1 presents the results for the degree of TG lipolysis and the composition of the samples for the different studied fats. In section 3.2 we present data for the effect of Ca2+ concentration on the concentrations of the bile salts, cholesterol and reaction products in the aqueous phase, as obtained after filtration of the reaction mixture with a 200 nm filter (viz. the composition of DMM). The mechanism of lowering of cholesterol solubilization by Ca2+ is discussed in section 4. The main conclusions are summarized in section 5.
2. Materials and methods
2.1. Materials
The following fats and oils were purchased from a grocery store in Bulgaria and were used without purification: lard, cow butter, cocoa butter, palm oil, and sunflower oil. The FA compositions of these fats are very different: the percentage of saturated FA varies from 65% for cocoa butter to 13% only for sunflower oil (determined by gas chromatography, see Table S1 in the ESI†).Pancreatin from porcine pancreas, 4 × USP specification, was obtained from Sigma-Aldrich (Cat N P1750). It contains pancreatic lipase and colipase at a molar ratio of 1![[thin space (1/6-em)]](https://www.rsc.org/images/entities/char_2009.gif) :
:![[thin space (1/6-em)]](https://www.rsc.org/images/entities/char_2009.gif) 1 (ref. 43) and a range of other enzymes, such as amylase, trypsin, ribonuclease and protease. The lot number of the used sample was 029K1095, with a lipase activity of at least 8 USP units. One unit corresponds to the amount of pancreatin that liberates 1 μEq. of fatty acid (FA) per minute, at pH = 9 and T = 37 °C, using an olive oil emulsion as a substrate.
1 (ref. 43) and a range of other enzymes, such as amylase, trypsin, ribonuclease and protease. The lot number of the used sample was 029K1095, with a lipase activity of at least 8 USP units. One unit corresponds to the amount of pancreatin that liberates 1 μEq. of fatty acid (FA) per minute, at pH = 9 and T = 37 °C, using an olive oil emulsion as a substrate.
As a source of bile salts we used porcine bile extract, obtained from Sigma-Aldrich (Cat. no. B-8631), which contains 50 wt% bile acids, 6 wt% phosphatidylcholine and less than 0.06 wt% Ca2+.44 Gas chromatographic analysis showed that it contains also 1.24 ± 0.18 wt% cholesterol and 6.7 wt% FA. According to the producer (personal communication), the composition of the bile salts in this extract is 13 wt% hyodeoxycholic acid, 18 wt% deoxycholic acid, 5 wt% cholic acid, 39 wt% glycodeoxycholic acid, and 24 wt% taurodeoxycholic acid. The percentages of these bile acids and the corresponding molecular masses were used to calculate an average molecular mass of 442 g mol−1 – the latter was used to define the average molar concentration of bile salts in our experiments.
Pepsin from porcine gastric mucosa (Fluka, Cat. no. 77160) with the lot number 1238420 was used in the “stomach” stage of the in vitro model. The pepsin activity was 643 U mg−1. One unit here corresponds to the amount of enzyme, which increases the light absorbance at 280 nm by 0.001 per minute, at pH = 2.0 and 37 °C, using hemoglobin as the substrate.
All aqueous solutions were prepared using deionized water from the water-purification system Elix 3 (Millipore, USA). For preparation of electrolyte solutions we used NaCl (product of Merck), KCl (Merck), CaCl2 (Fluka) and NaHCO3 (Teokom), all of purity higher than 99%.
Cholesterol was purchased from Sigma (>95%, Cat. no. 26740).
2.2. Emulsion preparation
Oil-in-water emulsions were used as a source of TG in the in vitro digestion experiments. We prepared emulsions from five types of fats: sunflower oil (SFO, containing mainly unsaturated fatty acids, UFA), cocoa butter (primarily composed of SFA), palm oil, cow butter and lard. The FA composition of these oils is described in detail in Table S1 in the ESI† section.The emulsions of the fats that are solid at room temperature (all fats except SFO) were prepared in the following way: first, the respective solid fat was melted at T = 50 °C, then 30 mL of it were added to 20 mL emulsifier solution, which was also thermostated at 50 °C. Then, emulsification was performed with a rotor-stator homogenizer Ultra Turrax T25 (Janke & Kunkel GmbH & Co, IKA-Labortechnik), operating at 13![[thin space (1/6-em)]](https://www.rsc.org/images/entities/char_2009.gif) 500 rpm for 5 min at T = 50 °C. The emulsifier solution contained 1 wt% surfactant Tween 80 (product of Sigma), 10 mM NaCl and 0.1 g L−1 NaN3 (as a preservative). The same protocol was followed for the SFO emulsion, however, at room temperature (T = 20–25 °C).
500 rpm for 5 min at T = 50 °C. The emulsifier solution contained 1 wt% surfactant Tween 80 (product of Sigma), 10 mM NaCl and 0.1 g L−1 NaN3 (as a preservative). The same protocol was followed for the SFO emulsion, however, at room temperature (T = 20–25 °C).
The drop size distribution in the emulsion was determined by video-enhanced optical microscopy.45,46 The diameters of the recorded oil drops were measured using custom-made image analysis software. For each sample, the diameters of at least 1000 drops were measured. The accuracy of these optical measurements was found to be ±0.3 μm.45 The mean drop size in the studied emulsions was characterized by the so-called volume-surface diameter, d32, which was calculated from the relationship:
| d32 = ∑Nidi3/∑Nidi2 | (1) |
The obtained stock emulsions were immediately used in lipolysis experiments: the required amount of the stock emulsion was taken by using a pipette and diluted in the electrolyte–enzyme solutions, as explained in section 2.3.
2.3. In vitro digestion model
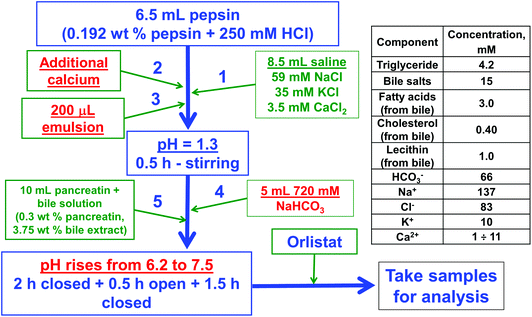
The used in vitro model is described in detail by Vinarov et al.40 Briefly, it consists of two stages, which stimulate the digestion in the stomach and in the small intestine. In the “stomach” stage, the pH is acidic (pH = 1.3) and the protease pepsin is present. The effect of calcium concentration was studied by adding the required volume of 1 M CaCl2 solution using a micropipette, to achieve the desired final calcium concentration. In the following “intestinal” stage, we introduced sodium bicarbonate to increase the pH to around 6.2 and then added the bile extract and pancreatin (containing pancreatic lipase, proteases and other digestive enzymes). The pH in the “intestinal” stage of the experiments increased gradually from 6.2 to 7.5 for 4 h, mimicking the pH-profile observed in vivo (for more details see Vinarov et al.).40The pepsin, bile salts and pancreatin solutions were prepared directly at 37 °C, just before their use in the actual lipolysis experiments. For the experiments performed at higher cholesterol concentrations, the additional cholesterol was introduced into the bile salt solution.
The experimental protocol of solution mixing and the concentrations of the main components in the final reaction mixture are shown in Fig. 1. Note that the reaction mixture contains also phospholipids, cholesterol and fatty acids, which originate from the bile extract (their concentration depends on the particular batch of the bile source).
After a total reaction time of 4.5 h, we added the drug Orlistat (Xenical®, Roche) to inhibit completely the pancreatic lipase. Afterwards, the oil soluble components in the sample were extracted with chloroform or the sample was filtered/centrifuged to obtain a clear aqueous phase for further analysis of the lipids solubilized in the dietary mixed micelles (DMM).
2.4. Model mixtures of bile salts, fatty acids and monoglycerides
To study the effect of fatty acids and monoglycerides on the solubilization of cholesterol in bile salt micelles, we used the in vitro digestion model described in section 2.3 with the following modifications: (1) no emulsion was added, (2) pepsin and pancreatin enzymes were not added, (3) known amounts of monoglycerides and fatty acids were introduced into the bile salt solution, and (4) total cholesterol concentration was 0.85 mM (the required additional cholesterol was introduced into the bile salt solution). All other parameters of the digestion model, such as pH, incubation times, bile salts and electrolyte concentrations, were maintained, as described in section 2.3.2.5. Phase separation methods
To analyse the lipid solubilization at the end of the in vitro digestion experiment, we separated the DMM from the much bigger oil droplets and solid precipitates by filtration or centrifugation.2.6. Extraction of cholesterol, reaction products and non-hydrolyzed TG by using chloroform
After stopping the lipolysis reaction with Orlistat granules, the reaction mixture was allowed to cool down to room temperature and its pH was decreased to pH = 2 by adding HCl (to decrease the solubility of the fatty acids in the aqueous phase). Next, 6 mL chloroform was added and the sample was sonicated for 15 min. After every 5 min of sonication, the sample was vigorously agitated by shaking with hands. The obtained complex dispersion was centrifuged for 30 min at 3620g (4500 rpm) which led to separation of clear aqueous and chloroform phases, indicating that the lipophilic substances were transferred into the non-polar phase. The obtained chloroform phase was further analyzed by GC (see the ESI† for details) and the recovery of the cholesterol, fatty acids (FA), mono- and di-glycerides (MG and DG), and tri-glycerides (TG) was found to be ≥90%.The same procedure was applied for analysis of the aqueous phases, separated by filtration or centrifugation, as described in section 2.5.
2.7. Degree of TG lipolysis
TG transformation to DG and MG occurs via consecutive reactions.47 Hence, we define four quantitative characteristics of TG transformation: overall degree of TG transformation, α; degree of TG transformation to DG, β; degree of transformation to MG, γ; and degree of transformation to glycerol (Gly), δ. The overall degree of TG transformation is defined as: | (2) |
Here CINITG is the initial molar concentration of TG (which is known in advance) and CTG is the molar concentration of the remaining, non-hydrolyzed TG. The molar degree of transformation to DG is defined as:
 | (3) |
Here CDG is the molar concentration of the formed and non-hydrolyzed DG. The molar degree of transformation to MG is defined as:
 | (4) |
The molar degree of transformation to glycerol (Gly) is defined as:
 | (5) |
Eqn (2)–(5) show that, by definition, α = β + γ + δ. In practice, we determined the value of α from the initial and the final TG concentrations, eqn (2), and the values of β and γ were determined from CMG and CDG, using eqn (3) and (4), respectively. The concentrations CTG, CDG and CMG were determined by GC. The value of δ was determined by the relationship δ = (α − γ − β), because glycerol cannot be detected with the used GC procedure.
3. Experimental results
The main experimental results are presented as follows. In section 3.1 we describe the effect of Ca2+ on the degree of TG lipolysis and on the total concentration of the lipolysis products at the end of the digestion experiment. These results are used as a reference when describing the results for the effect of Ca2+ on the solubilisation of lipolysis products and cholesterol in DMM (section 3.2). In section 3.3 we present model experiments, aimed to clarify the effect of saturated and unsaturated MG and FA on the cholesterol solubilization.3.1. Effect of Ca2+ concentration on the degrees of TG lipolysis and on the composition of the reaction mixture after lipolysis
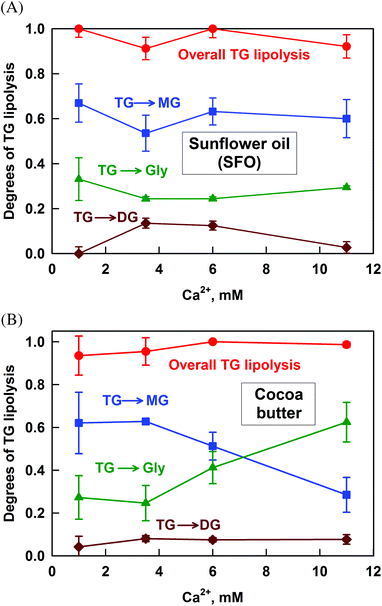
The lipolysis of SFO, which contains 13% saturated FA (SFA) and 87% unsaturated FA (UFA), is presented in Fig. 2A. Almost complete TG hydrolysis occurs at all the studied Ca2+ concentrations (CCa). The main fraction of TG (more than 60%) is transformed to MG. The hydrolysis to glycerol and DG is much lower: ≈28% and 0–12%, respectively.The partial hydrolysis of the TG to glycerol by the sn1,3-specific pancreatic lipase is somewhat surprising, as the end products of the reaction should be sn2-MG and FA. However, sn2-MG is known to isomerise to sn1- or sn3-MG, which can then be hydrolysed to glycerol by the pancreatic lipase.48 In the time frame of our lipolysis experiment (4 h, mimicking in vivo intestinal digestion), up to 30% of the sn2-MG could isomerise, thus explaining the obtained results.
The results for the lipolysis of cocoa butter which contains around 65% SFA, are presented in Fig. 2B. Similarly to SFO, the overall degree of TG hydrolysis is very high and the lipolysis to DG is very low. However, the fraction of TG transformed to MG decreases significantly from 62 to 29% with the increase of CCa, whereas the opposite trend is observed for the degree of lipolysis to glycerol: it increases from 27 to 62%. Thus, more MG is hydrolysed to glycerol with the increase of calcium concentration.
Additional experiments with cow butter, lard and palm oil confirmed that the overall TG lipolysis is very high and the fraction of DG is very low for all fats and all the calcium concentrations studied (see Fig. S2 in the ESI†). For cow butter which has a high level of SFA, the degree of lipolysis to glycerol increases with CCa (at the expense of MG), similarly to the case of cocoa butter. A much smaller effect is observed for lard, which has an intermediate SFA content of 50%, whereas for palm oil (similar SFA content) there is no such effect at all.
The sample after lipolysis, before separation of the aqueous phase, will henceforth be referred to as the “whole sample”. Its main components are the lipolysis products and the substances originating from the used bile extract (additional 3 mM FA, 0.2 mM saturated MG and ≈0.40 mM cholesterol).
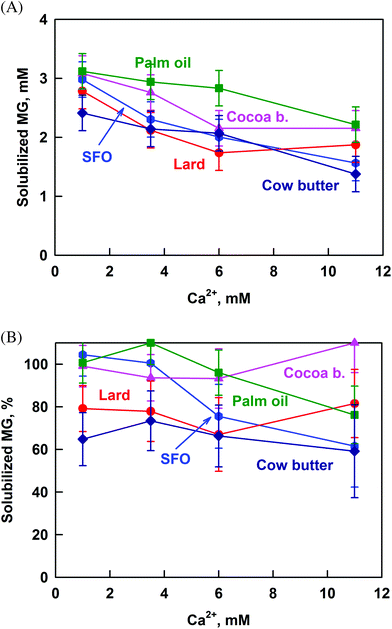
The increase of CCa from 1 to 11 mM decreases the concentration of total MG for cow and cocoa butter by ≈1.4 mM, whereas the effect is smaller for lard (see Fig. S3A in the ESI†). Further analysis of the data shows that for cow butter and lard the saturated MG are specifically decreased, whereas for cocoa butter the main decrease is in the unsaturated MG (Fig. S4 in the ESI†). For SFO and palm oil the concentration of total MG does not depend on CCa, in agreement with the results for the TG lipolysis to MG.
With respect to the concentration of total FA in the whole sample, for SFO and palm oil CFA = 10–12 mM, at all the studied CCa (Fig. S3B in the ESI†). For cow and cocoa butter the total FA increases with the increase of CCa to 14 and 13 mM FA, respectively. The latter is due to the significant increase of MG hydrolysis to glycerol at high CCa. For lard the total FA increase only slightly (in the frame of experimental error), in accordance with the much smaller increase of the hydrolysis to glycerol, compared to cow and cocoa butter.
The results obtained in this section can be summarized as follows:
• With respect to the degree of TG lipolysis: (1) the overall TG lipolysis is almost complete ≥80%, whereas the TG lipolysis to DG is very low <15%; (2) most of the TG is hydrolyzed to MG, from 40 to 80%; (3) for the fats with a high level of SFA (cocoa butter, cow butter and lard) the increase of CCa leads to increased hydrolysis of MG to glycerol, whereas no such effect is observed for SFO and palm oil.
• With respect to the composition of the reaction mixture after lipolysis: (1) the main components are FA and MG; (2) the average CFA is between 10 and 12 mM for all fats and oils, at all CCa, except for cow and cocoa butter for which the total FA increase with the increase of CCa to 14 and 13 mM FA, respectively; (3) the increase of CCa decreases the concentrations of saturated MG for cow butter and lard, and of the unsaturated MG for cocoa butter.
3.2. Effect of Ca2+ on the phase distribution of lipolysis products, cholesterol and bile acids
In this section we present results about the effect of Ca2+ on the solubilization of the lipolysis products, cholesterol and bile acids in the aqueous phase. In most experiments, this aqueous phase was separated by filtration through a 200 nm filter and will be, hereafter, referred to as “the permeate”. In several experiments we used centrifugation for phase separation to check for the possible solubilisation of the various components in molecular aggregates which are bigger than 200 nm. The aqueous phase obtained by centrifugation is referred to as the “serum”. We begin by comparing the compositions of the serum and the permeate in subsection (A), followed by the results about the solubilization of fatty acids, monoglycerides and cholesterol, subsections (B), (C) and (D). Finally, we present the results for the solubility of bile salts in subsection (E).To check whether such aggregates are formed under the conditions used in the present study, we compared the compositions of the permeate and of the serum at 1 and 11 mM Ca2+, after lipolysis of cocoa butter and SFO emulsions. The results showed a moderate difference in the concentrations of total fatty acids for cocoa butter at high calcium concentrations, indicating the presence of large aggregates in the reaction mixture (see Fig. S5A in the ESI†). However, the results obtained with SFO showed that the concentration of cholesterol and FA in the serum is much higher than that in the permeate, at high CCa (Fig. S5B in ESI†). The latter result is in agreement with our previous study, where the experiments were performed with SFO, but at a lower final pH in the “intestinal” stage of the experiment (pH = 6.8, compared to 7.5 in this study).40 Additional experiments are needed to clarify the reasons for the formation of large aggregates predominantly in oils enriched with unsaturated FA.
As the larger aggregates formed at high calcium concentrations are unlikely to penetrate the mucus layer and thus will not contribute to the total absorption of cholesterol, in the following sections we consider mainly the aqueous phase obtained by filtration. The latter contains aggregates <200 nm that are expected to cross the intestinal mucus layer and deliver cholesterol to the enterocytes.
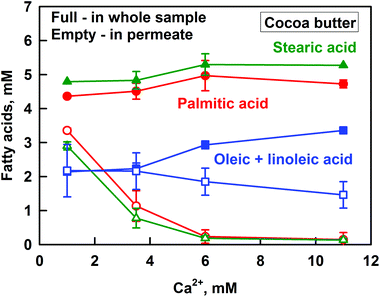
Let us first discuss the FA in the whole sample. The concentrations of the saturated PAc and StAc are not significantly affected by the increase of CCa (CPAc ≈ 4.5 mM, CStAc ≈ 5.1 mM), whereas there is a slight increase in the concentration of unsaturated FA from ≈2 to 3 mM. The latter is due to the increased hydrolysis of unsaturated MG to glycerol at high CCa, which was described in the previous section.
The opposite trend is observed for the solubilization of FA in the DMM (viz. in the permeate) – the concentrations of PAc and StAc decrease significantly with the increase of CCa, from 3.1 mM StAc and 3.5 mM PAc at CCa = 1 mM, down to 0.4 mM for both StAc and PAc at CCa ≥ 6 mM. Thus, despite the high solubilization of PAc and StAc at low CCa, a very small fraction of these saturated FA remains solubilized at high CCa. In contrast, the concentration of unsaturated FA in the permeate decreases only slightly with the increase of CCa (from 2.2 to 1.5 mM, which is in the frame of experimental error), demonstrating that most of the unsaturated FA remain solubilized even at high CCa.
To check whether the decrease of solubilized saturated FA is due to the precipitation of calcium soaps, we measured the concentration of total FA and Ca2+ in the precipitate (Fig. 4). The precipitate was analysed after centrifugation of the samples.
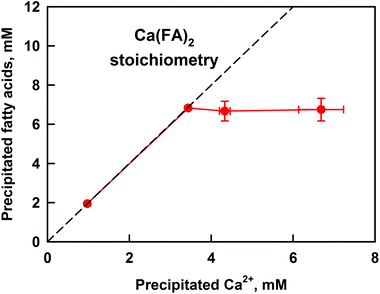 | ||
| Fig. 4 Concentration of precipitated FA as a function of the precipitated Ca2+, as measured after sample centrifugation. The concentration of Ca2+ was determined by AAS, see the ESI† for method description. The dashed line represents a calcium–fatty acid soap stoichiometry of Ca(FA)2. Cocoa butter emulsion was used in the lipolysis model. The presented results are an average of (at least) two separate experiments. For some systems the scattering of the data is small and is represented by the size of the symbols. | ||
A linear relationship between the amounts of precipitated FA and calcium at CCa ≤ 3.5 mM is seen, thus confirming the formation of calcium soaps. The slope of the line shows that the stoichiometry of the formed precipitate is Ca(FA)2, as expected for simple calcium–fatty acid soaps. At CCa ≥ 3.5 mM, the precipitated FA remain constant at ≈7 mM, whereas the concentration of insoluble calcium continues to increase. The precipitation of Ca2+ at CCa ≥ 6 mM can be explained by its involvement in additional equilibria: with bicarbonate anions and bile salts (BS).35,49 Additional experiments in the presence of only electrolytes showed that at CCa ≥ 6 mM there is extensive precipitation of CaCO3, which accounts for the measured increase in precipitated Ca2+.
Further analysis of the phase distribution of FA at different CCa shows that the FA concentration in the large aggregates is constant (around 1.5 mM), whereas in the DMM it decreases significantly with increasing CCa (Fig. S6 in the ESI†).
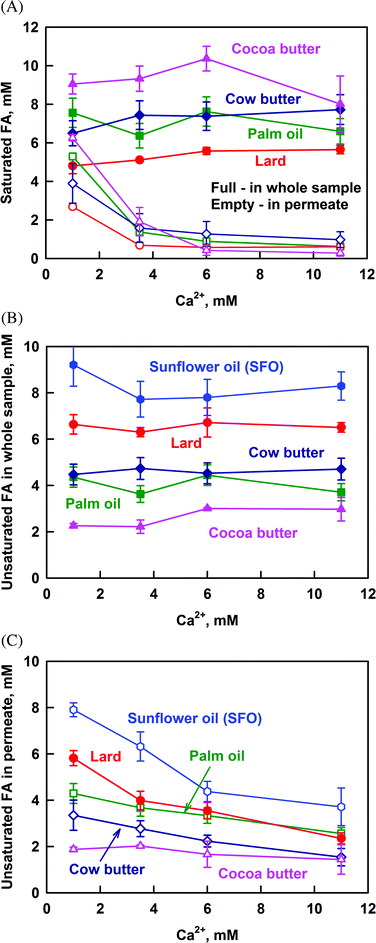
The results presented so far demonstrate that calcium decreases strongly the solubilization of PAc and StAc (saturated FA), whereas the solubilization of oleic + linoleic acid (unsaturated FA) is only slightly affected. For this reason, the results for all the studied fats are presented as the sum of all saturated or all unsaturated FA in Fig. 5. Again, the total concentration of FA, CFA in the whole sample, is given as a reference. Only the concentrations of saturated FA after lipolysis of SFO are omitted in Fig. 5A, because they are in the frame of our experimental accuracy (SFO has a very low saturated FA content).
Regardless of the concentration of saturated FA (CSFA) in the whole sample, the saturated FA which are solubilized in the permeate decrease significantly for all the studied fats (Fig. 5A). At CCa ≥ 6 mM, CSFA reaches a plateau in the range from 0.5 to 1 mM, which can be considered as the limiting solubility of SFA in the permeate at high calcium concentrations. Note that this limit does not depend on the source of saturated FA and on their chain length (C14 to C18). Thus, there is a small fraction of FA solubilized in DMM that is not accessible for precipitation by calcium even at high CCa.
Similar plots for the unsaturated FA in the whole sample and in the permeate are shown in Fig. 5B and C, respectively. The concentration of unsaturated FA in the permeate decreases gradually with the increase of CCa and no plateau region is reached up to 11 mM Ca2+. Simple calculation shows that the increase of CCa from 1 to 11 mM decreases FA solubilization by 47%, which is in good agreement with the results of Patton & Carey.36 On the other hand, the fact that there is no plateau region indicates that the main fraction of unsaturated FA may also precipitate at even higher Ca2+ concentrations, not reached in our study.
All these results demonstrate that the saturated FA are precipitated preferentially, as compared to unsaturated FA. This conclusion is further illustrated by the decrease of the fraction of saturated FA in the permeate, when plotted as a function of CCa (Fig. S7 in the ESI†). Thus, calcium suppresses specifically the solubilization of saturated FA in the reaction mixture.
The main results in this section can be summarized as follows: (1) the concentration of saturated FA in the aggregates with size <200 nm decreases significantly with the increase of Ca2+ and reaches a limiting value of around 0.5–1 mM at CCa ≥ 6 mM for all the studied fats; (2) the concentration of unsaturated FA in these aggregates also decreases with the increase of Ca2+, but does not reach a limiting value up to 11 mM Ca2+; (3) the decrease in FA solubilization is due do the formation of insoluble calcium–FA soaps; (4) the saturated FA are precipitated preferentially by calcium, as compared to unsaturated FA.
To check if this is the case, we calculated the percentage of solubilized MG from the ratio [MG in permeate]/[MG in whole sample]. The percentage of solubilized MG is not affected by the increase of calcium concentration for the saturated fats (Fig. 6B), thus proving that the decrease of CMG is due to increased MG hydrolysis. In contrast, calcium decreases MG solubilization for SFO and palm oil from 100 to 65 and 75%, respectively. The most probable explanation for these fats is that the MG form large aggregates with FA at high calcium concentrations, as was observed for SFO in our previous work.40
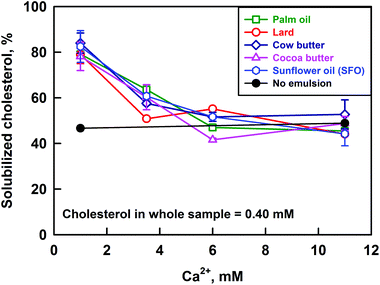
The solubilization of cholesterol decreases significantly with the increase of CCa for all the studied fats: from ≈80% to 47%, see Fig. 7. The cholesterol solubilization capacity of the bile salt solution itself was determined by performing an experiment in the absence of emulsions and enzymes (i.e. no reaction products and oily phase). These experiments showed that the solubilisation capacity of the bile salts is ≈47% and it is not affected by the calcium concentration. Thus, we observe an increased solubilization of cholesterol (80%) at low CCa, in the presence of lipolysis products (FA and MG).
In our previous work, we showed that the increase of CHperm above the solubilization capacity of the bile salt solution is due to the presence of FA which co-solubilize with cholesterol in the bile micelles.40 This conclusion is in agreement with the results of other authors, who demonstrated that cholesterol solubilization in model BS–phospholipid mixtures increases in the presence of FA.50,51
To investigate further the process of cholesterol solubilization, we increased the concentration of cholesterol in the whole sample from 0.40 to 0.85 mM, and performed experiments at CCa = 1 mM and CCa = 11 mM. Emulsions of cocoa butter and sunflower oil were used in the digestion model, as these two fats have very different FA profiles (13 and 65% saturated FA for SFO and cocoa butter, respectively). The excess cholesterol was added in the bile salt solutions, as explained in section 2.3. These experiments showed that the increase of CCa decreases CHperm around two times (results not shown), as in the experiments performed at lower cholesterol concentrations in the whole sample. We can then conclude that calcium affects the partitioning of cholesterol between the DMM and the precipitates formed at high calcium concentrations.
Summarizing, the increase of calcium concentration from 1 to 11 mM leads to a significant decrease of cholesterol solubilisation in the aggregates with size <200 nm, regardless of the fat used in the lipolysis experiments (saturated FA varied between 13 and 65%) or the total cholesterol concentration in the sample (varied between 0.40 and 0.85 mM).
To check this possibility, we determined by HPLC the bile salts in the permeate at CCa = 1 and 11 mM (see the ESI† for method description). The obtained results showed that calcium has no significant effect on the peak area of the main BS (Fig. S8 in the ESI†). Therefore, the studied range of CCa does not cause bile salt precipitation in the time frame of our lipolysis model (4.5 h).
3.3. Effect of monoglycerides and fatty acids on cholesterol solubilisation (model mixtures).
In the current section, we present the results from model experiments, aimed to clarify the effect of FA and MG on the cholesterol solubilisation, under the conditions similar to those in our digestion model. We studied separately the effects of saturated and unsaturated FA and MG, in order to distinguish between the effects of the various species present in the whole reaction mixture in the in vitro lipolysis model.The solubilization of cholesterol was studied by adding known quantities of MG and/or FA in the reaction mixture, in the absence of any emulsion drops and enzymes (section 2.4). All other parameters of the digestion model, such as pH, reaction time, bile salt and electrolyte concentrations, were kept the same, as in the lipolysis experiments. The studied concentration range of MG and FA also corresponds to the one observed in the lipolysis experiments.
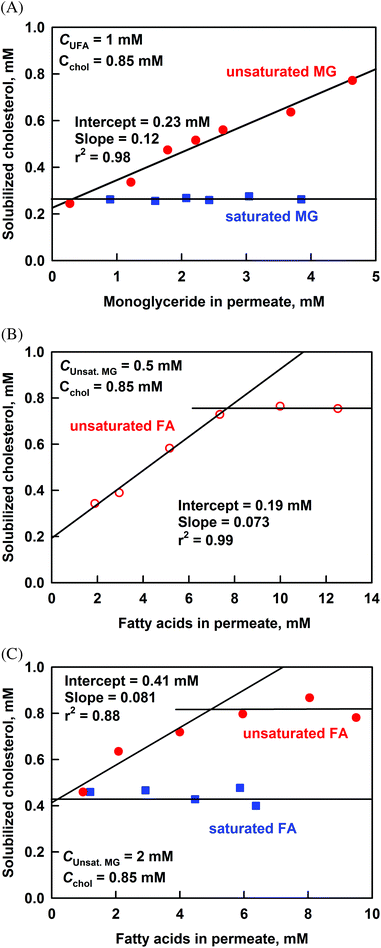
The results for the effect of long chain MG (C16 to C18) on the cholesterol solubilization, at a fixed concentration of unsaturated FA in the permeate of 1 mM, are presented in Fig. 8A. The increase of solubilized unsaturated MG (uMGperm) increases significantly the cholesterol solubilization from 0.25 to 0.77 mM at the highest uMGperm = 4.6 mM. From the obtained slope of 0.12 we can calculate that 1 molecule of cholesterol is co-solubilized with around 8 molecules of unsaturated MG. In contrast, the saturated MG did not show any effect on cholesterol solubilization.
To check the effects of saturated and unsaturated FA, we performed experiments at uMGperm = 0.5 or 2 mM, see Fig. 8B and C. The concentration of uMGperm = 2 mM was chosen because it is the average concentration of unsaturated MG present at the end of most of our lipolysis experiments. For saturated FA, we used a mixture of palmitic (C16) and stearic acids (C18), at a molar ratio of 4![[thin space (1/6-em)]](https://www.rsc.org/images/entities/char_2009.gif) :
:![[thin space (1/6-em)]](https://www.rsc.org/images/entities/char_2009.gif) 5, corresponding to the saturated FA composition after lipolysis of cocoa butter. To study the effect of unsaturated FA, we used oleic acid (C18:1), as it is the predominant unsaturated FA in the studied fats.
5, corresponding to the saturated FA composition after lipolysis of cocoa butter. To study the effect of unsaturated FA, we used oleic acid (C18:1), as it is the predominant unsaturated FA in the studied fats.
At uMGperm = 0.5 mM, the solubilization of cholesterol increases linearly with the increase of unsaturated FA until it reaches a plateau at UFAperm = 7.5 mM, where almost all cholesterol is solubilized (Fig. 8B). The slope in the linear region is 0.073, indicating that around 14 molecules of unsaturated FA co-solubilize with 1 molecule of cholesterol.
The increase of solubilized UFA, at the higher concentration of uMGperm = 2 mM, also leads to higher cholesterol solubilization, Fig. 8C. The dependence reaches a plateau at UFAperm = 6 mM, where again most of the cholesterol is solubilized. The initial slope of the dependence (0.081) is slightly different to that observed at uMGperm = 0.5 mM (0.073). No effect was observed in these experiments of the saturated FA on cholesterol solubilisation.
The above results are in general agreement with those of Simmonds et al., who showed that glycerol monooleate and oleic acid increase cholesterol solubilization in a model mixture of bile salts (taurocholate + taurodeoxycholate).50 However, the slopes of the dependence of solubilized cholesterol vs. unsaturated MG or unsaturated FA between the two studies are rather different, see Fig. S9 in the ESI.† The most probable explanation for the observed discrepancy is that experiments of Simmonds et al. are performed in the presence of only MG or only FA,50 whereas in our case we always have MG while varying FA concentration and vice versa. As demonstrated by our experiments, the slope of the dependence of cholesterol on unsaturated FA is affected by the concentration of MG in the reaction mixture. Similarly, Simmonds et al. show that the solubilization of cholesterol depends on the ratio MG to FA. Another possible explanation is the different composition of the bile salts used in the two studies: Simmonds et al. used a mixture of two bile salts,50 whereas we used a porcine bile extract containing more than 5 glyco- and tauro-conjugated bile acids and phospholipids (similarly to human bile). This difference in the composition of the DMM can explain the observed differences in the quantity of solubilized cholesterol (at similar general trends).
We conclude that: (1) the unsaturated long-chain MG and FA (C16–C18) increase the cholesterol solubilisation, and (2) one molecule of cholesterol is co-solubilized with around 8 molecules of unsaturated MG or with 14 molecules of UFA in the DMM, under the conditions of the model experiments described in the current section.
4. Mechanism of lowering of cholesterol solubilization by calcium. Relation to in vivo studies
(A) Mechanism of calcium effect on cholesterol solubilization
The increase of calcium concentration in the lipolysis mixture leads to a significant reduction of the solubilized cholesterol (section 3.2D). The molecular mechanism behind this effect is not obvious, because cholesterol is a neutral molecule and it is not directly precipitated by calcium.One possible explanation is that calcium precipitates first the bile salts (which govern the solubilization capacity of the aqueous phase) and thus decreases the amounts of solubilized cholesterol, FA and MG. To check this hypothesis, we performed HPLC analysis of the aqueous phase and found that more than 90% of the bile salts remain soluble, even at the highest studied calcium concentration of 11 mM (section 3.2D). Therefore, this explanation is not relevant to the systems studied here.
The second possible mechanism is that calcium reduces the solubilization capacity of the solution by decreasing the concentrations of solubilized FA and MG, which were shown to promote cholesterol solubilisation. This mechanism requires a positive correlation of the solubilized cholesterol with the solubilized MG or/and FA, at the end of the lipolysis reaction in our digestion model.
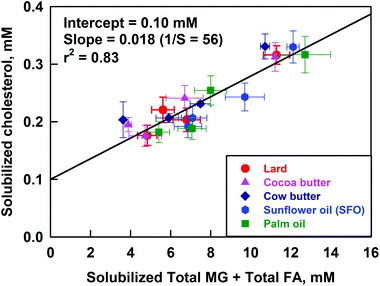
To check this assumption, we prepared plots for the solubilized cholesterol vs. the concentrations of unsaturated and/or saturated FA and/or MG. The best correlation was observed when the solubilized cholesterol was plotted vs. the total solubilized FA + MG (see Fig. 9). A slightly worse correlation was observed when the cholesterol was plotted against the total solubilized FA only (correlation coefficient r2 = 0.79 vs. 0.83, respectively), whereas the plots versus the solubilized either saturated or unsaturated FA or MG (considered separately) showed noticeably worse correlation (see Fig. S10 in the ESI†). Therefore, we conclude that the in vitro model demonstrates a positive correlation of the solubilized cholesterol with the total solubilized FA + MG. The slope of this correlation, illustrated in Fig. 9, shows that 1 molecule of cholesterol is co-solubilized with about 50 molecules of FA + MG. Note that the latter ratio is rather different from the ratio observed in the model mixtures (section 3.3) which indicates that the solubilisation–precipitation equilibrium might depend in a subtle way on the specific conditions of the experiments. Despite this difference in the quantitative measures, the general trend (enhanced cholesterol co-solubilisation, in the presence of FA and MG) is observed in all experiments of this type, not only in ours40 but of other authors as well.50,51
We can then conclude from these experiments that calcium decreases the cholesterol solubilization predominantly by decreasing the concentration of solubilized FA and MG in the DMM.
The latter conclusion is in general agreement with the results from our previous study40 and with those of Devraj et al., who showed that calcium of high concentrations can precipitate the FA, formed during in vitro TG lipolysis, which in turn leads to lower solubilization of hydrophobic drugs in the bile salt + digestion product mixture.41
(B) Relation to in vivo studies
A clinical study by Shahkhalili et al. showed that the increased intake of calcium leads to a decrease in the plasma concentration of total and LDL cholesterol and increases the fecal output of saturated FA.23 The authors explained the reduced bioaccessibility of saturated FA by the formation of insoluble calcium–FA precipitates, without discussing the possible mechanisms of lowering of serum cholesterol.Our study shows unambiguously that the increased calcium concentration in the lipolysis mixture decreases the concentrations of solubilized cholesterol and saturated FA in the DMM. In vivo, this result is shown to lead to decreased saturated FA and cholesterol absorption in the gut compartments.23,27 The decreased cholesterol absorption can directly reduce plasma cholesterol. In addition, the decreased absorption of saturated FA helps indirectly to reduce the plasma cholesterol, because it suppresses the cholesterol synthesis, promoted by absorbed saturated FA.26
5. Conclusions
We studied systematically the effect of calcium on the solubilization in the dietary mixed micelles (DMM) of the lipolysis products and of cholesterol for five edible fats and oils. The main conclusions are the following:1. Almost complete TG lipolysis (α > 80%) is achieved for all fats and oils, at all the calcium concentrations studied, CCa. The main reaction products are fatty acids and monoglycerides, while the concentration of diglycerides is very low.
2. Cholesterol, fatty acid (FA) and monoglyceride (MG) solubilization decreases with the increase of CCa, for all the fats and oils studied.
3. The concentration of solubilized saturated FA decreases to a larger extent (4- to 10-fold decrease) than the concentration of unsaturated FA (2- to 3-fold decrease). These results show that the saturated FA are precipitated preferentially by Ca2+.
4. At CCa ≥ 6 mM, the concentration of solubilised saturated FA reaches a limiting value of 0.5 to 1 mM, regardless of the source of FA or its chain length (C14 to C18).
5. The solubilized cholesterol increases significantly with the solubilized FA and MG. Approximately 50 molecules of FA and MG (of molar ratio varying between 1.5![[thin space (1/6-em)]](https://www.rsc.org/images/entities/char_2009.gif) :
:![[thin space (1/6-em)]](https://www.rsc.org/images/entities/char_2009.gif) 1 and 3
1 and 3![[thin space (1/6-em)]](https://www.rsc.org/images/entities/char_2009.gif) :
:![[thin space (1/6-em)]](https://www.rsc.org/images/entities/char_2009.gif) 1) co-solubilize with 1 cholesterol molecule in the performed in vitro lipolysis experiments.
1) co-solubilize with 1 cholesterol molecule in the performed in vitro lipolysis experiments.
6. A similar trend for co-solubilization of cholesterol with FA and MG was observed with model mixtures of bile salts + FA + MG + cholesterol, however, without quantitative agreement with the in vitro lipolysis experiments. The latter comparison shows that the cholesterol solubilization in such complex mixtures depends on the specific preparation of these mixtures, viz. the final composition of the dietary mixed micelles (DMM) might reflect kinetically trapped metastable states, rather than complete thermodynamic equilibrium, due to the low water solubility of the molecules involved.
7. The most important conclusion of this study is that dietary calcium can reduce the plasma cholesterol levels by two complementary mechanisms: (i) reduced cholesterol bioaccessibility in the gut, and (ii) decreased absorption of saturated FA which, in turn, reduces the cholesterol synthesis in the liver.26
This work also demonstrates that the in vitro lipid digestion assays are useful tools for systematic studies of the factors affecting the triglyceride lipolysis and the solubilization of lipophilic substances. These digestion models can be used for revealing the molecular mechanisms of various effects, as demonstrated here for the mechanisms of cholesterol lowering by calcium. Similar studies are expected to be of particular use for optimization of the oral delivery systems for drugs, which are poorly soluble in water.
Acknowledgements
The authors are grateful to Prof. Irina Karadjova for performing the AAS measurements, and to Miss Victoria Alexandrova and Miss Borislava Damyanova for performing some of the in vitro digestion experiments. The support of this study by Unilever R&D and ESF Project no. BG051PO001-3.3.06-0040, operation no. BG051PO001-3.3.06 – “Support for the development of Ph. D. students, Post-Docs, specialists and young scientists” is gratefully acknowledged.References
- S. M. Grundy, Annu. Rev. Nutr., 1983, 3, 71–96 CrossRef CAS PubMed.
- A. M. Konecka, T. Jezierski and A. Wnuk, J. Anim. Sci., 1996, 5(2), 163–173 Search PubMed.
- M. Shiomi, T. Ito, S. Yamada, S. Kawashima and J. Fan, J. Atheroscler. Thromb., 2004, 11(4), 184–189 CrossRef.
- J. J. Vitale, E. E. Hellerstein, D. M. Hegsted, M. Nakamura and A. Farbman, Am. J. Clin. Nutr., 1959, 7, 13–22 CAS.
- A. I. Fleischman, H. Yacowitz, T. Hayton and M. L. Bierenbaum, J. Nutr., 1967, 91, 151–158 CAS.
- A. I. Fleischman, M. L. Bierenbaum and P. H. Lenz, Lipids, 1972, 7, 263–266 CrossRef CAS.
- H. Yacowitz, A. I. Fleischman, R. T. Amsden and M. L. Bierenbaum, J. Nutr., 1967, 92, 389–392 CAS.
- J. M. Iacono, J. Nutr., 1974, 104, 1165–1171 CAS.
- S. Renaud, M. Ciavatti, C. Thevenon and J. P. Ripoll, Atherosclerosis, 1983, 47(2), 187–198 CrossRef CAS.
- T. G. Hines, N. L. Jacobson, D. C. Beitz and E. T. Littledike, J. Nutr., 1985, 115, 167–178 CAS.
- R. Van der Meer, H. De Vries, C. E. West and H. De Waard, Atherosclerosis, 1985, 56, 139–147 CrossRef CAS.
- H. Jacques, C. Lavigne, T. Desrosiers, I. Giroux and C. Hurley, Can. J. Physiol. Pharmacol., 1995, 73, 465–473 CrossRef CAS.
- B. Z. De Rodas, S. E. Gilliland and C. V. Maxwell, J. Dairy Sci., 1996, 79, 2121–2128 CrossRef CAS.
- H. Yacowitz, A. I. Fleischman and M. L. Bierenbaum, Br. Med. J., 1965, 1, 1352–1354 CrossRef CAS.
- A. K. Bhattacharyya, C. Thera, J. T. Anderson, F. Grande and A. Keys, Am. J. Clin. Nutr., 1969, 22(9), 161–1174 Search PubMed.
- L. A. Carlson, A. G. Olsson, L. Oro and S. Rossner, Atherosclerosis, 1971, 14, 391–400 CrossRef CAS.
- M. L. Bierenbaum, A. I. Fleischman and R. I. Raichelson, Lipids, 1972, 7(3), 202–206 CrossRef CAS.
- M. L. Bierenbaum, E. Wolf, M. Raff, W. P. Maginnis, M. A. Amer, D. Kleyn and G. Bisgeier, Nutr. Rep. Int., 1987, 36, 1147–1157 CAS.
- A. Lehtonen and J. Viikari, Atherosclerosis, 1979, 33, 49–58 CrossRef CAS.
- P. H. Groot, W. F. Grose, R. Dijkhuis-Stoffelsma, J. Fernandes and J. J. Ambagtsheer, Eur. J. Pediatr., 1980, 135, 81–84 CrossRef CAS.
- L. Bell, C. E. Halstenson, C. J. Halstenson, M. Macres and W. F. Keane, Arch. Intern. Med., 1992, 152, 2441–2444 CrossRef CAS PubMed.
- M. A. Denke, M. M. Fox, M. M. And and M. C. Schulte, J. Nutr., 1993, 123(6), 1047–1053 CAS.
- Y. Shahkhalili, C. Murset, I. Meirim, E. Duruz, S. Guinchard, C. Cavadini and K. Acheson, Am. J. Clin. Nutr., 2001, 73, 246–252 CAS.
- I. R. Reid, B. Mason, A. Horne, R. Ames, J. Clearwater, U. Bava, B. Orr-Walker, F. Wu, M. C. Evans and G. D. Gamble, Am. J. Med., 2002, 112, 343–347 CrossRef CAS.
- T. Vaskonen, J. Nutr. Biochem., 2003, 14(9), 492–506 CrossRef CAS.
- J. F. C. Glatz and M. B. Katan, Eur. J. Clin. Invest., 1993, 23(10), 648–655 CrossRef CAS PubMed.
- W. W. Wells and S. B. Cooper, Arch. Biochem. Biophys., 1958, 75(1), 273–279 CrossRef CAS.
- J. Ferezou, J. C. Sulpice, T. Coste and F. Chevallier, Digestion, 1982, 25(3), 164–172 CAS.
- A. F. Hofmann, Biochem. J., 1963, 89, 57–68 CrossRef CAS.
- D. M. Small, M. Bourg and D. G. Dervichian, Nature, 1966, 211, 816–818 CrossRef CAS PubMed.
- M. C. Carey and D. M. Small, Am. J. Med., 1970, 49, 590–608 CrossRef CAS.
- J. Ø. Christensen, K. Schultz, B. Mollgaard, H. G. Kristensen and A. Mullertz, Eur. J. Pharm. Sci., 2004, 23(3), 287–296 CrossRef CAS PubMed.
- C. J. H. Porter, N. L. Trevaskis and W. N. Charman, Nat. Rev. Drug Discovery, 2007, 6, 231–248 CrossRef CAS PubMed.
- W. D. Pohle, Oil Soap, 1941, 18(12), 244–245 CAS.
- J. Gu, A. Hofmann, H. Ton-Nu, C. Schteingart and K. Mysels, J. Lipid Res., 1992, 33, 635–646 CAS.
- J. S. Patton and M. C. Carey, Science, 1979, 204, 145–148 CAS.
- D. A. Garrett, M. L. Failla and R. J. Sarama, J. Agric. Food Chem., 1999, 47(10), 4301–4309 CrossRef CAS PubMed.
- G. J. McDougall, P. Dobson, P. Smith, A. Blake and D. Stewart, J. Agric. Food Chem., 2005, 53(15), 5896–5904 CrossRef CAS PubMed.
- D. G. Fatouros and A. Mullertz, Expert Opin. Drug Metab. Toxicol., 2008, 4(1), 65–76 CrossRef CAS PubMed.
- Z. Vinarov, L. Petrova, S. Tcholakova, N. D. Denkov, S. D. Stoyanov and A. Lips, Food Funct., 2012, 3(11), 1206–1220 CAS.
- R. Devraj, H. D. Williams, D. B. Warren, A. Mullertz, C. J. H. Porter and C. W. Pouton, Int. J. Pharm., 2013, 441(1–2), 323–333 CrossRef CAS PubMed.
- D. Small, in Handbook of Lipid Research, ed. D. Hanahan, Plenum Press, New York, 1986, pp. 285–343 Search PubMed.
- J. S. Patton, P. A. Albertsson, C. Erlanson and B. Borgström, J. Biol. Chem., 1978, 253, 4195–4202 CAS.
- N. H. Zangenberg, A. Mullertz, H. G. Kristensen and L. Hovgaard, Eur. J. Pharm. Sci., 2001, 14(2), 115–122 CrossRef CAS.
- O. Saether, in Encyclopedic Handbook of Emulsion Technology, ed. J. Sjöblom, Dekker, New York, 2001 Search PubMed.
- P. S. Denkova, S. Tcholakova, N. D. Denkov, K. D. Danov, B. Campbell, C. Shawl and D. Kim, Langmuir, 2004, 20, 11402–11413 CrossRef CAS PubMed.
- R. Verger, in Lipases, ed. B. Borgstrom and H. L. Brockman, Elsevier, Amsterdam, 1984, pp. 84–150 Search PubMed.
- G. Lyubachevskaya and E. Boyle-Roden, Lipids, 2000, 35(12), 1353–1358 CrossRef CAS.
- C. Jones, A. Hofmann, K. Mysels and A. Roda, J. Colloid Interface Sci., 1986, 114, 452–470 CrossRef CAS.
- W. J. Simmonds, F. Hofmann and E. Theodor, J. Clin. Invest., 1967, 46, 874–890 CrossRef CAS PubMed.
- J. C. Montet, M. O. Reynier, A. M. Montet and A. Gerolami, Biochim. Biophys. Acta, 1979, 575(2), 289–294 CrossRef CAS.
- A. Hofmann and K. Mysels, Colloids Surf., 1988, 30, 145–173 CrossRef CAS.
- A. Hofmann and K. Mysels, J. Lipid Res., 1992, 33, 617–626 CAS.
Footnote |
| † Electronic supplementary information (ESI) available. See DOI: 10.1039/c5fo00856e |
| This journal is © The Royal Society of Chemistry 2016 |

