The differential localization of a methyl group confers a different anti-breast cancer activity to two triterpenes present in olives
Cristina
Sánchez-Quesada
 ab,
Alicia
López-Biedma
 ab and
José J.
Gaforio
*ab
aImmunology Division, Department of Health Sciences, Faculty of Experimental Sciences, University of Jaén, Campus las Lagunillas s/n, 23071 Jaén, Spain. E-mail: jgaforio@ujaen.es; csquesad@ujaen.es; albiedma@ujaen.es; Fax: +34953212943; Tel: +34953212002
bAgrifood Campus of International Excellence, ceiA3, 23071 Jaén, Spain
First published on 3rd November 2014
Abstract
Uvaol (UV) and erythrodiol (ER) are two triterpenic dialcohols present in the minor fraction of virgin olive oil, in leaves and in the drupe of olives. These triterpenes possess the same chemical structure and differ only in the location of a methyl group. It has been reported that they have antitumoral effects in leukemic cells, in skin mice tumours and, finally, in astrocytoma cells, but there are no evidences about their effects in highly invasive human breast cancer cells and human epithelial breast cells. For this purpose, we have evaluated their cytotoxic activities as well as their effects on cell proliferation, cell cycle profile, apoptotic induction, oxidative stress and DNA oxidative damage in both highly invasive human breast cancer cells (MDA-MB-231) and human epithelial breast cells (MCF10A). UV and ER showed different effects in normal and breast cancer cells, whereas both compounds possess the same structure, except for the location of a methyl group. UV protects from damage to DNA in both cell lines, whereas ER enhances damage to DNA in these cell lines. Thus, ER promotes apoptosis and arrests cell cycle in human epithelial breast cells. Hence, both compounds differ in their action in human breast cells apparently by the different location of only a methyl group.
Introduction
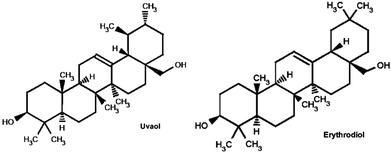
Uvaol (UV) and erythrodiol (ER) are two compounds present in the leaves, fruit of olive tree and in virgin olive oil.1 These two compounds (with the same molecular formula and weight, i.e. C30H50O2 and 442.7168, respectively) possess two hydroxyl groups in remote positions and differ in the location of the methyl group, which is located at carbon 19 for uvaol and at carbon 20 for erythrodiol (Fig. 1). UV and ER are described to possess multiple activities against different kinds of cancer cells.2–5 However, to date, there is no reference about the role that these two dialcohols play in metastatic breast cancer cells or in human non-tumorigenic breast cells.On the other hand, the health benefits of virgin olive oils and the multiple qualities that it possesses in the prevention of several diseases,6–12 such as breast cancer, are widely known. It is known that, in carcinogenesis, ROS levels are altered; in fact, ROS production is increased in many cancer cells (in vitro and in vivo), which results in a persistent pro-oxidative situation and the creation of more H2O2 than normal cells. By controlling the ROS levels inside a cancer cell, we could activate apoptosis pathway in the cell, or even prevent carcinogenesis in normal breast cells. For this reason, some antioxidants possess anticancer activity and are beneficial in cancer chemoprevention due to, for example, the regulation of Akt-ROS (protein kinase B-ROS) pathways,13 which are implicated in intracellular ROS production. UV and ER possess antioxidant activity against lipid peroxidation in rats;14 therefore, they could be a good option for controlling ROS levels inside the cells.
Taking into account that the control of ROS could play a role in the prevention of breast cancer, it is interesting to know if UV and ER, which are two triterpenes with antioxidant activity, have the capacity to prevent breast cancer development or even have antitumor properties. For this reason, the purpose of this study was to examine the effects of UV and ER in human epithelial breast cells (MCF10A cells) and in highly metastatic breast cancer cells (MDA-MB-231 cells).
Results
Cytotoxicity
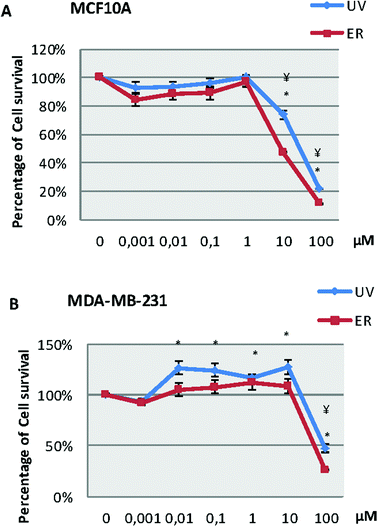
In the MCF10A cell line (Fig. 2A), our results showed a decrease of survival at 10 and 100 μM for both compounds. However, in the MDA-MB-231 cell line (Fig. 2B), we observed a decrease of survival only at 100 μM for both compounds; in fact, both compounds were capable of increasing the number of cells at lower concentrations than 100 μM.Proliferation
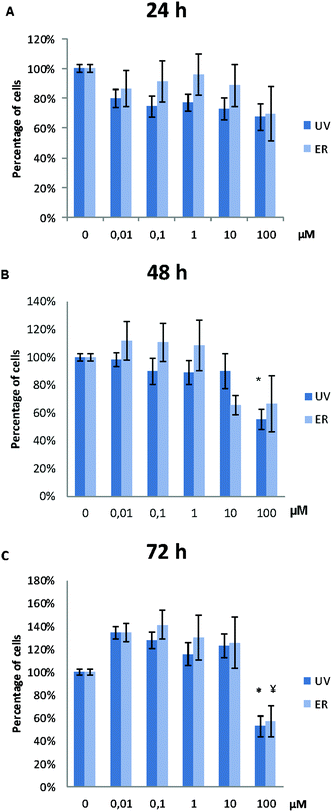
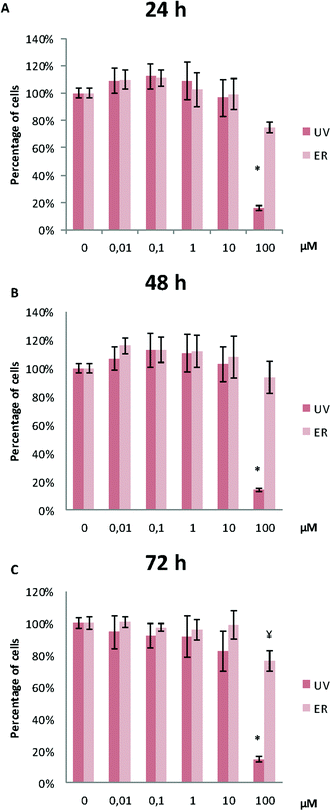
UV did not alter MCF10A proliferation, except for the concentration of 100 μM. At this concentration, proliferation after 48 h and 72 h of treatment was affected, and a statistically significant decrease of cell proliferation was observed (Fig. 3). ER was antiproliferative only at 100 μM and after 72 h of treatment (Fig. 3).In MDA-MB-231, proliferation was affected only for UV at 100 μM at the three assayed time-points. ER was antiproliferative only at 100 μM after 72 h of treatment (Fig. 4).
Cell cycle
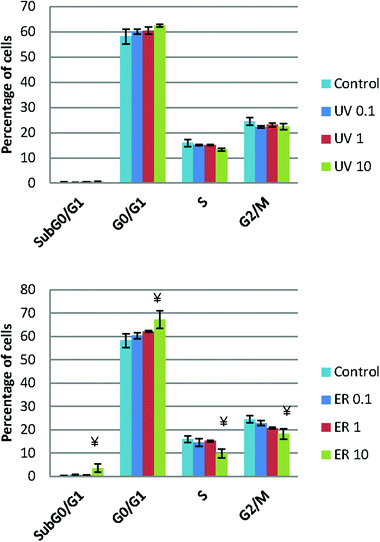
UV did not show any statistical difference neither in MCF10A (Fig. 5) nor in MDA-MB-231 (data not shown). However, ER at 10 μM arrested cell cycle in Sub G0/G1 and in G0/G1 phases in MCF10A, whereas in MDA-MB-231, no difference was observed respect to the control (data not shown).Apoptosis analysis
Neither UV nor ER promoted apoptosis in MDA-MB-231; moreover, ER at 10 μM promoted statistically significant apoptosis in MCF10A (Table 1).| MCF10A | MDA-MB-231 | |||||
|---|---|---|---|---|---|---|
| Live | Apoptotic | Death | Live | Apoptotic | Death | |
| Camptothecin | 62.66 ± 15.35* | 26.45 ± 12.55* | 10.87 ± 10.07* | 57.70 ± 5.66* | 16.69 ± 4.57* | 25.60 ± 7.15* |
| Control | 92.43 ± 1.42 | 5.92 ± 1.40 | 1.63 ± 0.53 | 87.64 ± 3.16 | 8.92 ± 2.15 | 1.33 ± 0.48 |
| UV 0.1 μM | 89.64 ± 2.40 | 7.31 ± 2.04 | 3.04 ± 1.97 | 85.53 ± 6.13 | 11.94 ± 4.06 | 2.51 ± 2.07 |
| UV 1 μM | 89.50 ± 3.99 | 9.05 ± 4.49 | 1.44 ± 0.56 | 85.53 ± 6.59 | 11.56 ± 4.28 | 2.88 ± 2.31 |
| UV 10 μM | 82.40 ± 6.20 | 14.44 ± 7.67 | 3.14 ± 1.53 | 85.46 ± 3.90 | 11.83 ± 1.92 | 2.68 ± 2.01 |
| ER 0.1 μM | 88.97 ± 4.73 | 9.68 ± 5.30 | 1.34 ± 0.57 | 84.61 ± 6.62 | 13.08 ± 4.97 | 2.29 ± 1.67 |
| ER 1 μM | 88.94 ± 3.86 | 8.86 ± 4.62 | 2.17 ± 0.78 | 84.40 ± 4.61 | 13.08 ± 2.83 | 2.50 ± 1.78 |
| ER 10 μM | 65.85 ± 15.21 | 27.63 ± 18.31* | 6.51 ± 4.02 | 89.68 ± 1.07 | 7.73 ± 2.95 | 2.57 ± 1.92 |
Analysis of intracellular reactive oxygen species
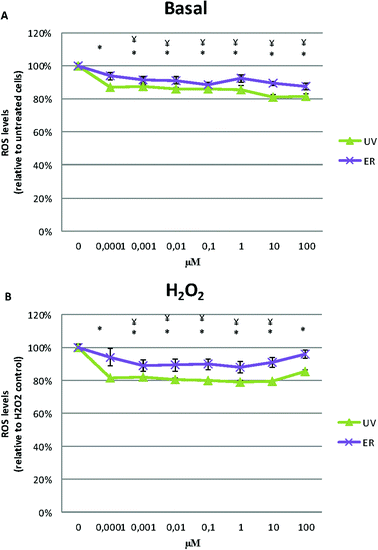
UV and ER in MCF10A cells promoted an antioxidant effect, they decreased ROS levels respect to the untreated control (Fig. 6A).After inducing intracellular oxidative stress by the addition of H2O2, cells treated with UV and ER decreased ROS levels respect to control at all concentration assayed (Fig. 6B).
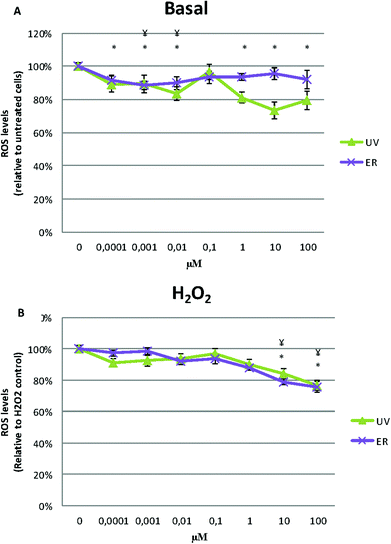
In MDA-MB-231, ROS levels decreased in the cells treated with UV and ER. In fact, with UV at 10 μM, we observed the maximum decrease of ROS levels (73%) with respect to the control (100%, Fig. 7A).
When H2O2 was added, ROS levels decreased at 10 and 100 μM of UV and ER treatments but not at lower concentrations (Fig. 7B).
In Fig. 6A and 7A, data are expressed as percentage of relative fluorescence with respect to the untreated cells that are represented as 100%. In Fig. 6B and 7B, data are expressed as percentage of relative fluorescence with respect to positive control (cells only treated with H2O2) that are represented as 100% and negative control that are expressed as 1.5% ± 0.2% for MCF10A and 5% ± 1.4% for MDA-MB-231 (data not shown).
Catalase activity
Statistically significant differences in catalase activity after treatments with UV and ER (data not shown) were not observed.Analysis of comet assay
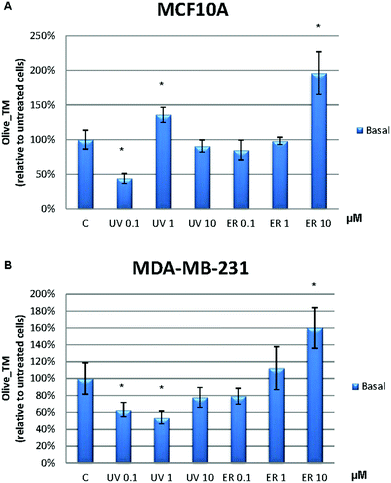
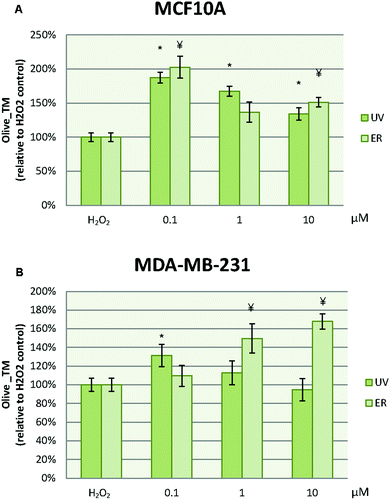
In MCF10A cells, UV at 0.1 μM reduced the damage to DNA in more than 50% with respect to the control. However, this effect was lost at 1 μM, at which the damage to DNA was increased. ER at 10 μM dramatically promoted DNA damage in MCF10A cells with a percentage about 200% (Fig. 8A). In order to evaluate the UV and ER ability to protect against oxidative DNA damage, cells were exposed to H2O2. When oxidative damage was induced in cells, UV and ER increased the damage to DNA with respect to the control in MCF10A (Fig. 9A).In MDA-MB-231 cells, UV at 0.1 and 1 μM decreased damage to DNA respect to the control. Otherwise, ER at 10 μM promoted damage to DNA (Fig. 8B). When cells were exposed to H2O2, UV at 0.1 μM and ER at 1 and 10 μM promoted damage to DNA in breast cancer cells (Fig. 9B).
In Fig. 8, data are expressed as percentage of Olive_TM with respect to the control untreated (represented as 100%). In Fig. 9, data are expressed as percentage of Olive_TM with respect to the control treated with H2O2, which is represented as 100%, and negative control, which is expressed as 14.5% ± 1.8% for MCF10A and 25% ± 3.7% for MDA-MB-231 (data not shown).
Discussion
UV and ER are present in leaves, olives and virgin olive oil from Olea europaea.16 Both compounds have identical chemical structure, except for the difference in the location of the methyl group. These compounds have been described to show different effects related to the control of reactive oxygen species (ROS).2,5,6,17 Our results showed that the ROS levels were diminished with respect to the control in both human breast cell lines (MCF10A and MDA-MB-231) after treatment with UV and ER. Hence, both compounds are antioxidant in these cells, such as in MCF7.2 However, when an oxidative stress was induced by H2O2, the concentrations ranging between 0.0001 and 1 μM did not exert an antioxidant effect in MDA-MB-231, whereas in MCF10A, they still exerted an antioxidant effect. Thus, it seems that both compounds interfere with the ROS levels inside the cells.It is known that ROS are implicated in the redox regulation of the cell function. The role of oxygenated radicals has been highly clarified in the regulation of gene expression, cell oxidative injuries and cytotoxic activity of immune system. In cancer, the balance of ROS within the cancer cell could derivate in promoting apoptosis and necrosis of the malignant cells or could act as a trigger for carcinogenesis by permanent damage of DNA, causing mutations in p53, which is the tumour suppressor gene that is frequently mutated up to 50%.15
When an increase of ROS is persistent (for example, in carcinogenesis), it can affect the DNA, proteins or lipids.18 The results obtained in this work show that when the normal epithelial cell line is in the basal state, UV at 0.1 μM protects them from oxidative damage. In MDA-MB-231, this compound had the same effect, and it prevented oxidative damage, but interestingly, ER had the contrary effect in both cell lines tested (MCF10A and MDA-MB-231).
ROS can interact with DNA and promote damage of DNA in cells, which can take many forms (specifically oxidized purine and pyrimidine bases, strand breaks, sister chromatid exchanges, formation of micronuclei and others). For assessing the effects of ROS on DNA in both cell lines after treatment with UV and ER, the comet assay was prepared. In the cell lines tested, UV acted as an antioxidant protecting the cells against DNA damage (according to the results obtained in oxidative stress measurement), whereas ER promoted damage to DNA. However, when cells were exposed to oxidative damage (H2O2 was added), UV and ER at lower concentrations enhanced the damage to DNA in both breast cell lines, and changed their behaviour when we altered the intracellular ROS levels. Both compounds at high concentrations promoted cell death; however, our results only showed apoptosis in MCF10A with ER at 10 μM. This compound at 10 μM was able to increase DNA damage in basal and in stress conditions, which is induced by H2O2. ER could promote stress, and stress could activate c-Jun N-terminal kinase (JNK) pathway, which is known to be involved in apoptosis regulation in several cellular types.5 In the present study, cells after 4 h of treatment with ER at 10 μM promoted DNA damage. This damage could derivate in apoptosis, in fact, apoptosis after ER treatment has been described by Martín et al.5 in an astrocytoma cell line, 1321N1. This accumulation of ROS is also described in bladder cancer cells (NTUB1), in which ER was capable only with 5 and 10 μM to increase ROS production and arrest the cell cycle in G0/G1 with the corresponding apoptotic cell death at 24 h.17 Therefore, it appears that ER could enhance DNA damage due to reactions with intracellular ROS levels. Thus, ER promoted apoptosis in the normal epithelial cell line while UV did not, and it should be pointed out that the only difference between these two compounds is the CH3 group position.
The different roles that UV and ER had in breast cells appear to be related with two factors: the “origin” of cells and the position of CH3 group. The different effect (after enhace ROS levels by H2O2) in intracellular oxidative stress is described above; hence, this effect was different if it was a cancer cell or not. Moreover, at the same concentration, UV protected against DNA damage in MCF10A and MDA-MB-231, while ER promoted the opposite effect, enhancing DNA damage in both cell lines. Thus, both compounds act in oxidative stress inside the cell but with differences due to their chemical structure.
Experimentals
Chemicals
Uvaol (UV) CAS [545-46-0] (purity ≥98.5%) and erythrodiol (ER) CAS [545-48-2] (purity ≥97%) was purchased from Extrasynthese (Genay, FRANCE). The following chemicals were purchased from Sigma-Aldrich Co. (St Louis, MO, USA): Hepes solution; Sodium Pyruvate solution; Non-Essential Amino Acids mixture 100× (NEAA); 2,7-dichlorofluorescin diacetate (DCFH-DA) CAS [4091-99-0] (purity ≥97%); dimethyl sulfoxide (DMSO); 2,3-bis(2-methoxy-4-nitro-5-sulfophenyl)-2H-tetrazolium-5-carboxanilide inner salt (XTT sodium salt) (purity ≥90%); N-methylphenazonium methyl sulfate (PMS) (purity ≥98%); phosphate buffered saline (PBS); (S)-(+)-camptothecin (CPT) CAS [7689-03-4] (purity ≥90%) and Triton X-100. Foetal Bovine Serum (FBS) was obtained from PAA Laboratories GmbH (Pasching, AUSTRIA). TrypLE Express, HuMEC ready medium, Minimum essential medium with Eagle's salts (MEM) and Phenol-Red-free Roswell Park Memorial Institute 1640 medium (RPMI) were obtained from Gibco® Life Technologies Ltd (Paisley, UK). Methanol dry (max 0.005%) and ethanol absolute PRS was purchased from Panreac Quimica S.L.U. (Barcelona, SPAIN). CellTiter-Blue® Cell Viability Assay was obtained from Promega Corporation (Madison, WI, USA). Phosphate buffered saline (1×, Dulbecco's, PBS) was purchased from Applichem GmbH (Gatersleben, GERMANY). Culture plates were obtained from Starlab (Hamburg, GERMANY). The PI/RNase Staining Buffer kit was obtained from BD Biosciences Pharmigen (San Diego, CA, USA). Annexin-V FITC kit was purchased by Miltenyi Biotec (Cologne, GERMANY). The Comet Assay kit was obtained from Trevigen, Inc. (Helgerman CT, Gaithersburg, MD, USA). The Catalase Assay kit was purchased from Merck KGAA (Darmstadt, GERMANY).Cell culture and treatments
Highly invasive MDA-MB-231 human breast cancer cells (oestrogen and progesterone receptor-negative) and immortalized non-tumorigenic MCF10A human breast epithelial cells (oestrogen receptor-negative) were obtained from American Type Culture Collection (ATCC, Manassas, VA, USA). Breast cancer cells (MDA-MB-231) were grown as monolayer cultures in MEM supplemented with 10% FBS, 1% Hepes Buffer, 1% Sodium Pyruvate and 1% NEAA. Human mammary epithelial cells (MCF10A) were grown in HuMEC Ready Medium. All cell lines were maintained at 37 °C in a humidified atmosphere with 5% CO2. Cells were routinely subcultured using TrypLE Express solution, and those in the exponential growth phase were used for all experiments.Except for the assays that specified the opposite, cells were treated for 4 h with 0.1 μM, 1 μM and 10 μM of uvaol (UV) and erythrodiol (ER) dissolved in absolute ethanol.
Cytotoxicity assay
Cell survival, which his measured as the cellular growth of treated cells versus untreated controls, was carried out in MCF10A and MDA-MB-231 using an XTT-based assay according to Scudiero et al.19 with some modifications. Briefly, cells were seeded into 96-well culture plates in a total volume of 100 μL per well (5 × 10³ cells per well for MDA-MB-231 and 2.5 × 10³ cells per well for MCF10A). After overnight incubation to allow cell attachment, 100 μL of fresh medium was added, containing increasing concentrations from 0.001 μM to 100 μM of UV and ER for 24 h. Thereafter, cells were incubated with XTT in Phenol-Red free RPMI medium for 3 h at 37 °C with 5% CO2, and absorbance was measured at 450 nm wavelength (620 nm as reference) in a plate reader (TECAN GENios Plus). Moreover, viability was calculated using the formula:| % viable cells = [(Atreated cells)/(Acontrol)] × 100 |
Cell proliferation assay
Cell proliferation, which is measured as the cellular growth of treated cells versus untreated controls, was carried out using CellTiter-Blue Cell Viability Assay. Briefly, cells were seeded into 96-well culture plates at 1 × 10³ cells per well for MDA-MB-231 and 0.5 × 10³ cells per well for MCF10A. After overnight incubation to allow cell attachment, the medium was removed and replaced with fresh medium containing UV and ER from 0.01 μM to 100 μM. Plates were incubated for 24, 48 or 72 h, followed by a 72 h, 48 h and 24 h proliferation period (incubation with fresh medium without UV or ER), respectively. At these time points, plates were incubated with CellTiter-Blue Cell Viability for 3 h at 37 °C with 5% CO2, and the relative fluorescence units were measured in a plate reader (TECAN GENios Plus) (Ex. λ485/Em. λ595, Gain 60). Moreover, viability was calculated using the formula:| % viable cells = [(Atreated cells)/(Acontrol)] × 100 |
Cell cycle assay
Cells were seeded in 12-well culture plates (1 × 10⁵ cells per well for MDA-MB-231 and 0.5 × 10⁵ cells per well for MCF10A) and incubated overnight to allow attachment of cells. Then, cells were treated with 0.1 μM, 1 μM and 10 μM of UV and ER for 24 h; moreover, cells were harvested with TrypLE Express and washed with 1× PBS (Ca2+/Mg2+ free) (300 × g 10 min at 4 °C). Next, cells were fixed with cold 70% ethanol and stored at −20 °C for at least 24 h. Subsequent to propidium iodide labelling (PI/RNase Staining Buffer), cells were analysed by flow cytometry (EPICS XL-MCL, Beckman Coulter, Spain). The FlowJo program (v5.7.2) was used to calculate the percentage of cells in G0/G1, S and G2/M phases, and each experiment was repeated at least three independent times.Apoptosis assay
The percentage of apoptotic cells was determined using a double staining assay with FITC-conjugated Annexin V and propidium iodide (PI). Briefly, cells were seeded in 12-well culture plates (1 × 10⁵ cells per well for MDA-MB-231 and 0.5 × 10⁵ cells per well for MCF10A) and incubated overnight to allow cell attachment. After exposure of the cells to UV and ER for 24 h at 0.1 μM, 1 μM and 10 μM, cells were harvested with TrypLE Express, washed twice in cold 1× PBS (Ca2+/Mg2+ free) (300 × g 10 min at 4 °C) and resuspended in 100 μL of Annexin Binding Buffer. Cells were stained with 5 μL Annexin V-FITC and 2 μL PI solution, gently vortexed and incubated for 15 min at room temperature in the dark before flow cytometric analysis. As a positive control, cells were treated with 1 μM camptothecin (CPT), and each experiment was repeated at least three times independently.Detection of intracellular reactive oxygen species
Intracellular reactive oxygen species (ROS) levels were measured after 4 h of treatment with UV and ER at a range from 0.0001 μM to 100 μM, using the cell-permeable fluorescent probe, 2,7-dichlorofluorescin diacetate (DCFH-DA), as previously described by Warleta et al.7 with some modifications. Briefly, cells were seeded on a 96-well plate (5 × 10³ cells per well for MDA-MB-231 and 2.5 × 10³ cells per well for MCF10A) and after incubation with treatments, DCFH-DA (100 μM) was added for 30 min at 37 °C with 5% CO2. Cells were then read in a plate reader for 30 min (Ex. λ485/Em. λ535, Gain 60), and the intracellular ROS level percentage was calculated as follows:| F = [(Ft=30 − Ft=0)/Ft=0 × 100] |
All tests were run in triplicate for each experimental condition, and each experiment was repeated at least three times. All experiments were conducted using iron-free mediums (MEM and HuMEC).
Determination of catalase (CAT) activity
Cells were seeded into a 6-well plate at 0.5 × 10⁶ cells per mL for MCF10A and MDA-MB-231, and they were incubated overnight for cells attachment. Next, the medium was replaced by fresh medium with UV and ER. The assay was prepared according to the manufacturer's protocol for the determination of the enzymatic activity of catalase.Alkaline single-cell gel electrophoresis (comet assay)
Cells were seeded into a 12-well plate (1 × 10⁵ cells per well for MDA-MB-231 and 0.5 × 10⁵ cells per well for MCF10A) and incubated overnight for cells attachment. Then, the cells were treated with UV and ER. Next, cells were scraped and washed twice (300 × g 10 min, 4 °C) with cold 1× PBS (Ca2+/Mg2+ free). They were resuspended in 1 mL of cold 1× PBS. In order to evaluate the UV and ER ability to protect against oxidative DNA damage, cells were exposed for 10 min to 50 μM H2O2 at 4 °C. Then, the comet assay was performed according to Warleta et al.7Slide scoring and analysis
DNA strand breaks were examined using a fluorescence microscope (Zeiss Axiovert 200) equipped with Luca EMCCD camera (Andor Technology, Belfast, UK) under 494 nm excitation and 521 nm emission wavelength using the Komet 5.5 software package (Kinetic Imaging Ltd, Liverpool, UK). Twenty five cell images were randomly characterized per sample using 20× magnifications. Relative fluorescence between head and tail through the olive tail moment (Olive_TM) was used to determine the DNA damage. Olive_TM is defined as the product of the Tail Moment Length and the fraction of DNA in the tail.| Olive\_TM = [(tail (mean) − head (mean)) × tail (% DNA)]/100 |
Statistical analysis
Results are displayed as the mean of at least three independent experiments (±SEM), and are expressed as a percentage relative to the untreated control, which was set as 100%. Statistical analysis was performed using one-way analysis of variance (ANOVA), followed by Fisher's LSD test. The values of p < 0.05 were considered significant. STATGRAPHICS Plus 5.1 statistical software (Statpoint Technologies, Inc., Warrenton, Virginia, USA) was used for the statistical analysis.Conclusion
We could assume that both compounds differ in their actions in both types of cells tested (human epithelial breast cells and highly invasive breast cancer cells), which may be due to the difference in the methyl group location of their structure. UV could prevent damage to DNA in normal breast epithelial cells, while ER could increase oxidative damage in breast cancer cells. Nevertheless, more studies are required to assure these effects in both normal epithelial breast cells and breast cancer cells.Conflict of interest
The authors declare that they have no competing or financial interests.Acknowledgements
This study was financially supported by the “Junta de Andalucía” (Proyecto de Excelencia PI10-AGR-6724) and also supported by the grants from University of Jaén (Plan de Apoyo a la Investigación-Acción 16).Notes and references
- Y. Allouche, A. Jimenez, M. Uceda, M. P. Aguilera, J. J. Gaforio and G. Beltran, J. Agric. Food Chem., 2009, 57, 3604–3610 CrossRef CAS PubMed.
- Y. Allouche, F. Warleta, M. Campos, C. Sanchez-Quesada, M. Uceda, G. Beltran and J. J. Gaforio, J. Agric. Food Chem., 2011, 59, 121–130 CrossRef CAS PubMed.
- D. Es-Saady, A. Najid, A. Simon, Y. Denizot, A. J. Chulia and C. Delage, Mediators Inflammation, 1994, 3, 181–184 CrossRef CAS PubMed.
- M. E. Juan, U. Wenzel, H. Daniel and J. M. Planas, Mol. Nutr. Food Res., 2008, 52, 595–599 CAS.
- R. Martín, E. Ibeas, J. Carvalho-Tavares, M. Hernandez, V. Ruiz-Gutierrez and M. L. Nieto, PLoS One, 2009, 4, e5975, DOI:10.1371/journal.pone.0005975.
- Y. Allouche, G. Beltran, J. J. Gaforio, M. Uceda and M. D. Mesa, Food Chem. Toxicol., 2010, 48, 2885–2890 CrossRef CAS PubMed.
- F. Warleta, M. Campos, Y. Allouche, C. Sanchez-Quesada, J. Ruiz-Mora, G. Beltran and J. J. Gaforio, Food Chem. Toxicol., 2010, 48, 1092–1100 CrossRef CAS PubMed.
- F. Warleta, C. S. Quesada, M. Campos, Y. Allouche, G. Beltran and J. J. Gaforio, Nutrients, 2011, 3, 839–857 CrossRef CAS PubMed.
- S. J. Tsai and M. C. Yin, J. Food Sci., 2008, 73, H174–H178 CrossRef CAS PubMed.
- J. M. Lou-Bonafonte, C. Arnal, M. A. Navarro and J. Osada, Mol. Nutr. Food Res., 2012, 56, 1043–1057 CAS.
- M. De Lorgeril, S. Renaud, N. Mamelle, P. Salen, J. Martin, I. Monjaud, J. Guidollet, P. Touboul and J. Delaye, Lancet, 1994, 343, 1454–1459 CrossRef CAS.
- R. Estruch, E. Ros, J. Salas-Salvado, M. I. Covas, D. Corella, F. Aros, E. Gomez-Gracia, V. Ruiz-Gutierrez, M. Fiol, J. Lapetra, R. M. Lamuela-Raventos, L. Serra-Majem, X. Pinto, J. Basora, M. A. Munoz, J. V. Sorli, J. A. Martinez, M. A. Martinez-Gonzalez and the PREDIMED Study Investigators, N. Engl. J. Med., 2013, 368, 1279–1290 CrossRef CAS PubMed.
- C. Liu, K. Gong, X. Mao and W. Li, Int. J. Cancer, 2011, 129, 1519–1531 CrossRef CAS PubMed.
- J. S. Perona, C. Arcemis, V. Ruiz-Gutierrez and A. Catala, J. Agric. Food Chem., 2005, 53, 730–735 CrossRef CAS PubMed.
- S. Saeidnia and M. Abdollahi, Toxicol. Appl. Pharmacol., 2013, 271, 49–63 CrossRef CAS PubMed.
- C. Sanchez-Quesada, A. Lopez-Biedma, F. Warleta, M. Campos, G. Beltran and J. J. Gaforio, J. Agric. Food Chem., 2013, 61, 12173–12182 CrossRef CAS PubMed.
- H. L. Chen, K. W. Lin, A. M. Huang, H. Y. Tu, B. L. Wei, T. C. Hour, M. H. Yen, Y. S. Pu and C. N. Lin, J. Agric. Food Chem., 2010, 58, 3808–3812 CrossRef CAS PubMed.
- W. Lopaczynski and S. H. Zeisel, Nutr. Res., 2001, 21, 295–307 CrossRef CAS.
- D. A. Scudiero, R. H. Shoemaker, K. D. Paull, A. Monks, S. Tierney, T. H. Nofziger, M. J. Currens, D. Seniff and M. R. Boyd, Cancer Res., 1988, 48, 4827–4833 CAS.
- D. H. Lee, B. S. Lim, Y. K. Lee and H. C. Yang, Cell Biol. Toxicol., 2006, 22, 39–46 CrossRef CAS PubMed.
| This journal is © The Royal Society of Chemistry 2015 |

