Rejection of trace organic chemicals by a nanofiltration membrane: the role of molecular properties and effects of caustic cleaning
Takahiro
Fujioka
 *a,
Stuart J.
Khan
b,
James A.
McDonald
b and
Long D.
Nghiem
c
aGraduate School of Engineering, Nagasaki University, Nagasaki 852-8521, Japan. E-mail: tfujioka@nagasaki-u.ac.jp
bUNSW Water Research Centre, School of Civil and Environmental Engineering, The University of New South Wales, NSW 2052, Australia
cStrategic Water Infrastructure Laboratory, School of Civil Mining and Environmental Engineering, The University of Wollongong, NSW 2522, Australia
First published on 30th July 2015
Abstract
This study aims to provide further insights to the rejection mechanisms of trace organic chemicals (TrOCs) by nanofiltration (NF). The separation mechanisms of TrOCs by an NF membrane were elucidated by assessing the role of molecular properties and the impact of caustic cleaning on their rejection. All charged TrOCs were rejected by the NF270 membrane by more than 80%. However, the rejection of positively charged TrOCs was lower than that of negatively charged TrOCs with similar molecular sizes and was similar to the rejection of neutral TrOCs. The results suggest that size exclusion, rather than electrostatic repulsion, was a major factor attributing to the rejection of these positively charged TrOCs. The results also showed that the minimum projection area was a better surrogate parameter for molecular dimensions than molecular weight. Our study highlights the need to monitor the rejection of neutral and positively charged TrOCs (particularly those that are normally moderately rejected by the membrane) following caustic cleaning.
Water impactThe impact of this work to water research is demonstrated by the additional insights to the rejection mechanisms of trace organic chemicals (TrOCs) by nanofiltration (NF) membranes. Results reported here revealed several subtle factors that could influence the rejection of TrOCs by NF membranes, in addition to the three well-known rejection mechanisms. It was shown that the minimum projection area was a better surrogate parameter for molecular dimensions than molecular weight. In addition, the possible impact of caustic cleaning on the rejection of neutral and positively charged TrOCs (particularly those that are normally moderately rejected by the membrane) was highlighted. |
1. Introduction
Population growth, climate change and contamination of natural freshwater sources present major threats to clean water availability in many parts of the world. As a consequence, water scarcity is expected to continue to increase in densely populated regions around the world.1 In particular, the pollution of freshwater bodies with anthropogenic and low molecular weight trace organic chemicals (TrOCs) has been a worldwide issue over the past few decades.2–5 These TrOCs are biologically active and can present a potential hazard to human health and the environment. TrOCs can be classified into pharmaceutical and personal care products, endocrine disruptors, pesticides, and industrial chemicals such as plastic additives. A concerning increase of the numbers and concentrations of TrOCs in drinking water has been noted by the World Health Organization.6There are two major factors contributing to the public awareness of TrOCs in the environment. Firstly, the increasing number and concentration of TrOCs have been released into the aquatic environment, in particular since World War II, due to the large quantities of produced and consumed pharmaceuticals in modern societies.1,3 Secondly, there has been tremendous technological progress in the field of analytical chemistry, which has allowed the quantification of TrOCs at trace levels.7 TrOCs can be detected in a water sample at concentrations as low as 1 nanogram per litre (ng L−1) or less. The majority of TrOCs are released into the environment by effluent discharged from private households, hospitals, and industrial and farming activities.8,9 These TrOCs are often poorly removed from wastewaters by conventional wastewater treatment facilities.8,9 Significant progress in process engineering and materials science have facilitated effective removal of TrOCs by membrane filtration processes such as nanofiltration (NF) and reverse osmosis (RO). Indeed, NF/RO membranes have become an integral part of many water reuse facilities. Water reuse is commonly considered to be more cost effective and environmentally friendly than seawater desalination or long-distance water transfers for regions experiencing regular droughts and water scarcity.1
The increasing use of NF/RO for drinking water purification and potable water reuse has spurred many dedicated studies to assess the rejection mechanism of TrOCs by these membrane processes. As an example, Mery-sur-Oise is the world's largest NF plant (capacity of 140![[thin space (1/6-em)]](https://www.rsc.org/images/entities/char_2009.gif) 000 m3 per day) specifically designed and built for the removal of pesticides from the Paris river for drinking water production.10 NF process also shows an excellent performance on softening and removing natural organic matter for drinking water applications.10 On the other hand, RO has been extensively used for potable water reuse applications.
000 m3 per day) specifically designed and built for the removal of pesticides from the Paris river for drinking water production.10 NF process also shows an excellent performance on softening and removing natural organic matter for drinking water applications.10 On the other hand, RO has been extensively used for potable water reuse applications.
Although the distinction between NF and RO membranes is not clear, it is widely accepted that the removal mechanisms of TrOCs by these membranes are similar. In addition, because TrOC rejection by NF membranes is lower compared to RO membranes, variations in TrOC rejection due to changes in the operating condition can be better observed with NF membranes. Bellona et al.,11 provided an early, and arguably one of the most comprehensive, reviews on the rejection of TrOCs by NF/RO membranes. However, the review by Bellona et al.,11 and most subsequent studies only cover a small number of TrOCs and often heavily rely on investigations with concentrations well above typical for these compounds due to difficulties associated with their analysis. To date, key mechanisms governing the separation of TrOCs by NF membranes, namely size exclusion, electrostatic interaction, and adsorption (e.g., due to hydrophobic interaction or hydrogen bonding), have been discussed.12–14
The lack of comprehensive data obtained from consistent conditions has hindered the identification of more subtle factors that can also influence the rejection of TrOCs by NF membranes. As a notable example, the effects of membrane fouling and chemical cleaning on TrOC rejection have only been recently investigated. It has been observed that membrane fouling can compromising the rejection of TrOCs by altering the surface hydrophobicity, charge, pore size and by hindering back diffusion of the solute.15–17 Membrane fouling has to be managed by periodic caustic and acidic chemical cleaning, which in turn can compromise the membrane properties temporary or permanently. It has been reported that caustic cleaning may exert considerable impact on the rejection of some TrOCs by NF membranes.18 Simon et al.,18 suggested that caustic cleaning causes the swelling of the membrane polymer matrix due to the increased electrostatic repulsion among the deprotonated carboxylic functional groups in the polymer matrix, which was identified by zeta potential analysis. The swelling effect caused by caustic cleaning ultimately results in an enlargement of membrane pore structure and an increase in solute and solution permeation. However, in comparison to membrane fouling, studies focusing on the impact of chemical cleaning on TrOC rejection remain very limited.19 Since fouling and subsequent cleaning (particularly caustic cleaning) to restore the water flux are inevitable in most if not all membrane filtration processes, it is essential to understand the impact of chemical cleaning on TrOC rejection. Thus, the aim of this study was to provide further insights to the rejection mechanisms of TrOCs by an NF membrane, allowing for an estimation of TrOC removal by chemically cleaned NF membranes. By examining the role of molecular properties and the impact of caustic cleaning on their rejection, the separation mechanisms of TrOCs by an NF membrane were assessed.
2. Materials and methods
2.1 NF membranes and laboratory-scale NF filtration system
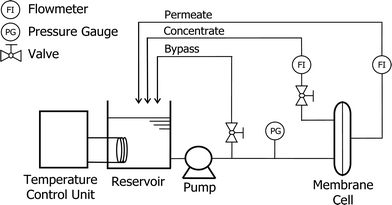
Flat sheet NF270 membrane samples were obtained from Dow Chemical (Midland, Michigan, USA). The NF270 is a polyamide-based thin-film composite NF membrane which can be used for potable water purification and water reuse applications. A laboratory-scale NF filtration system was used in this study (Fig. 1). The system is comprised of four main components: a stainless steel cross-flow membrane cell with a channel height of 2 mm, a stainless steel reservoir, a temperature control unit (Neslab RTE 7, Thermo Scientific Inc., USA), and a high pressure pump (Hydra-Cell, Wanner Engineering Inc., Minneapolis, MN, USA). The stainless steel membrane cell can hold one flat sheet membrane sample with an effective membrane surface area of 40 cm2 (4 cm × 10 cm). The temperature control unit regulates the feed solution temperature through a stainless steel heat exchanging coil. The filtration system is also equipped with pressure gauges and a digital flow meter (FlowCal, GJC Instruments Ltd., UK) for pressure and permeate flow rate measurement.2.2 Chemicals
A suite of 34 TrOCs was selected for investigation. These organic chemicals were from Sigma-Aldrich (St Louis, MO, USA) and were of analytical grade. They represent major groups of TrOCs that are frequently detected in municipal wastewater, reclaimed water, and to a lesser extent surface water.9 These chemicals also cover a wide range of physicochemical properties such as molecular size, charge, and hydrophobicity (Table 1), which allow a comprehensive evaluation on solute transport through membranes. TrOCs ionised less than 50% at pH 8 were classified as “neutral” chemicals, while chemicals with more than 50% ionisation at pH 8 were classified as “charged” chemicals (Table 1). Neutral TrOCs were further categorised into two groups: hydrophilic (log![[thin space (1/6-em)]](https://www.rsc.org/images/entities/char_2009.gif) D < 2) and hydrophobic (log
D < 2) and hydrophobic (log![[thin space (1/6-em)]](https://www.rsc.org/images/entities/char_2009.gif) D ≥ 2).11,20 In this study, log
D ≥ 2).11,20 In this study, log![[thin space (1/6-em)]](https://www.rsc.org/images/entities/char_2009.gif) D represents the logarithm of the apparent (or effective) water–octanol distribution coefficients (D) at pH 8. Charged TrOCs were also classified into negative and positive charge categories. Minimum projection area (MPA) (Table 2) is defined as the smallest two-dimensional projection area of a three-dimensional molecule, which is based on the van der Waals radius. By projecting the molecule on an arbitrary plane, two-dimensional projection area can be calculated and the process is repeated until the minimum of the projection area is obtained (Fig. 2).
D represents the logarithm of the apparent (or effective) water–octanol distribution coefficients (D) at pH 8. Charged TrOCs were also classified into negative and positive charge categories. Minimum projection area (MPA) (Table 2) is defined as the smallest two-dimensional projection area of a three-dimensional molecule, which is based on the van der Waals radius. By projecting the molecule on an arbitrary plane, two-dimensional projection area can be calculated and the process is repeated until the minimum of the projection area is obtained (Fig. 2).
| Compound | Molecular weight [Da] | Log![[thin space (1/6-em)]](https://www.rsc.org/images/entities/char_2009.gif) D at pH 8a D at pH 8a |
pKa (pKb)a | Ionisation at pH 8a [%] | MPAa [Å2] | MDLb [ng L−1] | ||
|---|---|---|---|---|---|---|---|---|
| a Chemaxon (http://www.chemicalize.org/). b MDL: method detection limit. | ||||||||
| Neutral | Hydrophilic (HL) | Paracetamol | 151.2 | 0.91 | 9.5 | 3 | 21.8 | 5 |
| Caffeine | 194.2 | −0.55 | (0.9) | 0 | 30.0 | 10 | ||
| Simazine | 201.7 | 1.78 | (3.2) | 0 | 35.8 | 5 | ||
| Atrazine | 215.7 | 1.32 | (3.2) | 0 | 39.0 | 5 | ||
| Primidone | 218.3 | 1.12 | 11.5 | 0 | 42.7 | 5 | ||
| Meprobamate | 218.3 | 0.93 | 15.2 | 0 | 45.8 | 5 | ||
| Triamterene | 253.3 | 1.11 | (1.9) | 0 | 35.2 | 5 | ||
| Trimethoprim | 290.3 | 1.28 | (7.2) | 12 | 51.1 | 5 | ||
| Hydrophobic (HP) | N,N-Diethyl-meta-toluamide (DEET) | 191.3 | 2.50 | (0.1) | 0 | 40.1 | 5 | |
| Bisphenol A | 228.3 | 4.04 | 9.8; 10.4 | 2 | 44.0 | 20 | ||
| Diuron | 233.1 | 2.53 | 13.2 | 0 | 28.6 | 10 | ||
| Carbamazepine | 236.3 | 2.77 | 16.0 | 0 | 38.8 | 5 | ||
| Linuron | 249.1 | 2.68 | 12.0 | 0 | 30.8 | 5 | ||
| Dilantin | 252.3 | 2.18 | 9.5 | 3 | 47.3 | 5 | ||
| Diazepam | 284.7 | 3.08 | (2.9) | 0 | 47.8 | 5 | ||
| Tris(2-chloroethyl)phosphate (TCEP) | 285.5 | 1.96 | n.a. | 0 | 49.9 | 10 | ||
| Diazinon | 304.4 | 4.25 | (4.2) | 0 | 50.7 | 5 | ||
| Triclocarban | 315.6 | 4.93 | 11.4 | 0 | 50.1 | 10 | ||
| Clozapine | 326.3 | 3.40 | (3.9; 7.8) | 36 | 55.5 | 5 | ||
| Omeprazole | 345.4 | 2.43 | (4.8); 9.3 | 2 | 43.5 | 5 | ||
| Hydroxyzine | 374.9 | 3.24 | (2.1; 7.8) | 40 | 64.7 | 5 | ||
| Charged | (−) | Ibuprofen | 206.3 | 0.97 | 4.9 | 100 | 35.4 | 5 |
| Naproxen | 230.3 | −0.16 | 4.2 | 100 | 34.8 | 5 | ||
| Gemfibrozil | 250.3 | 1.33 | 4.4 | 100 | 43.4 | 5 | ||
| Sulfamethoxazole | 253.3 | 0.39 | 6.2 | 99 | 45.2 | 5 | ||
| Ketoprofen | 254.3 | 0.48 | 3.9 | 100 | 41.7 | 5 | ||
| Triclosan | 289.5 | 4.57 | 7.7 | 68 | 38.5 | 5 | ||
| Diclofenac | 296.1 | 1.16 | 4.0 | 100 | 43.3 | 5 | ||
| Enalapril | 376.5 | −0.91 | 3.7; (5.2) | 100 | 60.0 | 5 | ||
| Simvastatin hydroxy acid | 436.6 | 0.63 | 4.2 | 100 | 65.1 | 5 | ||
| (+) | Atenolol | 266.3 | −1.18 | (9.7) | 98 | 36.9 | 5 | |
| Amitriptyline | 277.4 | 3.02 | (9.8) | 98 | 58.2 | 5 | ||
| Fluoxetine | 309.3 | 2.46 | (9.8) | 98 | 44.3 | 5 | ||
| Verapamil | 454.6 | 3.44 | (9.7) | 98 | 81.2 | 5 | ||
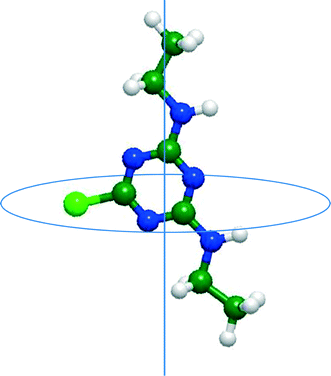 | ||
| Fig. 2 Conceptual figure of minimum projection area of simazine. The line perpendicular to the circular disk represents the centre axis of the minimum projection area. | ||
A stock solution containing 10 mg L−1 of each of the selected TrOCs was prepared in methanol. Deuterated analogues of each TrOC were obtained from CDN isotopes (Pointe-Claire, Quebec, Canada) and used as surrogate standards to account for matrix effects and incomplete recoveries during sample preparation and analysis of TrOCs. A surrogate stock solution containing contained 50 μg L−1 of each deuterated TrOC was also prepared in methanol. Both stock solutions were kept in the dark at −18 °C. Analytical grade NaCl, CaCl2 and NaHCO3 were purchased from Ajax Finechem (Australia) and were used to prepare the synthetic feed solutions.
2.3 Filtration protocols
The NF filtration system (section 2.1) was first operated using Milli-Q water at a constant pressure (i.e., 1000 kPa) to stabilise permeate flux. The cross flow velocity and solution temperature were adjusted at 0.43 m s−1 and 20.0 ± 0.1 °C, respectively. Thereafter, electrolytes were added to condition the feed solution with the concentrations of 20 mM NaCl, 1 mM CaCl2 and 1 mM NaHCO3. The stock solutions of TrOCs were also dosed into the feed solution to obtain approximately 500 ng L−1 of each chemical which was determined based on their concentrations detected in treated wastewater. The pH of the feed solution was adjusted to 8. The permeate flux was set at 42 L m−2 h−1 by adjusting the feed pressure of the filtration system. The system was continuously operated for 20 hours, which was followed by collecting 500 mL of the permeate and the feed samples for analysis.Compound rejection (R) was calculated using  , where Cp and Cf are measured concentrations in the permeate and feed solutions, respectively. When TrOC concentrations in the permeate were detected at below their detection limits, the analytical detection limit was used for the (minimum) rejection calculation.
2.4 Simulated caustic cleaning protocols
Simulation of caustic cleaning was performed by immersing membrane samples in a test solution. The cleaning solution was adjusted to pH 11 or 12 by adding a small volume of 1 M NaOH solution to Milli-Q water. Prior to the simulated cleanings, flat sheet membrane samples were rinsed with Milli-Q water to remove preservatives from the membrane surface. A membrane sample for each experiment was stored in a 200 mL glass bottle filled with cleaning solution. The bottle was immersed in a water bath (SWB1, Stuart®, Staffordshire, UK) at 30.0 ± 0.3 °C for 25 hours. The 25 hour cleaning period was determined based on typical chemical cleaning frequency and cleaning conditions – twice a year and 4 hour cleaning period for each cleaning event21 – which accounts for the cumulative chemical cleaning period of approximately 3 years filtration system operation. Due to the absence of a fouling layer, this simulated caustic cleaning procedure could significantly overestimate the effect of chemical cleaning. Nevertheless, the evaluation using the experimental protocol described above allowed systematic evaluation of the cleaning effects on TrOC rejections. After chemical cleaning simulation, the membranes were rinsed with Milli-Q water to eliminate residual cleaning solution. These membranes were stored in Milli-Q water at 4 °C until being used for the following filtration experiments.2.5 Analytical techniques
TrOC concentrations in the feed and permeate samples were determined using an analytical method previously reported by Tadkaew et al.22 The deuterated surrogate stock solution was added to each sample (500 mL) to obtain 50 ng L−1 of each surrogate compound. The aqueous samples were then extracted using 6 cc Oasis HLB solid phase extraction (SPE) cartridges (Waters, Milford, MA, USA). The SPE cartridges were eluted and the eluents were transferred into acetonitrile for subsequent quantification using an Agilent 1200 series HPLC system (Palo Alto, CA, USA) coupled with an API 4000 triple quadrupole mass spectrometer (Applied Biosystems, Foster City, CA, USA).The pH, electrical conductivity and temperature of permeate and feed solutions were measured by an Orion 4-Star Plus pH/conductivity meter (Thermo Fisher Scientific, Waltham, MA, USA).
3. Results and discussion
3.1 TrOC rejection
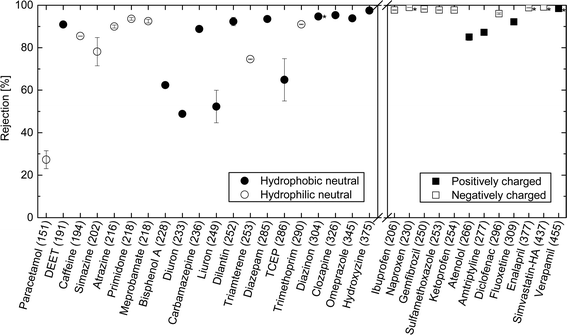
The rejection of neutral hydrophilic (HL) and hydrophobic (HP) TrOCs increased as molecular weight increased (Fig. 3). It is also notable that several hydrophobic and neutral TrOCs (e.g. bisphenol A, diuron, and linuron) exhibited considerably lower rejections compared to the hydrophilic and neutral TrOCs with equivalent molecular weights. All charged TrOCs investigated were highly rejected (>80%) by the NF270 membrane (Fig. 3). Nevertheless, it is discernible that three positively charged TrOCs (i.e., atenolol, amitriptyline, and fluoxetine) had lower rejections than negatively charged TrOCs with equivalent molecular weights. Verapamil is the only positively charged TrOC that had comparable rejection (>97%) to the negatively charged compounds and this can be attributed to its large molecular weight (454.6 g mol−1).It is noteworthy that triclocarban (log![[thin space (1/6-em)]](https://www.rsc.org/images/entities/char_2009.gif) D = 4.93) and triclosan (log
D = 4.93) and triclosan (log![[thin space (1/6-em)]](https://www.rsc.org/images/entities/char_2009.gif) D = 4.57) were excluded from Fig. 3. They are the most hydrophobic compound, respectively, among the neutral and negatively charged TrOCs investigated in this study. The concentration of triclocarban in the feed after 20 hours filtration decreased to below the detection limit (10 ng L−1) in all experiments. Similarly, the concentration of triclosan in the feed decreased to less than 40 ng L−1 after 20 hours filtration. The decrease in feed concentration of these two TrOCs can be attributed to their adsorption onto the membrane due to hydrophobic interaction. The adsorption of hydrophobic TrOCs onto polyamide NF/RO membranes have also been reported in several previous studies.14,23
D = 4.57) were excluded from Fig. 3. They are the most hydrophobic compound, respectively, among the neutral and negatively charged TrOCs investigated in this study. The concentration of triclocarban in the feed after 20 hours filtration decreased to below the detection limit (10 ng L−1) in all experiments. Similarly, the concentration of triclosan in the feed decreased to less than 40 ng L−1 after 20 hours filtration. The decrease in feed concentration of these two TrOCs can be attributed to their adsorption onto the membrane due to hydrophobic interaction. The adsorption of hydrophobic TrOCs onto polyamide NF/RO membranes have also been reported in several previous studies.14,23
Although the rejection of neutral TrOCs did increase as their molecular weight increased, the data are quite scattered. In an early study, Meireles et al.,24 investigated the rejection of several organic solutes (i.e., dextrans, proteins, and polyethylene glycol) by ultrafiltration and microfiltration membranes and suggested that the hydrodynamic volume of these organic solutes rather than molecular weight should be used to characterise their rejection. In their study,24 the hydrodynamic volume parameter is the product between molecular weight and intrinsic viscosity of the solute. It is noteworthy that the intrinsic viscosity of TrOCs may not be readily available. More importantly, Meireles et al.,24 did not account for the 3 dimensional nature of the solute and thus their findings are only valid for microporous membranes (i.e. ultrafiltration and microfiltration). As can be seen in Fig. 4, results reported here show that the minimum projection area is a better surrogate parameter to assess the rejection of neutral TrOCs by the NF270 membrane in comparison to molecular weight. The correlation between minimum projection area and the rejection of neutral TrOCs by the NF270 membrane was generally consistent with that by another NF membrane (NF90, Dow/Filmtec) that was reported in a previous study.25 However, data presented in Fig. 4 also show three exceptions (or outliners) including bisphenol A, caffeine, and TCEP, and their rejection values do not follow the other neutral compounds investigated here.
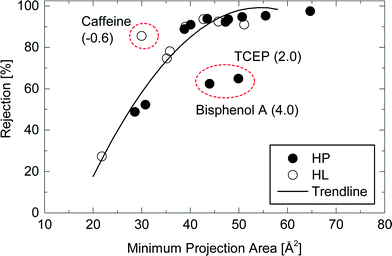 | ||
Fig. 4 Rejection of neutral and hydrophobic (HP) and hydrophilic (HL) TrOCs by the NF270 membrane as a function of the compound minimum projection area. Experimental conditions are described in Fig. 3. The rejection trendline of neutral TrOCs does not include caffeine, TCEP, and bisphenol A. The log![[thin space (1/6-em)]](https://www.rsc.org/images/entities/char_2009.gif) D of these three TrOCs is shown in the parentheses. D of these three TrOCs is shown in the parentheses. | ||
Bisphenol A (log![[thin space (1/6-em)]](https://www.rsc.org/images/entities/char_2009.gif) D = 4.0; MPA = 44 Å2) that showed a lower rejection than the other compounds with equivalent minimum projection areas (Fig. 4). The rejection of bisphenol A (62%) by the NF270 membrane was much lower than that of omeprazole (94%; log
D = 4.0; MPA = 44 Å2) that showed a lower rejection than the other compounds with equivalent minimum projection areas (Fig. 4). The rejection of bisphenol A (62%) by the NF270 membrane was much lower than that of omeprazole (94%; log![[thin space (1/6-em)]](https://www.rsc.org/images/entities/char_2009.gif) D = 2.4; MPA = 44 Å2). Although bisphenol A is the third most hydrophobic compound among the selected neutral TrOCs, the degree of hydrophobic property is not the only factor explaining its low rejection. In fact, the other hydrophobic and neutral TrOCs including diazinon (log
D = 2.4; MPA = 44 Å2). Although bisphenol A is the third most hydrophobic compound among the selected neutral TrOCs, the degree of hydrophobic property is not the only factor explaining its low rejection. In fact, the other hydrophobic and neutral TrOCs including diazinon (log![[thin space (1/6-em)]](https://www.rsc.org/images/entities/char_2009.gif) D = 4.3; MPA = 51 Å2) generally fitted well with the correlation between minimum projection area and rejection (Fig. 4). There can possibly be mechanisms other than electrostatic, steric and hydrophobic interactions that govern the separation of TrOCs by NF membrane. It is interesting to note that one of the three exceptions involved a hydrophilic and neutral TrOC (i.e., caffeine). Caffeine (log
D = 4.3; MPA = 51 Å2) generally fitted well with the correlation between minimum projection area and rejection (Fig. 4). There can possibly be mechanisms other than electrostatic, steric and hydrophobic interactions that govern the separation of TrOCs by NF membrane. It is interesting to note that one of the three exceptions involved a hydrophilic and neutral TrOC (i.e., caffeine). Caffeine (log![[thin space (1/6-em)]](https://www.rsc.org/images/entities/char_2009.gif) D = −0.6; MPA = 30 Å2) – the most hydrophilic compound among the selected TrOCs – exhibited a higher rejection than the other neutral TrOCs with equivalent minimum projection area values: diuron (log
D = −0.6; MPA = 30 Å2) – the most hydrophilic compound among the selected TrOCs – exhibited a higher rejection than the other neutral TrOCs with equivalent minimum projection area values: diuron (log![[thin space (1/6-em)]](https://www.rsc.org/images/entities/char_2009.gif) D = 2.5; MPA = 29 Å2) and linuron (log
D = 2.5; MPA = 29 Å2) and linuron (log![[thin space (1/6-em)]](https://www.rsc.org/images/entities/char_2009.gif) D = 2.7; MPA = 31 Å2).
D = 2.7; MPA = 31 Å2).
The rejection of positively charged TrOCs generally followed the rejection trendline of neutral TrOCs with an exception of amitriptyline that has a hydrophobic property (log![[thin space (1/6-em)]](https://www.rsc.org/images/entities/char_2009.gif) D = 3.0) (Fig. 5). The results suggest that the main mechanism of the rejection of positively charged TrOCs is the size exclusion like neutral TrOCs. Positively charged TrOCs may exhibit lower rejections than uncharged compounds due to their electrostatic attraction with the negatively charged membrane surface that causes the ‘charge concentration polarisation’ phenomenon.12 Nevertheless, in this study, the effect of ‘charge concentration polarisation’ could not be confirmed (Fig. 5). In fact, the electrostatic attraction effect on rejection can vary considerably and can be negligible as previously reported by van der Bruggen et al.26 Although the cause of the difference in the electrostatic attraction among NF membranes still remains unclear, it is noted that the positively charged TrOCs may show lower rejections than neutral TrOCs when used with the other NF membranes. In contrast to the positively charged TrOCs investigated here, the rejection of negatively charged TrOCs was high and was independent of their minimum projection area. The observed high rejection of all negatively charged TrOCs can be attributed to the electrostatic repulsion occurred between these negatively charged TrOCs and the negatively charged NF270 membrane surface (zeta potential = −14 mV at pH 8).18
D = 3.0) (Fig. 5). The results suggest that the main mechanism of the rejection of positively charged TrOCs is the size exclusion like neutral TrOCs. Positively charged TrOCs may exhibit lower rejections than uncharged compounds due to their electrostatic attraction with the negatively charged membrane surface that causes the ‘charge concentration polarisation’ phenomenon.12 Nevertheless, in this study, the effect of ‘charge concentration polarisation’ could not be confirmed (Fig. 5). In fact, the electrostatic attraction effect on rejection can vary considerably and can be negligible as previously reported by van der Bruggen et al.26 Although the cause of the difference in the electrostatic attraction among NF membranes still remains unclear, it is noted that the positively charged TrOCs may show lower rejections than neutral TrOCs when used with the other NF membranes. In contrast to the positively charged TrOCs investigated here, the rejection of negatively charged TrOCs was high and was independent of their minimum projection area. The observed high rejection of all negatively charged TrOCs can be attributed to the electrostatic repulsion occurred between these negatively charged TrOCs and the negatively charged NF270 membrane surface (zeta potential = −14 mV at pH 8).18
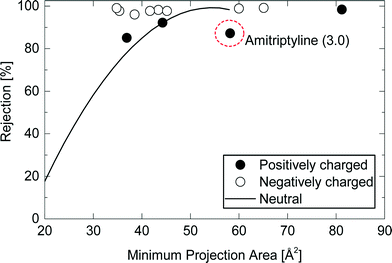 | ||
Fig. 5 Rejection of charged TrOCs by the NF270 membrane as a function of the compound minimum projection area. Experimental conditions are described in Fig. 3. The line “Neutral” is the rejection trendline of neutral TrOCs described in Fig. 4. The log![[thin space (1/6-em)]](https://www.rsc.org/images/entities/char_2009.gif) D of amitriptyline is shown in the parentheses. D of amitriptyline is shown in the parentheses. | ||
3.2 Effects caustic cleaning on permeability and conductivity rejection
Permeability of the NF270 membrane increased by 19% and 54% after caustic cleaning with pH 11 and pH 12 solutions, respectively (Table 2). In response to changes in permeability, conductivity rejection at the permeate flux of 42 L m−2 h−1 decreased from 38% down to 18%. This observation is consistent with findings reported in several previous studies21,27,28 in which NF and RO membranes were exposed to various caustic commercial cleaning reagents. Caustic cleaning did not result in any significant changes in the membrane surface charge (data not shown). Simulated caustic cleaning on polyamide-based membranes with a soaking period of less than 25 hours does not cause a significant change in surface property (e.g. zeta potential and surface chemistry) but the change in membrane performance can be reversed with acidic cleaning according to previous studies;18,21 thus, the observed variation in membrane performance after simulated caustic cleaning is expected to be temporary.| Name | Permeabilitya [L m−2 h−1 bar−1] | Conductivity rejectionb [%] |
|---|---|---|
| a Determined with Milli-Q water at 1000 kPa and 20 °C feed temperature. Values reported here are the average of duplicate experiments. b Determined with feed solution containing 20 mM NaCl, 1 mM NaHCO3, 1 mM CaCl2, at permeate flux 42 L m−2 h−1, feed pH 8.0 ± 0.1 and feed temperature 20.0 ± 0.1 °C. | ||
| NF270 virgin | 15.3 | 38 |
| NF270 cleaned with pH 11 | 18.2 | 22 |
| NF270 cleaned with pH 12 | 23.6 | 18 |
3.3 Effects of caustic cleaning on neutral TrOC rejection
Caustic cleaning led to a notable decrease in the rejection of neutral TrOCs (Fig. 6). For example, paracetamol rejection decreased from 27% to 11 and 18% after exposing the NF270 membrane to pH 11 and pH 12 caustic solutions, respectively. Simon et al.18 hypothesized that NF membrane pores could be enlarged in caustic solutions due to electrostatic repulsion between the deprotonated carboxylic functional groups on the pore walls of the active skin layer at high pH. The impact of caustic cleaning on the rejections of neutral TrOCs was more severe as the cleaning solution pH increased and was more apparent with compounds that exhibited low or moderate rejection by virgin membranes (Fig. 6).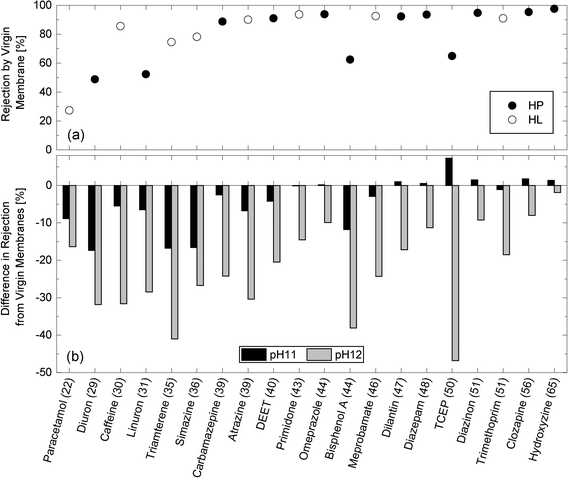 | ||
| Fig. 6 (a) Rejection of neutral and hydrophobic (HP) and hydrophilic (HL) TrOCs by the virgin NF270 membrane, and (b) differences in rejection after being exposed to pH 11 and pH 12 solutions for 25 h at 30 °C. Experimental conditions are described in Fig. 3. The minimum projection area (Å2) is shown in the parentheses. | ||
Minimum projection area also allows for a better assessment of the impact of operating condition variation on TrOC rejections by the NF270 membrane. The strong correlation between minimum projection area of neutral TrOCs and their rejections could still be observed after caustic cleaning (Fig. 7b & c). Once again, there were three outline TrOCs (i.e., caffeine, bisphenol A, and TCEP) as previously discussed in section 3.1. However, a similar conclusion can be made for these compounds. For example, as can be seen in Fig. 7, caffeine rejection by the NF270 membrane decreased from 86% (virgin condition) to 54% (immediately after caustic chemical cleaning at pH 12).
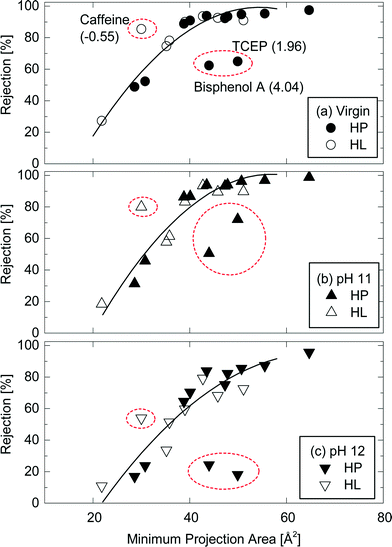 | ||
Fig. 7 Rejection of neutral and hydrophobic (HP) and hydrophilic (HL) TrOCs by (a) the virgin NF270 membrane, and the NF 270 membranes after being exposed to (b) pH 11 and (c) pH 12 caustic solutions as a function of their minimum projection area. Experimental conditions are described in Fig. 3. The rejection trendline of neutral TrOCs does not include caffeine, TCEP, and bisphenol A. The log![[thin space (1/6-em)]](https://www.rsc.org/images/entities/char_2009.gif) D of these three TrOCs is shown in the parentheses. D of these three TrOCs is shown in the parentheses. | ||
3.4 Effects of caustic cleaning on charged TrOC rejection
Charged TrOCs were generally well rejected by the NF270 membrane. Moreover, the impact of caustic cleaning on the rejection of negatively charged TrOCs was rather insignificant (Fig. 8). On the other hand, significant impacts of caustic cleaning was observed for the rejections of atenolol which has the lowest molecular weight among all positively charged TrOCs investigated here. The rejections of atenolol decreased substantially from 85% (by virgin membranes) to 76.4 and 47.8% (after caustic cleaning with pH 11 and 12, respectively). The rejection of positively charged TrOCs increased with increasing minimum projection area and was generally comparable to that of neutral TrOCs even after caustic cleaning was applied (Fig. 9), indicating that the rejection of positively charged TrOCs could be predicted using minimum projection area regardless of the application of chemical cleaning. By contrast, the rejection of negatively charged TrOCs remained unrelated with minimum projection area.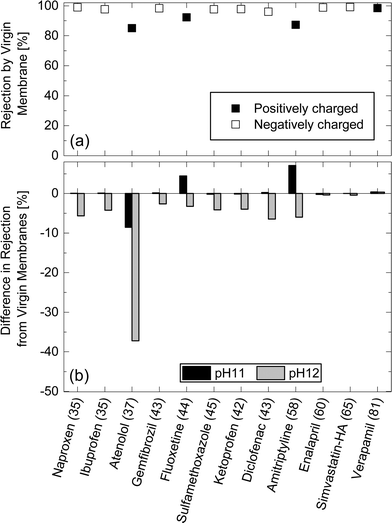 | ||
| Fig. 8 (a) Rejection of positively and negatively charged TrOCs by the virgin NF270 membrane, and (b) differences in rejection after being exposed to pH 11 and pH 12 solutions for 25 h at 30 °C. Experimental conditions are described in Fig. 3. The minimum projection area (Å2) is shown in the parentheses. | ||
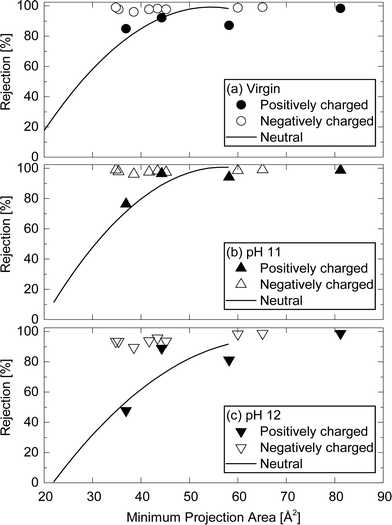 | ||
| Fig. 9 Rejection of positively and negatively charged TrOCs by (a) the virgin NF270 membrane, and the NF 270 membranes after being exposed to (b) pH 11 and (c) pH 12 caustic solutions as a function of their minimum projection area. Experimental conditions are described in Fig. 3. The rejection trendline of neutral TrOCs does not include caffeine, TCEP, and bisphenol A. | ||
4. Conclusions
Results reported in this study provide further insights to the rejection mechanisms of TrOCs by the NF270 membrane. All charged TrOCs investigated in this study were highly rejected (>80%). However, the rejections of positively charged TrOCs were lower than those of negatively charged TrOCs with equivalent molecular sizes. These results suggest that an electrostatic repulsion between a negatively charged membrane and TrOCs was a major factor contributing to the high rejections of these negatively charged TrOCs. Our results show that the minimum projection area was a better surrogate parameter for molecular dimension than molecular weight. The rejection of most neutral and positively charged TrOCs could potentially be expressed as a function of the minimum projection area. On the other hand, the rejection of negatively charged TrOCs was high and was independent of the minimum projection area. This study highlights the need to consider the rejection of neutral and positively charged TrOCs (particularly those that are moderately rejected by membranes) after caustic cleaning.References
- M. A. Shannon, P. W. Bohn, M. Elimelech, J. G. Georgiadis, B. J. Marinas and A. M. Mayes, Nature, 2008, 452, 301–310 CrossRef CAS PubMed.
- B. I. Escher, R. Baumgartner, M. Koller, K. Treyer, J. Lienert and C. S. McArdell, Water Res., 2011, 45, 75–92 CrossRef CAS PubMed.
- R. P. Schwarzenbach, B. I. Escher, K. Fenner, T. B. Hofstetter, C. A. Johnson, U. von Gunten and B. Wehrli, Science, 2006, 313, 1072–1077 CrossRef CAS PubMed.
- C. G. Pan, G. G. Ying, Y. S. Liu, Q. Q. Zhang, Z. F. Chen, F. J. Peng and G. Y. Huang, Chemosphere, 2014, 114, 16–25 CrossRef CAS PubMed.
- G.-G. Ying, J.-L. Zhao, L.-J. Zhou and S. Liu, Compr. Anal. Chem., 2013, 62, 453–557 CAS.
- WHO, Pharmaceuticals in drinking-water, World Health Organization, 2012 Search PubMed.
- B. J. Vanderford, J. E. Drewes, A. Eaton, Y. C. Guo, A. Haghani, C. Hoppe-Jones, M. P. Schluesener, S. A. Snyder, T. Ternes and C. J. Wood, Anal. Chem., 2014, 86, 774–782 CrossRef CAS PubMed.
- T. A. Ternes, A. Joss and H. Siegrist, Environ. Sci. Technol., 2004, 38, 392A–399A CrossRef CAS.
- Y. Luo, W. Guo, H. H. Ngo, L. D. Nghiem, F. I. Hai, J. Zhang, S. Liang and X. C. Wang, Sci. Total Environ., 2014, 473–474, 619–641 CrossRef CAS PubMed.
- B. van der Bruggen and C. Vandecasteele, Environ. Pollut., 2003, 122, 435–445 CrossRef CAS.
- C. Bellona, J. E. Drewes, P. Xu and G. Amy, Water Res., 2004, 38, 2795–2809 CrossRef CAS PubMed.
- A. R. D. Verliefde, E. R. Cornelissen, S. G. J. Heijman, J. Q. J. C. Verberk, G. L. Amy, B. van der Bruggen and J. C. van Dijk, J. Membr. Sci., 2008, 322, 52–66 CrossRef CAS PubMed.
- K. Kimura, G. Amy, J. Drewes and Y. Watanabe, J. Membr. Sci., 2003, 221, 89–101 CrossRef CAS.
- Y. Kiso, Y. Sugiura, T. Kitao and K. Nishimura, J. Membr. Sci., 2001, 192, 1–10 CrossRef CAS.
- A. R. D. Verliefde, E. R. Cornelissen, S. G. J. Heijman, I. Petrinic, T. Luxbacher, G. L. Amy, B. van der Bruggen and J. C. van Dijk, J. Membr. Sci., 2009, 330, 90–103 CrossRef CAS PubMed.
- C. Bellona, M. Marts and J. E. Drewes, Sep. Purif. Technol., 2010, 74, 44–54 CrossRef CAS PubMed.
- P. Xu, J. E. Drewes, T.-U. Kim, C. Bellona and G. Amy, J. Membr. Sci., 2006, 279, 165–175 CrossRef CAS PubMed.
- A. Simon, W. E. Price and L. D. Nghiem, J. Membr. Sci., 2013, 432, 73–82 CrossRef CAS PubMed.
- N. Porcelli and S. Judd, Water Res., 2010, 44, 1389–1398 CrossRef CAS PubMed.
- B. van der Bruggen, A. Verliefde, L. Braeken, E. R. Cornelissen, K. Moons, J. Q. J. C. Verberk, H. J. C. van Dijk and G. Amy, J. Chem. Technol. Biotechnol., 2006, 81, 1166–1176 CrossRef CAS PubMed.
- T. Fujioka, S. J. Khan, J. A. McDonald, A. Roux, Y. Poussade, J. E. Drewes and L. D. Nghiem, Desalination, 2014, 343, 60–66 CrossRef CAS PubMed.
- N. Tadkaew, F. I. Hai, J. A. McDonald, S. J. Khan and L. D. Nghiem, Water Res., 2011, 45, 2439–2451 CrossRef CAS PubMed.
- V. Yangali-Quintanilla, A. Verliefde, T. U. Kim, A. Sadmani, M. Kennedy and G. Amy, J. Membr. Sci., 2009, 342, 251–262 CrossRef CAS PubMed.
- M. Meireles, A. Bessieres, I. Rogissart, P. Aimar and V. Sanchez, J. Membr. Sci., 1995, 103, 105–115 CrossRef CAS.
- T. Fujioka, S. J. Khan, J. A. McDonald and L. D. Nghiem, Sep. Purif. Technol., 2014, 136, 258–264 CrossRef CAS PubMed.
- B. van der Bruggen, J. Schaep, D. Wilms and C. Vandecasteele, J. Membr. Sci., 1999, 156, 29–41 CrossRef CAS.
- R. Liikanen, J. Yli-Kuivila and R. Laukkanen, J. Membr. Sci., 2002, 195, 265–276 CrossRef CAS.
- S. S. Madaeni, T. Mohamamdi and M. K. Moghadam, Desalination, 2001, 134, 77–82 CrossRef CAS.
| This journal is © The Royal Society of Chemistry 2015 |

