Transformation of atrazine, bisphenol A and chlorendic acid by electrochemically produced oxidants using a lead dioxide electrode
N.
Hermes
and
G.
Knupp
*
Department of Applied Natural Sciences, Bonn-Rhein-Sieg University of Applied Sciences, von-Liebig-Straße 20, 53359 Rheinbach, Germany. E-mail: gerd-knupp@h-brs.de; Fax: +49 2241 865 8533; Tel: +49 2241 865 533
First published on 24th August 2015
Abstract
Artificial waters containing the xenobiotics atrazine, bisphenol A and chlorendic acid were treated by use of micro-disinfection apparatus, based on electrochemical ozone production. The design and working principle, as well as the applicability of the apparatus for the degradation of the target compounds is presented. The initial concentrations of the analytes were chosen to be in the mg L−1 order. Degradation and transformation of the analytes was determined via LC-MS, UV/Vis, and IC. Bisphenol A was degraded completely within short ozonation times, but complete mineralization could not be achieved. Ion chromatography indicated formic and oxalic acid to be transformation products. For atrazine a degradation of 96% could be achieved within 3 h. Intermediate transformation products, like desethylatrazine, desisopropylatrazine, and desethyl-desisopropylatrazine, are formed and further degraded to formic acid and chloride. Chlorendic acid was degraded by up to 40% of the initial concentration. Analyses by UV/Vis and IC again showed formic acid, chloride, and also chlorate to be transformation products.
Water impactWater pollution by xenobiotics is a problem of significant environmental impact. Promising advanced oxidation techniques for water and waste water treatment, that can operate efficiently and sustainably, are still needed. In this paper we present a new small-scale device for electrochemically ozone production, which is able to degradate organic pollutants effectively in aqueous media. The effect of different ozone contact times were studied and degradation products are characterised. Purified water in small amounts (mL to L range) might be of great importance for medical and pharmaceutical use in areas, where no regular water or waste water treatment is possible, e.g. deserts, developing countries. |
1 Introduction
“Access to safe drinking water is essential to health, a basic human right and a component of effective policy for health protection”.1 For this reason, the quality of drinking water is controlled by guidelines and by law in almost all countries. To achieve satisfactory quality, water from different sources, such as ground and surface water, has to be treated in different ways to remove and degrade contaminants. These include pharmaceuticals, pesticides, and industrial products.2–6 Several reports show that traditional water treatment processes often are inadequate for the removal and degradation of said contaminants.3,4,6,7 Therefore improved water treatment processes are needed, able to degrade contaminants of different substance classes efficiently, to ensure the quality of the resulting drinking water. Due to ozone's high oxidation potential, the process of ozonation appears to be a suitable solution. Ozone is already used in the disinfection process and is more and more applied for degradation and removal of contaminants, as well.8,9 There are sewage treatment plants and waterworks in Germany (Gelsenkirchen, Bad Sassendorf), Switzerland (Regensdorf), Japan, and other countries where ozonation (by silent electrical discharge) has already been integrated in the respective treatment processes. In such plants several hundreds of cubic metres of water are cleaned and treated daily. This large-scale application can be performed locally only via extensive and costly installations. For small-scale applications, e.g. treatment of low amounts of water in short times, a decentralized system is more suitable. This could be integrated into water supply chains or as a portable device for instant on-site purification of water. In the course of the development of such systems, the use of electrocatalytically produced ozone came into the focus of research.10–14 The company Innovatec Gerätetechnik GmbH (Rheinbach/Germany) developed a micro-disinfection apparatus, called “microcell”, which comprises a proton-exchange membrane (PEM) cell, the cell heart, with an anode consisting of porous, oxidation-resistant titanium with a catalytic coating of lead dioxide (β-PbO2; plattnerite). The cathode was constructed of porous stainless steel; a Nafion membrane is used as solid electrolyte. Fig. 1 shows the dimensions of this microcell equipped with different numbers of cell hearts. For each microcell an electrical power supply is used which makes the system suitable for portable use. Due to the microcell's dimensions, small-scale application is possible, suitable for treating water volumes of a few litres. The ozone production rate of 15–60 mg O3 h−1 for one up to four micro cells15 are very low in comparison to industrial ozone generators with outputs of 0.3 to 4 g h−1.16 Therefore the device's use poses no health concerns, particularly since ozone is metastable and decomposes with a half-life of about 20 minutes (in ultrapure water).16 | ||
| Fig. 1 Microcells assembled with a different number of cell hearts [Patent WO 2005/054545].15 | ||
As part of a governmentally funded research project for the development, testing, and improvement of a decentralised, ozone-based decontamination system, the efficiency of this new small-scale in situ micro-ozone generator is demonstrated. Main focus of this research is the degradation of xenobiotics in artificially contaminated but otherwise ultrapure water in order to evaluate the efficiency of the microsystem to degrade organic pollutants. Bisphenol A (industrial product, monomer in production of epoxy resins and polycarbonate, plasticiser), atrazine (pesticide) and chlorendic acid (industrial product, flame retardant) were chosen as test substances due to their important environmental impact, their ubiquitous use, and their known stability against biological and chemical treatment.2,7,17–30 The analytes' percentage of degradation is studied as well as the formation of transformation products.
2 Materials and methods
2.1 Chemicals
Standards of bisphenol A (BPA), atrazine (AZ) and transformation products desethylatrazine (DEA), desisopropylatrazine (DIA), desethyl-desisopropylatrazine (DEDIA), 2-hydroxyatrazine (HAZ) and cyanuric acid (CyA) were purchased from Sigma Aldrich/Germany. Chlorendic acid (CA) was provided by Lancaster Synthesis (England). LC-grade methanol and acetonitrile with purities higher than 99.95% (Carl Roth/Germany) were used. Solutions were prepared by using ultrapure water from the water delivery system Purelab Flex (ELGA LabWater/Germany). Stock solutions of the analytes BPA (1 g L−1), AZ (0.5 g L−1), and CA (5 g L−1) were prepared by dissolving precisely weighed samples in a mixture of methanol and ultrapure water at a volume ratio of 1![[thin space (1/6-em)]](https://www.rsc.org/images/entities/char_2009.gif) :
:![[thin space (1/6-em)]](https://www.rsc.org/images/entities/char_2009.gif) 1. All solutions were preserved in the dark and at room temperature. The working dilutions were made from a defined volume of the stock solutions filled up with ultrapure water, giving the following concentrations: BPA 10 mg L−1, AZ 5 mg L−1, CA 50 mg L−1. The initial pH values of the working dilutions ranged from 6 (for AZ and BPA) to 4 (for CA). No scavenger for hydroxyl radicals and no buffer were used during the experiments. Standards of the transformation products of AZ were prepared at concentrations of 1 mg L−1 each.
1. All solutions were preserved in the dark and at room temperature. The working dilutions were made from a defined volume of the stock solutions filled up with ultrapure water, giving the following concentrations: BPA 10 mg L−1, AZ 5 mg L−1, CA 50 mg L−1. The initial pH values of the working dilutions ranged from 6 (for AZ and BPA) to 4 (for CA). No scavenger for hydroxyl radicals and no buffer were used during the experiments. Standards of the transformation products of AZ were prepared at concentrations of 1 mg L−1 each.
2.2 Electrochemical apparatus and procedure
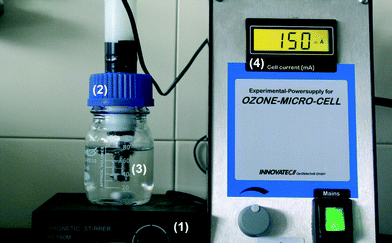
The company Innovatec Gerätetechnik GmbH (Rheinbach/Germany) provided six “microcells” for ozone production from water, and each of them can be equipped with one to four cell hearts. Each cell heart represents a separate electrochemical cell. According to the manufacturer, the ozone production ranges from 15–60 mg O3 h−1 when using 1 to 4 microcells in series. Fig. 2 shows the experimental set-up for one microcell; the design and working principle is described in chapter 3. The microcells are integrated in the cover plates of the flasks used. During the preparation of the working solutions, the microcells were actuated with a low electrical charge of less than 5 mA in ultrapure water. The flasks then were filled with 80 mL of the working solution and tightly closed with cover plates. All experiments were performed galvanostatically at an electrical charge of 150 mA, and the solutions were magnetically stirred during the whole ozonation. At the end of the treatment the electrical charge was reduced to less than 5 mA, and samples for analyses were taken. For each treatment time two microcells were operated in parallel.2.3 Analytical methods
The analytes' degradation percentage and the formation of transformation products was analysed via LC-MS/MS. An LC 1200 series (Agilent Technologies/USA) coupled to an AB SCIEX QTRAP 5500 MS with ESI source (Applied Biosystems/USA) was used. Chromatographic separation was performed on a Luna RP C18 column (15 cm × 2 mm × 3 μm; Phenomenex/Germany). AZ, its transformation products and CA were analysed in one run; for BPA and its transformation products slightly different conditions were used. For both methods, the column temperature was kept at 25 °C and the flow rate set to 0.350 mL min−1.• AZ, AZ degradation products, CA: mobile phase: (A) ultrapure water with 0.1% formic acid, (B) acetonitrile; gradient: start at 98% A, after 2 min it was decreased to 20% and held for 4 min. Prior to analysis, an equilibration time of 10 min was included.
• BPA, BPA degradation products: mobile phase: (A) ultrapure water, (B) acetonitrile (both modified with 10 mmol ammonium acetate); gradient: start at 20% B, after 4 min it was increased to 90% and held for 12 min. Prior to analysis, an equilibration time of 10 min was included.
The MS analysis was performed in MRM mode. Analysis of BPA and its transformation products was done in negative mode only, whereas for the other analytes switching between positive and negative mode was needed. Table 1 shows the analysed fragment ions.
| Analyte | Q1 mass | Q3 mass | Analyte | Q1 mass | Q3 mass |
|---|---|---|---|---|---|
| AZ | 216 | 174 | CA | 387 | 351 |
| 104 | 279 | ||||
| 68 | BPA | 227 | 212 | ||
| 133 | |||||
| Degradation products AZ | Degradation products BPA | ||||
| DEA | 188 | 146 | |||
| 104 | |||||
| 79 | |||||
| DIA | 174 | 104 | B1 | 275 | 231 |
| 79 | 275 | ||||
| 68 | B3 | 151 | 133 | ||
| DEDIA | 146 | 104 | B4 | 241 | 226 |
| 79 | 213 | ||||
| 68 | B5 | 243 | 228 | ||
| HAZ | 198 | 156 | b2 | 325 | 281 |
| 114 | 263 | ||||
| 86 | |||||
| 69 | |||||
| CyA | 128 | 85 | |||
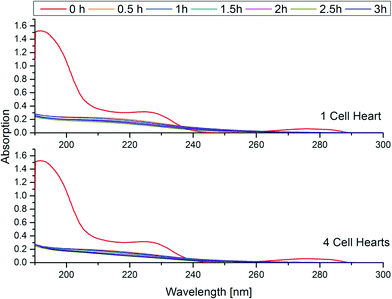
The degradation and development of transformation products was also studied via UV/Vis and IC. For UV/Vis a DR3900 spectrometer (Hach Lange/Germany) was used in wavelength scan mode. The absorption was studied in the range 190–300 nm with a resolution of 0.2 nm. For the identification of anions, an 861 Advanced Compact IC with 863 Advanced Autosampler (Metrohm/Switzerland) was used. Chromatographic separation was done on a Metrosep A SUPP 5 (250 mm × 4 mm × 5 μm) column. The mobile phase consisted of 3.2 mM Na2CO3/1.0 mM NaHCO3/5% acetonitrile in ultrapure water. A flow rate of 0.7 mL min−1 was set, and the run time was 35 min. The identification of peaks was done by comparison of retention times with commercially available standards.
3 Design and working principle of the micro-ozone generator
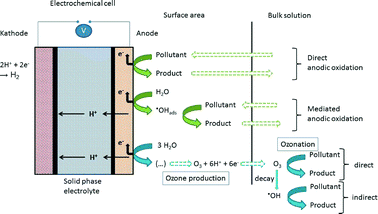
The micro-ozone generator used in this study comprises an electrochemical cell and a power supply and was developed by Innovatec Gerätetechnik GmbH (Rheinbach/Germany). The electrochemical cell consists of a porous TiO2/PbO2-anode, a porous stainless steel cathode, and a solid phase electrolyte (the membrane). Both electrodes, connected to the power supply, are mounted on the membrane with the reactive areas being situated on the inside. A basic scheme of the construction is shown in Fig. 3. The membrane is made of Nafion, a sulfonated tetrafluoroethylene-based fluoropolymer-copolymer, which is widely used as proton-exchange membrane (PEM), e.g. in fuel cells. A huge advantage of the PEM cell is the prevention of anode corrosion, as reported by Stucki et al.32The cathode usually consists of an inert material such as stainless steel. The choice of the anode material is a very important parameter for the electrochemical oxidation. According to Comninellis,33 two classes of electrodes are used:
- active anodes, which directly take part in the oxidation process (e.g. Pt, IrO2)
- non-active anodes, which do not participate in the oxidation process (e.g. PbO2, boron-doped diamond (BDD) electrodes)
The electrochemical cell used in this study is supposed to be disposable, therefore for the anode low-cost material still facilitating the ozone production should be used. A suitable candidate for this is an PbO2-coated anode. This material has several advantages, e.g. high oxygen overpotential and a good current efficiency.34–36 On the other hand there is a severe disadvantage to be taken into account, as water-soluble Pb2+ ions might be released.34,36,37 But a long-term study in our laboratories by Witzleben et al.38 showed Pb2+ concentrations not exceeding critical values (0.01 mg L−1 specified by WHO, EU and German guidelines).
With non-active anodes (e.g. with PbO2 coating) water electrolysis leads to the formation of hydroxyl radicals, which are physisorbed onto the anode surface and may react with organic material contained in the medium. In addition, the formation of ozone is facilitated.35 The reaction mechanism for this is quite complex and not yet fully understood, but it directly involves the physisorbed hydroxyl radicals at the anode surface. The following reactions, taken from Wang and Chen,8 give a short overview of the mechanism of ozone production:
| 2H2O → OH˙(ads) + H+ + e− |
| 2OH˙ → O2(ads) + 2H+ + 2e− |
| OH˙(ads) + O2(ads) → ˙HO3(ads) |
| ˙HO3(ads) → H+ + O3 + e− |
Further literature provides more detailed information on the ozone production mechanisms.35–37 With ozonation being used for the decontamination of water, different degradation processes occur at the cell. An overview is given in Fig. 3. Not shown in the scheme is the cathodic reduction which might lead to dehalogenation reactions. More prominent are the reactions occurring at the anode surface and in the bulk solution. Oxidation can occur directly at the anode itself by immediate electron transfer reactions.35,37,39 This requires a transport of the pollutant from the bulk solution to the surface area of the anode and a transfer of the oxidation product back to the bulk solution. Another important reaction pathway is the reaction of pollutants with the adsorbed hydroxyl radicals on the surface of the electrode material, the so-called mediated direct anodic oxidation.35 In the bulk solution ozonation reactions take place. There are two possible reaction pathways:
- direct reactions with the ozone molecule
- indirect reactions with hydroxyl radicals produced during the decay of ozone in water
Overall, by using an electrochemical cell for in situ ozone production in water, several processes might be responsible for the degradation of pollutants. In this study it was not distinguished whether direct or indirect anodic oxidations or cathodic reductions took place. Since the described apparatus is meant to be used as a portable device or for being implemented in drinking-water supply systems with disposable electrochemical cells, the working efficiency of the cell itself was tested.
4 Results and discussion
4.1 Percentage of analytes' degradation
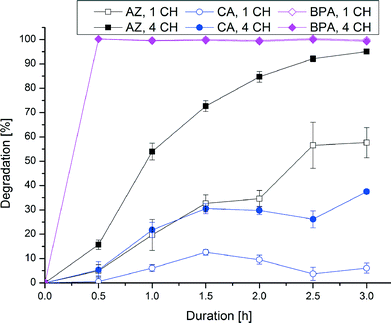
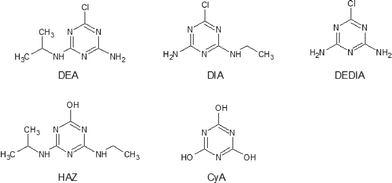
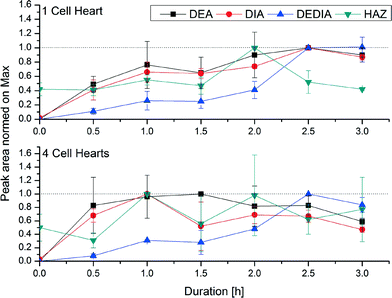
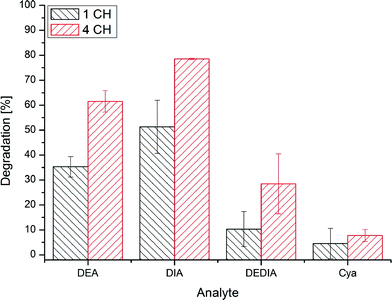
Fig. 4 shows the analytes' chemical structures. Their degradation as a function of the duration of ozonation and number of cell hearts is illustrated in Fig. 5. The error bars represent the standard deviations of two repetitions with duplicate analysis for each sample. All analytes were degraded to different extents. BPA shows complete degradation when applying the lowest number of cell hearts (1) and the shortest duration of treatment (0.5 h). For AZ and CA a clear dependency of the degradation on the duration and number of cell hearts was seen. AZ was degraded up to 95%. Therefore, 5% of the initial concentration remained, which is equivalent to a concentration of about 0.25 mg L−1. In Europe, according to the Guideline 98/83/EG, a maximum concentration of 0.1 μg L−1 for a single pesticide is allowed in drinking water; this value was exceeded by more than an order of magnitude, but the concentration of AZ used in this study is unlikely to be found in nature. Preliminary experiments showed a dependency of the degradation efficiency on the initial concentration with higher degradation values achieved at lower initial concentrations. It therefore can be concluded that ozonation can lead to a complete degradation of AZ at environmentally relevant concentrations.CA only showed a maximum degradation value of 40% after treating the sample for three hours with four cell hearts. Interestingly, the quadrupled number of cell hearts does not lead to a quadrupled degradation. A simple explanation for this remains to be found. The results obtained show a difference in reactivity of the analytes towards ozonation, with BPA being more reactive than AZ and CA being the least reactive. For BPA and AZ this is in accordance with rate constants for the ozonation found in literature.40,41 For CA no information could be found on rate constants.
Said differences can be explained by the structures of the analytes:
• BPA has two electron-rich centres which can easily be attacked by the ozone molecule.42–44
• For AZ the main degradation pathway is via the amine side chains leading to the elimination of the alkyl groups. Another reaction type is the substitution of the side chains and the chlorine by hydroxyl groups leading to the formation of hydroxylated degradation products and, in the case where all side chains are substituted, cyanuric acid. The triazine ring itself can be viewed as inactive towards ozone attack, although suggestions can be found in literature that ring-opening is possible.45–50
• CA has a chlorinated norbornene structure. The strong −I effect of the chlorine atoms reduces the reactivity of the substance towards ozone and other oxidants significantly. Nevertheless, the results show that degradation of CA can be achieved. The literature also lists references to the successful ozonation of chlorinated C![[double bond, length as m-dash]](https://www.rsc.org/images/entities/char_e001.gif) C double bonds.26,29,51
C double bonds.26,29,51
Measurements of the pH after short ozonation (0.5 h) showed values of 3 (CA) to 4.5 (AZ and BPA). It therefore would appear that a direct reaction with the ozone molecule dominates the degradation pathway, compared to indirect reactions with hydroxyl radicals from ozone decomposition.52 Nevertheless, it cannot be said to what extent the direct anodic oxidation occurs. Also indirect anodic reactions via the generation of radicals might influence the degradation as well as reduction reactions at the cathode. This was not studied separately during this work.
4.2 Development of transformation products
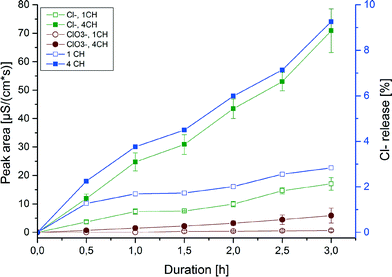
The residual methanol in the working solutions leads to the formation of a low amount of formic acid during the experiments, which could be observed as a very small signal in IC. Compared to the formic acid resulting from the analytes during ozonation it was negligible.The release of chlorine was analysed by IC. In the chromatograms chlorate was also identified. The development of both is shown in Fig. 10, plotting the peak area against the duration of ozonation. As can be seen for both anions, a clear dependency of their development on the duration and the number of cell hearts was observed. The development of chlorine changes dramatically by applying more cell hearts. By calculating the concentration of chlorine equivalents released (determined from the sum of chloride and chlorate) it was found that only about 10% of the maximum chlorine release, calculated on the initial concentration of chlorendic acid, could be achieved (see Fig. 10, blue lines and right y-axis). Comparing this to the degradation values obtained by LC/MS-MS, the chlorine release only explains a quarter of the overall degradation. There must be another mechanism leading to the destruction of the chemical structure of CA. A possibility would be the splitting off of the acid groups, as formic acid and acetic acid can be identified as degradation products via IC. Further investigation is needed to detect the counterpart products like the chlorinated norbornene structure; this was not performed during this study.
5 Conclusions and future aspects
In this study it was proved that in situ micro-ozonation can be used to degrade bisphenol A, atrazine and chlorendic acid in concentrations by far exceeding those likely to be found in the environment. Bisphenol A can be degraded completely within short ozonation times applying the lowest ozone concentration. This is due to the two electron-rich centres of the structure at which the ozone attack can occur easily. Regarding transformation products, only formic acid and oxalic acid can be identified. Some typical transformation products containing intact benzoic structures could not be identified. For atrazine, longer ozonation times and ozone doses were needed to reach a maximum degradation of 95%. It can be postulated that the ozone attack leads to dealkylation and dechlorination. Therefore the degradation products DEA, DIA, DEDIA, and HAZ can be found, which also are degraded upon further treatment. In a single study on standards of the products DEA, DIA, DEDIA, and CyA, a degradability for all products could be proved, even for CyA. For chlorendic acid only a maximum of 40% degradation could be achieved. However, this is a remarkable result considering this substance's stable structure. As degradation products, only formic acid, chlorine and chlorate can be identified, but there is evidence that not only dechlorination is responsible for the degradation.The microcell system employed therefore proved to be a useful tool for the degradation of xenobiotics of different substance classes and can be used in small scale for the purification and disinfection of water. At the moment no robust data and no realistic criteria for comparing the presented system with other technologies (UV or other advanced oxidation processes (AOP)) are available. What can be said – based on the manufacturers information – is, that direct energy costs are rather low with respect to a specific energy requirement of 65 kWh per kg of ozone. This is much higher than the requirement of an ozone generator based on corona discharge but nevertheless negligible in comparison with the ozone quantities needed here in the microcell device (15–60 mg h−1).
In a forthcoming publication, we shall report the results of our studies on the degradation of widely-used pharmaceutical drugs as well as on the determination of the extend of direct anodic reactions and the effects of the water matrix by conducting the ozonation experiments using tap water.
Acknowledgements
This work is part of the research project “micrOzone – a micro disinfection system for decentralized decontamination of water distribution systems” funded by the German Federal Ministry of Education and Research (support code 02WQ1286B). Supply of equipment by Innovatec Gerätetechnik GmbH, Rheinbach/Germany is gratefully acknowledged. Additionally, we thank Johannes Wilms for supporting us in LC-MS/MS experiments.Notes and references
- WHO, Guidelines for drinking-water quality, WHO, Geneve, Switzerland, 4th edn, 2011, ISBN 978 92 4 154815 1 Search PubMed.
- S.-W. Nam, B.-I. Jo, Y. Yoon and K.-D. Zoh, Chemosphere, 2014, 95, 156 CrossRef CAS PubMed.
- L. J. P. Snip, X. Flores-Alsina, B. G. Plosz, U. Jeppson and K. V. Gernaey, Environ. Model. Softw., 2014, 62, 112 CrossRef PubMed.
- Y. Luo, W. Guo, H. H. Ngo, L. D. Nghiem, F. I. Hai, J. Zhang, S. Liang and X. C. Wang, Sci. Total Environ., 2014, 473–474, 619 CrossRef CAS PubMed.
- R. Meffe and I. de Bustamente, Sci. Total Environ., 2014, 481, 280 CrossRef CAS PubMed.
- C. Avila, J. Nivala, L. Olsson, K. Kassa, T. Headley, R. A. Müller, J. M. Bayona and J. Garcia, Sci. Total Environ., 2014, 494–495, 211 CrossRef CAS PubMed.
- S. Sanches, A. Penetra, A. Rodrigues, V. V. Cardoso, E. Ferreira, M. J. Benoliel, M. T. Barreto Crespo, J. G. Crespo and V. J. Pereira, Sep. Purif. Technol., 2013, 115, 73 CrossRef CAS PubMed.
- Y.-H. Wang and Q.-Y. Chen, Int. J. Electrochem., 2013, 128248, DOI:10.1155/2013/128248.
- U. von Gunten, Water Res., 2003, 37, 1443 CrossRef CAS.
- A. Kraft, M. Stadelmann, M. Wünsche and M. Blaschke, Electrochem. Commun., 2006, 8, 883 CrossRef CAS PubMed.
- P. Millet, R. Ngameni, S. A. Grigoriev, N. Mbemba, F. Brisset, A. Ranjbari and C. Etievant, Int. J. Hydrogen Energy, 2010, 35, 5043 CrossRef CAS PubMed.
- L. M. da Silva and M. H. P. Santana, Quim. Nova, 2003, 26, 880 CrossRef CAS.
- L. M. da Silva, L. A. de Faria and J. F. C. Boodts, Electrochim. Acta, 2003, 48, 699 CrossRef CAS.
- X. Zhou, Z. Chen, F. Delgado, D. Brenner and R. Srivastava, J. Electrochem. Soc., 2007, 154, B82 CrossRef CAS PubMed.
- Elektrolytischer Ozongenerator Experimental-Kit OZON-MICRO-ZELLE. Available online: http://www.innovatec-rheinbach.de/html/produkte.html, (accessed on 03-Aug-2014).
- S. Stucki, D. Schulze, D. Schuster and C. Stark, Pharmaceutical Engineering, 2005, 25, 1 Search PubMed.
- W. Hua, E. R. Bennett and R. J. Letcher, Water Res., 2006, 40, 2259 CrossRef CAS.
- E. de Geronimo, V. C. Aparicio, S. Barbaro, R. Portocarrero, S. Jaime and J. L. Costa, Chemosphere, 2014, 107, 423 CrossRef CAS PubMed.
- P. Palma, M. Köck-Schulmeyer, P. Alvarenga, L. Ledo, I. Barbosa, M. Lopez de Alda and D. Barcelo, Sci. Total Environ., 2014, 488–489, 208 CrossRef CAS PubMed.
- D. Vondberg, J. Vanderborgth, N. Cremer, T. Pütz, M. Herbst and H. Vereecken, Water Res., 2014, 50, 294 CrossRef PubMed.
- T. Garoma and S. Matsumoto, J. Hazard. Mater., 2009, 167, 1185 CrossRef CAS PubMed.
- X. Li, L. Lin, S. Zou, C. Lan and T. Luan, Fenxi Huaxue, 2006, 34, 325 CAS.
- H. Gallart-Ayala, E. Moyano and M. T. Galveran, Rapid Commun. Mass Spectrom., 2007, 21, 4039 CrossRef CAS PubMed.
- D. A. Azevedo, S. Rabouan, P. Mazellier, J.-P. Duguet and B. Legube, J. Braz. Chem. Soc., 2001, 12, 532 CrossRef CAS.
- F. Sacher, B. Körner, A. Thoma, H.-J. Brauch and D. Khiari, Water Sci. Technol.: Water Supply, 2010, 10, 610 CrossRef CAS.
- J. P. Stowell and J. N. Jensen, Water Res., 1991, 25, 83 CrossRef CAS.
- P. F. Hendrix, J. A. Hamala, C. L. Langner and H. P. Kollig, Chemosphere, 1983, 12, 1083 CrossRef CAS.
- N. Boisa, J. Appl. Sci. Environ. Manage., 2013, 17, 335 Search PubMed.
- J. H. Sebastian, A. S. Weber and J. N. Jensen, Water Res., 1996, 30, 1833 CrossRef CAS.
- A. R. Freshour, S. Mawhinney and D. Bhattacharyya, Water Res., 1996, 30, 1949 CrossRef CAS.
- M. Deborde, S. Rabouan, P. Mazellier, J.-P. Duguet and B. Legube, Water Res., 2008, 42, 4299 CrossRef CAS PubMed.
- S. Stucki, G. Theis, R. Kötz, H. Devantay and H. J. Christen, J. Electrochem. Soc., 1985, 132, 367 CrossRef CAS.
- C. Comninellis, Electrochim. Acta, 1994, 39, 1857 CrossRef CAS.
- H. Särkkä, A. Bhatnagar and M. Sillanpää, J. Electroanal. Chem., 2015, 754, 46 CrossRef PubMed.
- M. Panizza and G. Cerisola, Chem. Rev., 2009, 109, 6541 CrossRef CAS PubMed.
- C. A. Martinez-Huitle and S. Ferro, Chem. Soc. Rev., 2006, 35, 1324 RSC.
- B. P. Chaplin, Environ. Sci.: Processes Impacts, 2014, 16, 1182 CAS.
- S. Witzleben, et al., Private communication, 2015 Search PubMed.
- A. Fernandes, M. J. Pacheco, L. Ciriaco and A. Lopes, Appl. Catal., B, 2015, 176–177, 183 CrossRef CAS PubMed.
- M. Deborde, S. Rabouan, J.-P. Duguet and B. Legube, Environ. Sci. Technol., 2005, 39, 6086 CrossRef CAS.
- J. L. Acero, K. Stemmler and U. von Gunten, Environ. Sci. Technol., 2000, 34, 591 CrossRef CAS.
- F. J. Rivas, A. Encians, B. Acedo and F. J. Beltran, J. Chem. Technol. Biotechnol., 2009, 84, 589 CrossRef CAS PubMed.
- J. E. Forero, J. J. Duque, F. Rios and J. Diaz, CT&F, Cienc., Tecnol. Futuro, 2001, 2, 17 CAS.
- M. Umar, F. Roddick, L. Fan and H. A. Aziz, Chemosphere, 2013, 90, 2197 CrossRef CAS.
- C. L. Bianchi, C. Pirola, V. Ragaini and E. Selli, Appl. Catal., B, 2006, 64, 131 CrossRef CAS PubMed.
- F. J. Beltran, M. Gonzalez, B. Acedo and F. J. Rivas, J. Hazard. Mater., 2000, B80, 189 CrossRef.
- Y. M. Vera, R. J. de Carvalho, M. L. Torem and B. A. Calfa, Chem. Eng. J., 2009, 155, 691 CrossRef CAS PubMed.
- B. Balci, N. Oturan, R. Cherrier and M. A. Oturan, Water Res., 2009, 43, 1924 CrossRef CAS PubMed.
- N. Borras, R. Oliver, C. Arias and E. Brillas, J. Phys. Chem. A, 2010, 114, 6613 CrossRef CAS PubMed.
- D. A. Cassada, R. F. Spalding, Z. Cai and M. L. Gross, Anal. Chim. Acta, 1994, 287, 7 CrossRef CAS.
- P. K. A. Hong and Y. Zeng, Water Res., 2002, 36, 4243 CrossRef CAS.
- B. G. Ershov and P. A. Morozov, Russ. J. Phys. Chem. A, 2009, 83, 1295 CrossRef CAS.
- X. Y. Li, Y. H. Cui, Y. J. Feng, Z. M. Xie and J. D. Gu, Water Res., 2005, 39, 1972 CrossRef CAS PubMed.
- K. Turhan and S. Uzman, Desalination, 2008, 229, 257 CrossRef CAS PubMed.
| This journal is © The Royal Society of Chemistry 2015 |

