Enhancement of sludge decomposition and hydrogen production from waste activated sludge in a microbial electrolysis cell with cheap electrodes†
Received
26th April 2015
, Accepted 17th July 2015
First published on 30th July 2015
Abstract
Low hydrogen production from anaerobic digestion of sludge has greatly limited the application of biological hydrogen-producing technology. An Fe/graphite electrode was installed into an anaerobic digester to enhance the hydrogen production from waste sludge in this study. The electrode accelerated the decomposition of the sludge, and the production of short-chain fatty acids was 3.5 folds of that in a control anaerobic reactor with no electrode. The hydrogen production was 90.6 mL gVSS−1, while it was almost undetectable in the control. The results suggested that the hydrogen was produced from the cathodic reduction of H+ coupling with the anodic oxidation of sludge. The excessive consumption of the cathodic H+ drove the pH up to 9.2–9.5 in the electric-anaerobic system which inevitably inhibited the occurrence of methanogenesis. This led to quite low methane production in this electric-anaerobic system. The microbial analysis showed that exoelectrogens were enriched in the presence of an Fe electrode. It catalyzed the anodic oxidation of the sludge to produce more electrons for the cathodic hydrogen production. Raising the voltage supply boosted the H2 production, but the net energy output was obtained at 0.3 and 0.6 V.
Water impact
Waste activated sludge (WAS) is a byproduct of biological wastewater treatment. H2 production from WAS in anaerobic fermentation or a microbial electrolysis cell (MEC) is generally low due to the complexity of substrates. Thus, most of the previous studies have focused on the enhancement of H2 generation via pretreating sludge. In this study, a pair of Fe/graphite electrodes was placed into an anaerobic digester to increase the H2 production from a high-solid raw WAS. The hydrogen production was 90.6 mL gVSS−1 at 0.6 V, much higher than most reports of a sludge-based MEC. The Fe electrode enriched exoelectrogens to enhance sludge degradation, producing more electrons for cathodic hydrogen production. This was the first time that net energy was harvested from WAS in a hydrogen-producing MEC with a cheap electrode.
|
1. Introduction
Anaerobic fermentation of waste activated sludge to produce H2 has gained increasing interest. H2 (122 kJ g−1), as a clean energy carrier, is an intermediate of anaerobic digestion produced from hydrogen producing bacteria (HPB) and consumed by hydrogen consuming bacteria (HCB) such as methanogens.1,2 Biological hydrogen production from waste sludge is often quite low because waste sludge contains only a limited carbohydrate source available for HPB. No evidence indicates that the HPB are capable of direct utilization of proteins, which are one of the main components of the bacterial cell wall of sludge.3 Pretreatments, such as heat-shocking, sterilization, alkaline and acidic treatments, can break down the cells of sludge to release intracellular organic materials for utilization by HPB to increase hydrogen production. Also, the pretreatment may kill methanogens to prevent them from consuming H2. As a result, short-chain fatty acids (SCFAs), a type of raw material in the chemical industry, can also be collected4 besides hydrogen. However, all pretreatments are energy-intensive or chemical-consuming. In addition, the activity of methanogens may recover over the digestion time even if they have been inactivated before the digestion.
A microbial electrolysis cell (MEC) is promising to produce hydrogen from waste water or waste biomass. In a MEC, exoelectrogens oxidize the substrates and release an electron to the anode, and then the electron is accepted by H+ to produce hydrogen at the cathode.5,6 To overcome the energy barrier, a voltage supply (>0.2 V) is required between the two electrodes. It was reported that MECs could utilize various substrates to produce hydrogen such as domestic wastewater,6 cellulose,7 protein,8 waste sludge,9 and fermentation liquid.10 Although the hydrogen production from waste sludge might increase in a MEC, the energy efficiency is still low due to an extra voltage applied. In addition, expensive Pt is the most common cathodic catalyst in a hydrogen-producing MEC, which increases the cost of operation.
In a MEC, the anodic oxidation of organics is a bioelectrocatalytic process driven by exoelectrogens. It is well recognized that most of the exoelectrogens belong to iron-reducing bacteria11,12 which can transfer electrons from the oxidation of organics to solid mediums such as iron oxides or electrodes.13 Exoelectrogens are also capable of oxidizing complicated organics into simple ones. It was reported that the addition of iron oxides into anaerobic systems might enrich exoelectrogens and significantly enhance the anodic oxidation.14,15 In our previous study, an Fe0 rod/plate was installed into an anaerobic reactor as the anode to enhance the decomposition of organic matter.14,16 We considered that the Fe leaching from the electrode was helpful for the growth of exoelectrogens.3–18 Thus, the Fe anode was likely to accelerate the sludge decomposition through the anodic oxidation, and generated more electrons for the cathodic reduction of H+ to increase the hydrogen production.
Based on the consideration above, a pair of Fe-graphite electrodes installed in a single-chamber anaerobic digester was applied to enhance the sludge decomposition and hydrogen production from waste activated sludge. The objectives of this work are: (1) to investigate the effects of bioelectrolysis on the sludge decomposition and hydrogen production, and (2) to clarify the mechanism of hydrogen production using this cheap electrode. To the best of our knowledge, this is the first example of producing hydrogen from raw waste sludge in a MEC with cheap electrodes.
2. Materials and methods
2.1 Characteristics of the waste sludge
The waste activated sludge used in this study was obtained from the secondary sedimentation tank of a municipal wastewater treatment plant in Dalian, China. The sludge was precipitated for 24 h, and then stored at 4 °C for use. The characteristics of the waste activated sludge are shown in Table 1.
Table 1 Characteristics of the raw sludge
| Parameters |
Mean values |
SDa |
|
SD: standard deviation from triplicate tests.
|
| pH |
7.0 |
0.2 |
| TSS (total suspended solids, g L−1) |
11.8 |
0.6 |
| VSS (volatile suspended solids, g L−1) |
7.2 |
0.8 |
| TCOD (total chemical oxygen demand, mg L−1) |
12![[thin space (1/6-em)]](https://www.rsc.org/images/entities/char_2009.gif) 194 194 |
1345 |
| SCOD (soluble chemical oxygen demand, mg L−1) |
884 |
264 |
| Total protein (mg L−1) |
3511 |
212 |
| Total polysaccharide (mg L−1) |
868 |
39 |
2.2 The batch experiment
A pair of electrodes composed of an Fe tube electrode (Φ 100 × 180 mm, anode) and a graphite pillar electrode (Φ 8 × 180 mm, cathode) were inserted into a cylindrical acrylic plastic batch anaerobic reactor (Φ 110 × 250 mm) to form an electric-biological reactor (hereafter referred to as the MEC-anaerobic reactor). The working volume of the reactor was 2.0 L. The graphite pillar electrode was located in the axes of the Fe tube electrode, and they were connected to a DC power source through an electric wire. The voltage supply was fixed at 0.6 V in the first stage of the experiment. The control experiments were conducted in another anaerobic reactor, the same as the MEC-anaerobic one but without the electrodes (referred to as the reference reactor). In the second stage of the experiment, the other three MEC-anaerobic reactors were operated at 0.3, 0.6, and 1.2 V, respectively, to investigate the effects of voltage. All the reactors were fed in batch mode over the 26 days of the digestion. All the reactors were stirred at 80 rpm using magnetic stirrers. The digestion temperature was controlled at 20 °C.
2.3 Analysis and calculation
The sludge samples taken from the reactors were centrifuged at 8000 rpm for 10 min and immediately filtered through 0.45 μm pore size cellulose membrane filters for analysis of the soluble COD (SCOD), soluble protein, soluble polysaccharide and VFAs. The TSS, VSS, TCOD, and SCOD were determined according to the Standard Methods for the Examination of Water and Wastewater.19 The protein content was measured with Lowry's method using bovine serum albumin as a standard solution.20 The polysaccharide content was measured with a phenol-sulfuric acid method using glucose as a standard solution. The equivalent relationships between the COD and substrates were as follows: 1.5 gCOD per g of protein, 1.06 gCOD per g of carbohydrate, 1.07 gCOD per g of acetate, 1.51 gCOD per g of propionate, 1.82 gCOD per g of butyrate, and 2.04 gCOD per g of valerate.9 The pH was recorded using a pH analyzer (Sartorius PB-20, Germany).
Extracellular polymeric substances (EPS) of sludge were extracted using a sonication/thermal extraction process.21 The sludge was centrifuged at 6000 rmp for 10 min and then washed with distilled water. Afterwards, the sludge was resuspended in a 0.05% w/w NaCl solution and sonicated at 20 kHz for 2 min, shaken horizontally at 150 rpm for 10 min, and sonicated again for an additional 2 min. The liquor was centrifuged at 8000 rpm for 10 min to separate the solids and supernatant. The collected supernatant was regarded as the loosely bound EPS (LB-EPS). The residual sludge pellet left in the centrifuge tube was resuspended in a 0.05% (w/w) NaCl solution, sonicated for 2 min, heated at 60 °C for 30 min, and finally centrifuged at 11000 rpm for 30 min to collect the supernatant. The collected supernatant was regarded as the tightly bound EPS (TB-EPS).
The concentration of methane and hydrogen in biogas was analyzed using a gas chromatograph (Shimadzu, GC-14C) equipped with a thermal conductivity detector and a 1.5 m stainless-steel column (Molecular Sieve, 80/100 mesh). The temperatures of the injector, detector and column were kept at 100 °C, 105 °C and 60 °C.22 Nitrogen was used as the carrier gas at a flow rate of 30 mL min−1. The VFAs (acetate, propionate, butyrate and valerate) were investigated in the other gas chromatograph (Shimadzu, GC2010) with a GC-flame ionization detector, a FID (Shimadzu, Model 14B) and a 30 m × 0.25 mm × 0.25 μm fused-silica capillary column (DB-FFAP). The operating temperature for the injection port and the FID was 170 °C. The temperature in the oven was gradually increased from 100 to 130 °C at a rate of 5 °C min−1.23 Nitrogen was the carrier gas at a flow rate of 30 mL min−1.
The performance of the MEC-anaerobic reactors was evaluated in terms of the coulombic efficiency (CE), catholic hydrogen recovery (rcat) and energy recovery (ηE) as described previously:24
| | | nth = 2 × (TCODinitial − TCODfinal) × V/MO2 | (3) |
where
nCE is the number of moles of hydrogen that were recovered based on the measured current;
nth is the theoretical maximal hydrogen production based on the moles of substrate converted (or COD removal);
I is the measured current; 2 in
eqn (2) means 2 mol of electrons are needed for 1 mol H
2 production;
F is the Faraday constant (96
485 C mol
−1); 2 in
eqn (3) represents 2 mol of H
2 theoretically produced from the oxidation of 32 g of the COD;
V is the reactor volume; and MO
2 is the molecular weight of O
2 (32 g).
where
nH2 is the actual number of moles of hydrogen recovered at the cathode.
where
WH2 is the energy content of the hydrogen produced according to the heat value of hydrogen (285.83 kJ mol
−1 H
2);
WE is the electrical energy input according to
eqn (6).
where
I is the measured current, and
U is the applied voltage.
2.4 DNA extraction, amplification via the polymerase chain reaction (PCR), denaturing gradient gel electrophoresis (DGGE) and sequencing
The genomic DNA of the sample was extracted using an extraction kit (Bioteke Corporation, Beijing, China) according to the manufacturer's instructions. A primer combination of 341f/907r was used to selectively amplify the 16S ribosomal RNA sequences. A 40 base pair GC clamp was added to the forward primer at the 5′-end to improve detection of the sequence variation in the DNA fragments via subsequent DGGE.25 The 16S rDNA fragment was amplified using a PCR thermal cycler Dice (BioRad Co. Ltd., USA) using a touchdown PCR method.26 The PCR products obtained were applied in the DGGE analysis using a BioRad Dcode system (BioRad Co. Ltd., USA). A DGGE gel of 6% polyacrylamide with a linear denaturing gradient ranging from 30% to 60% (a 100% denaturing gradient contains 7 M urea and 40% formamide) was applied. Electrophoresis was conducted at a constant voltage of 180 V in a 1× TAE buffer and at 60 °C for 6 h. The gels were then stained with SYBR Gold (Dalian TaKaRa, China) in 1× TAE buffer for 40 min, after which the UV transillumination image of the gel was photographed using a Gel Doc 2000 System (BioRad Co. Ltd., USA).
Selected DGGE bands were excised and re-amplified using PCR with the aforementioned primers without the GC clamp. The PCR products were sequenced at TaKaRa Biotechnology Co. Ltd. (Dalian, China). The obtained sequences were then compared to the reference microorganisms in the GenBank database using the BLAST program.
3. Results
3.1 Sludge decomposition
The cumulative SCFA content in the control anaerobic reactor (without electrodes) increased in the initial days and then began to decrease from day 10 (Fig. 1a). Comparatively, the SCFA production in the MEC-anaerobic reactor at 0.6 V always increased during the whole digestion period (Fig. 1a). After the 26 day fermentation, the SCFA production in the MEC-anaerobic reactor was 331 mgCOD gVSS−1 or 202 mgCOD gSS−1. From Fig. 1b, after the digestion the SCOD of the MEC-anaerobic reactor was about 2.5 folds higher than that of the control. The SCFA percentage in the SCOD was up to 94.6% in the MEC-anaerobic reactor, whereas this percentage was only 80.7% in the control reactor. From Table 2, the percentage of acetate in the SCFAs was 41.0% in the MEC-anaerobic reactor, compared with 30.9% in the control reactor.
 |
| | Fig. 1 Effects of the electrodes (at a voltage of 0.6 V) on the production of SCFAs and soluble COD: (a) the cumulative SCFA yield; (b) the soluble COD. | |
Table 2 Individual SCFA concentrations and percentages
|
|
MEC-anaerobic reactor |
Control reactor |
|
|
Concentration (mgCOD L−1) |
Percentage (%) |
Concentration (mgCOD L−1) |
Percentage (%) |
| Acetate |
975 ± 38 |
41.0 |
208 ± 19 |
30.9 |
| Propionate |
414 ± 23 |
17.4 |
136 ± 11 |
20.3 |
| Butyrate |
418 ± 32 |
17.6 |
102 ± 5 |
15.2 |
| Valerate |
571 ± 20 |
24.0 |
226 ± 12 |
33.6 |
The reduction of proteins and polysaccharides could be used to assess the sludge decomposition. Fig. 2 shows the effects of electrolysis on the total protein and total polysaccharide during the 26 day digestion. The reduction rates of the total protein and total polysaccharide in the MEC-anaerobic reactor were 65.6% and 59.6%, respectively, 7.06% and 14.98% higher than those in the control reactor, respectively. The sludge flocs have a dynamic double-layered EPS structure, namely the loosely bound EPS (LB-EPS) diffused from the tightly bound EPS (TB-EPS) surrounding the cells, which is an important reason for the stable structure of the sludge.27 The content of EPS in the MEC-anaerobic reactor after the digestion was lower than that in the control reactor (Table 3). Especially, the protein content of the LB-EPS and the polysaccharide content of the TB-EPS in the MEC-anaerobic digester were 117.4 and 20.3 mg L−1, respectively, 65% and 47% less than the control reactor, respectively.
 |
| | Fig. 2 The effect of the electrodes on the decomposition of the proteins and polysaccharides in the sludge after digestion. | |
Table 3 EPS concentration after digestiona
|
|
MEC-anaerobic reactor |
Control reactor |
|
|
Protein |
Polysaccharide |
Protein |
Polysaccharide |
|
All values are expressed in mg L−1.
LB-EPS: loosely bound EPS.
TB-EPS: tightly bound EPS.
|
| LB-EPSb |
117.4 ± 6.8 |
30.9 ± 2.2 |
208 ± 7.4 |
33.6 ± 2.4 |
| TB-EPSc |
130.9 ± 4.8 |
20.3 ± 1.4 |
136 ± 3.7 |
48.8 ± 1.9 |
3.2 Hydrogen and methane production
The production of hydrogen and methane is shown in Fig. 3. After 26 days, the hydrogen production in the MEC-anaerobic reactor reached 652.2 mL, namely 90.6 mL gVSS−1, while it was almost undetectable in the control reactor. To make clear whether the hydrogen was directly produced from the electrolysis of H2O via the Fe electrode, a Fe–C electrode with a voltage of 0.6 V was inserted into water under a neutral pH. No hydrogen was detected during 26 days. It implied that hydrogen could not be produced from the Fe anode at a neutral pH in the abiotic system.
 |
| | Fig. 3 Biogas production during digestion: (a) cumulative hydrogen production; (b) cumulative methane production. | |
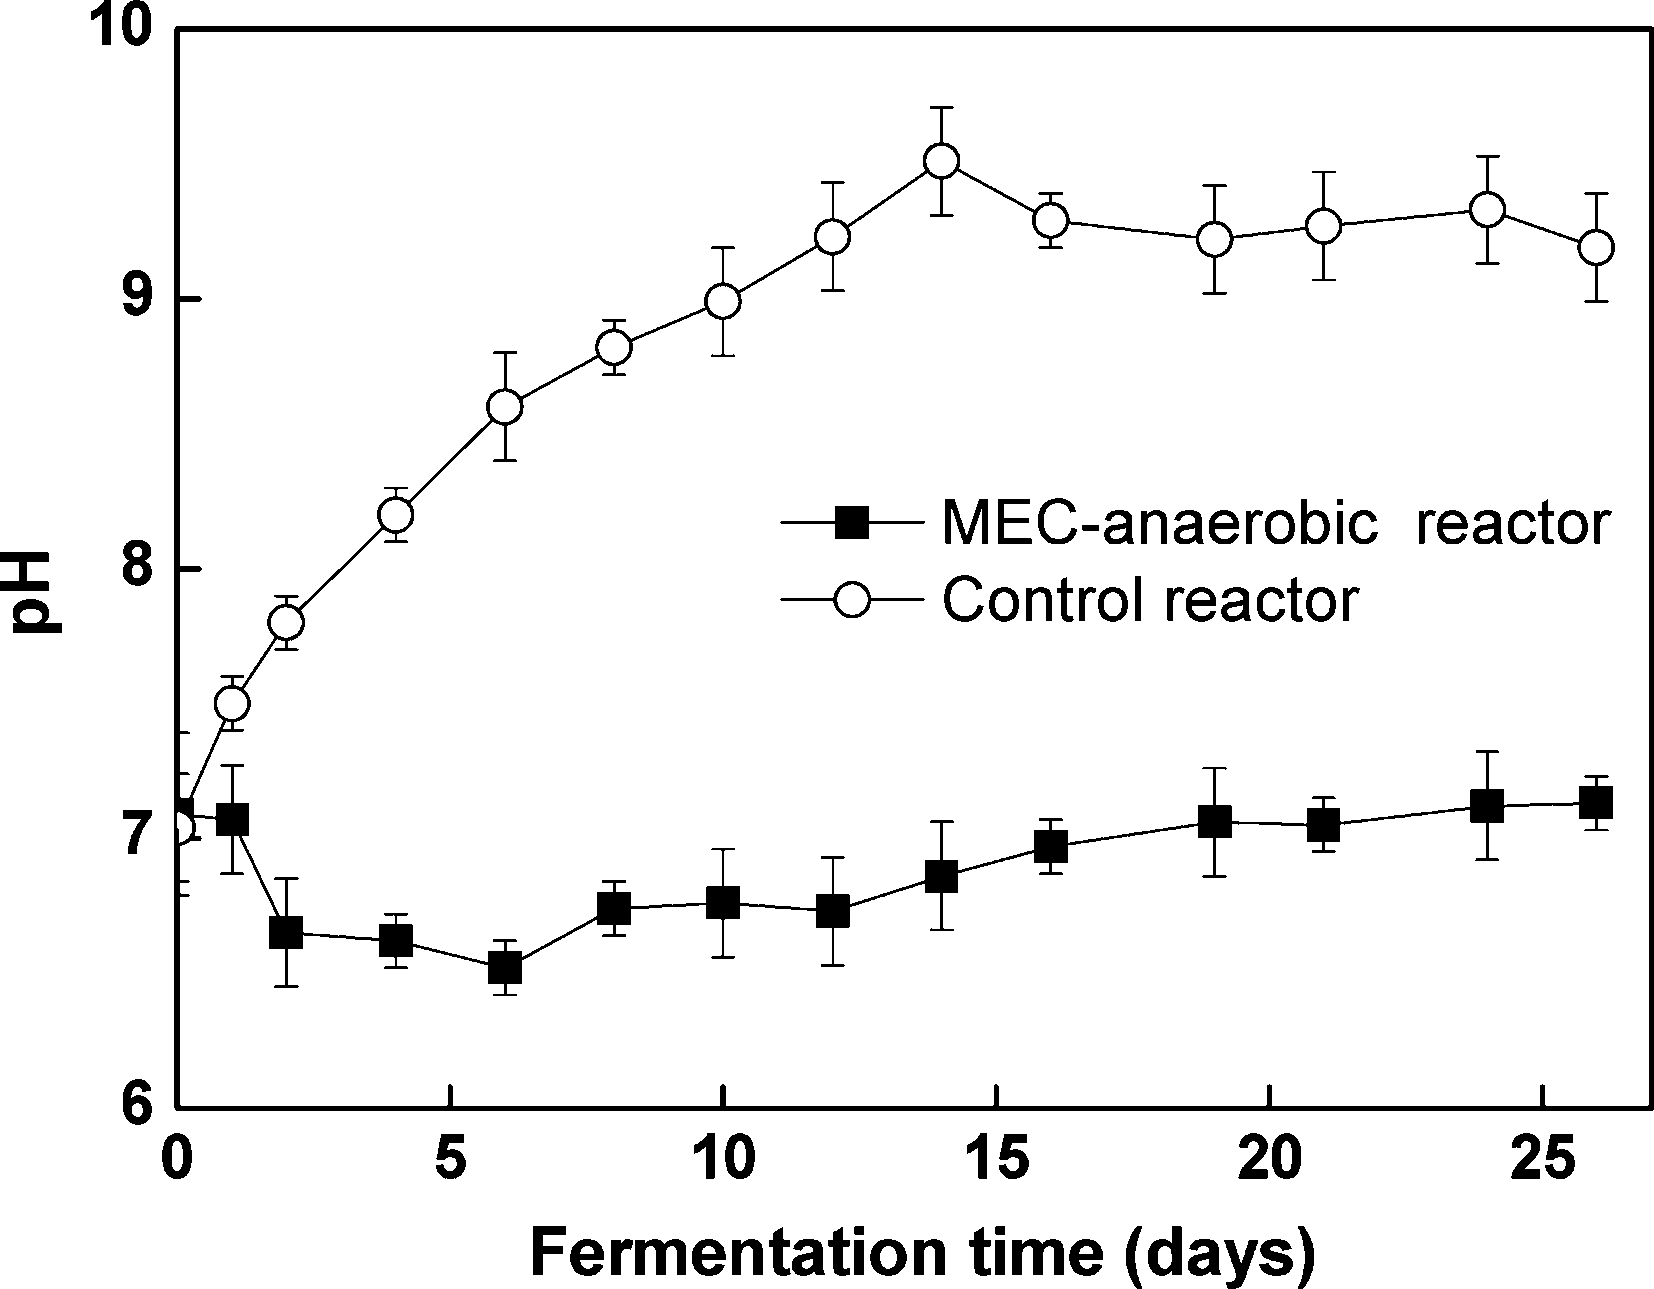
The methane production of the MEC-anaerobic reactor (22 mL) was much lower than that of the control reactor (189 mL). Moreover, the methane production of the MEC-anaerobic reactor was only observed in the initial days. From Fig. 4, the pH reached 9.2–9.5 in the MEC-anaerobic reactor after the digestion, compared with 6.5–7.1 in the control. The alkaline pH inhibited the occurrence of methanogenesis.
 |
| | Fig. 4 Variation of pH during digestion. | |
3.3 The effect of different voltages
To further investigate the effect of voltage on anaerobic digestion, the experiment was operated in the three parallel MEC-anaerobic reactors supplied with 0.3, 0.6, and 1.2 V, respectively. As shown in Table 4, SCFA and H2 yields increased with the increase of voltage. The cumulative hydrogen yield at 0.3 V after the 26 day digestion was 242.0 mL while the hydrogen production was 578.3 mL and 1896.6 mL at 0.6 and 1.2 V, respectively. With the increases in voltage, the pH increased and then the methane production decreased.
Table 4 Different characteristics obtained in this study after digestion
| Voltage |
SCFA yield (mgCOD gVSS−1) |
H2 yield (mL) |
CH4 yield (mL) |
Total protein reduction (%) |
Total polysaccharide reduction (%) |
Iron consumption (g) |
C
E
(%) |
r
cat
(%) |
η
E
(%) |
|
C
E: coulombic efficiency.
r
cat: cathodic hydrogen recovery.
η
E: energy recovery.
|
| 0.3 V |
137 |
242 |
91.0 |
56.8 |
51.8 |
3.29 |
7.7 |
37.9 |
183 |
| 0.6 V |
307 |
578 |
68.1 |
60.5 |
54.0 |
6.18 |
10.4 |
48.9 |
116 |
| 1.2 V |
505 |
1897 |
32.5 |
63.8 |
57.2 |
6.61 |
33.6 |
54.3 |
63 |
The coulombic efficiency (CE) indicated the percentage of anodic oxidation of organic matter in the total loss of organic matter, which was considered as a key parameter to assess the performance of the MEC system. The cathodic hydrogen recovery (rcat) is a parameter to represent the efficiency of conversion of the current to hydrogen. According to the current changes in Fig. S2 (ESI†), when raising the voltage from 0.3 to 1.2 V, the CE increased from 7.7% to 33.6%, and the rcat increased from 37.9% to 54.3%. The reduction rates of both the total protein reduction and total polysaccharide reduction also increased. It further proved that the voltage could enhance the anodic oxidation.
According to the electric current density and voltage supply, the calculated energy inputs were 1.56, 5.85 and 35.24 kJ for 0.3, 0.6, and 1.2 V, respectively. The energy recoveries from the increased hydrogen production were 2.85, 6.80, and 22.29 kJ for 0.3, 0.6, and 1.2 V, respectively. Therefore, the energy recoveries (ηE) were 183% (0.3 V), 116% (0.6 V) and 63% (1.2 V) (Table 4), which meant that the digestion at 0.3 and 0.6 V caused a net energy output.
3.4 Microorganism analysis
The bacterial community was analyzed after the anaerobic digestion using PCR–DGGE (Fig. S3, ESI†). Special bands were selected from the DGGE gel for sequencing to identify the major species in the sludge of digesters (Table S1, ESI†). Band 9 showed 100% sequence similarity to Ochrobactrum anthropi, which is capable of generating extracellular electrons and transferring the electrons to an electrode.28 This type of bacteria was found in the MEC-anaerobic reactor at 0.6 V and 1.2 V. This might be one reason for the higher coulombic efficiency obtained with the increase in voltage. Band 12 showed 97% sequence similarity to Rhodoferax ferrireducens, typical IRB,29 which were observed in the MEC at 1.2 V. This microorganism has been found in a MFC and has the ability to reduce the coupling of Fe(III) oxides with oxidizing organic substrates. The existence of these exoelectrogenic bacteria could enhance the oxidation of organics, and then produce electrons available for the cathodic hydrogen production.
4. Discussion
4.1 Accelerated sludge decomposition
The anaerobic fermentation of sludge is usually limited by the slow hydrolysis and acidification. From section 3.1, the results from the proteins, polysaccharides, LB-EPS and TB-EPS all indicated that the sludge decomposition was accelerated. Accordingly, the SCFA production in this MEC-anaerobic reactor was 3.5 folds of that in the control reactor, which is higher than in many reports. Yang et al. reported that the SCFA production reached 219 mgCOD gVSS−1 in the anaerobic digestion of sludge after alkaline/microwave pretreatment.30 Wang et al. recovered 305 mgCOD gVSS−1 of SCFAs in an enhanced sludge digestion system by adding polyhydroxyalkanoates and Gram-staining bacteria.31 The faster sludge decomposition was from the anodic oxidation induced by the exoelectrogens that were only detected in the MEC-anaerobic reactor. The exoelectrogens are capable of oxidizing a broad range of substrate types even including aromatic hydrocarbons, halogenated solvents and chlorinated benzenes.32
It is well-known that hydrogen accumulation during anaerobic digestion could inhibit the acetification process.33 Accordingly, acetate production should decrease with an increase in hydrogen production. However, the acetate production in the MEC-anaerobic reactor was over two times higher than that in the control reactor (Table 2). It indicated that the increased acetate production did not result from the acetification of the SCFAs. Reasonably it was presumed that the electrode installed into the anaerobic digester could directly oxidize complicated substrates into short-chain organics.
4.2 Enhanced hydrogen production
Theoretically, hydrogen might be produced via two biological pathways in this study, i.e., fermentative hydrogen production and cathodic hydrogen production. No hydrogen was detected from the control anaerobic reactor, suggesting that hydrogen was not produced from the anaerobic fermentation of sludge, possibly related to the low activity of hydrogen producing bacteria in the reactor at the alkaline pH of 9.2–9.5.34 Thus, the hydrogen production was reasonably ascribed to the cathodic reduction as shown in the following reactions:| | | Anode: sludge − ne− → simple matter (SCFA, CO2/H2O, et al.) + nH+ | (7) |
| | | 4Fe − 8e− → 4Fe2+, E = −0.44 V | (8) |
| | | Cathode: 4H+ + 8e− → 4H2, E = −0.41 V | (9) |
The pH change was just evidence for the reduction of H+ at the cathode. Almost no hydrogen in the MEC-anaerobic reactor at 0 V (data not shown) indicated that the reactions of (7) and (8), or (9) and (8) were dependent on the voltage supply. With the increasing voltage supply from 0.3 to 1.2 V, the coulombic efficiency and cathodic hydrogen recovery both increased significantly, suggesting that more substrates were decomposed via the anodic oxidation to provide more electrons available for the cathodic H2 production. As a consequence, the sludge hydrolysis and hydrogen production were boosted. Noteworthily, the voltages here were less than the typical 1.8–2.0 V required for water electrolysis. The hydrogen production was also ascribed to the inactivated methanogens at alkaline pH. The anaerobic sludge digestion at alkaline conditions decreased the activity of methanogens, which made the hydrogen accumulation possible.
4.3 Significances of this work
The MEC has been extensively explored as a promising method to produce hydrogen from wastes. However, limited documents were found directly employing waste activated sludge as a substrate. In this study, we report for the first time that the cheap Fe-graphite electrodes effectively increase the hydrogen production from raw waste activated sludge. The hydrogen production reached 90.6 mL gVSS−1 during the 26 days of fermentation in this study, which was higher than a number of reports on producing hydrogen from sludge digestion in a MEC. Guo et al. reported that the hydrogen production was 2.5 and 7.7 mL (per 1.8 gVSS) from sludge-based MECs using a Ti/Ru electrode with voltages of 1.4 and 1.8 V, respectively.35 Lu et al. harvested 63.5 mLH2 gVSS−1 from sludge using a Pt cathode.9 Sun et al. reported a maximum hydrogen yield of 52.2 mLH2 gVSS−1 from sludge using a MEC with a Pt/C catalyst used as the cathode and graphite fiber brushes used as the anodes at 0.6 V.36 Wang et al. documented hydrogen production of 95.2 mLH2 gVSS−1 from chemically pretreated sludge in a MEC with a graphite brush anode and a carbon cloth cathode covered with a Pt catalyst layer operated at 0.8 V.37 Kargi et al. obtained 96 mL HH2 gCOD−1 from sludge digestion in a MEC at 2 V with only 75% of the highest energy efficiency.38
Compared with the energy and environmental benefits, Fe loss was unlikely a problem. After the digestion, 6.18 g of Fe loss was found at 0.6 V (Table 4). If all the iron loss was produced from the chemical reaction of Fe + 2H+ = H2 + Fe2+, 2.65 L of hydrogen might be produced. The hydrogen production of this electric-anaerobic system was lower compared with the chemical H2 reaction. However, the reaction of this system was moderate and environmentally-friendly, in which the waste sludge served as an acid source instead of the dangerous chemicals (such as HCl) used in this strong chemical reaction. Also, the sludge reduction and SCFA production were obtained in this process. A part of the iron loss was precipitated with phosphate produced from breaking the cells of the sludge. Less than 5 mg L−1 of phosphate was found in the MEC-anaerobic reactor after the digestion. Comparatively, the concentration of phosphate reached 55 mg L−1 in the control reactor (Fig. S1, ESI†). It made the digested liquid more easy to handle in subsequent treatment processes.
5. Conclusion
A pair of iron-graphite electrodes significantly accelerated sludge decomposition and hydrogen production from the anaerobic digestion of raw waste activated sludge. After 26 days of fermentation, the SCFA production in the MEC-anaerobic reactor at 0.6 V of voltage supply was 331 mgCOD gVSS−1, 3.5 folds of the control anaerobic reactor. The hydrogen produced in the MEC-anaerobic reactor reached 90.6 mL gVSS−1, while it was almost undetectable in the control reactor. The hydrogen was produced from cathodic reduction, and the electron required in the hydrogen production was resulted from the anodic oxidation of sludge by exoelectrogens. The pH became 9.2–9.5 after the digestion due to the excessive utilization of H+ by the cathodic hydrogen production. The alkaline pH prevented methanogenesis from using hydrogen and then hydrogen was accumulated.
Acknowledgements
The authors acknowledge the financial support from the National Natural Scientific Foundation of China (51378087, 21177015).
References
- A. Schievano, A. Tenca, S. Lonati, E. Manzini and F. Adani, Can two-stage instead of one-stage anaerobic digestion really increase energy recovery from biomass?, Appl. Energy, 2014, 124, 335–342 CrossRef CAS PubMed.
- A. Xia, J. Cheng, L. Ding, R. Lin, W. Song, J. Zhou and K. Cen, Enhancement of energy production efficiency from mixed biomass of Chlorella pyrenoidosa and cassava starch through combined hydrogen fermentation and methanogenesis, Appl. Energy, 2014, 120, 23–30 CrossRef CAS PubMed.
- J. Massanet-Nicolau, R. Dinsdale and A. Guwy, Hydrogen production from sewage sludge using mixed microflora inoculum: effect of pH and enzymatic pretreatment, Bioresour. Technol., 2008, 99, 6325–6331 CrossRef CAS PubMed.
- B. Marko and B. Guenter, Methanation of hydrogen and carbon dioxide, Appl. Energy, 2013, 111, 74–79 CrossRef PubMed.
- S. Cheng and B. E. Logan, Sustainable and efficient biohydrogen production via electrohydrogenesis, Proc. Natl. Acad. Sci. U. S. A., 2007, 104, 18871–18873 CrossRef CAS PubMed.
- J. Ditzig, H. Liu and B. E. Logan, Production of hydrogen from domestic wastewater using a bioelectrochemically assisted microbial reactor (BEAMR), Int. J. Hydrogen Energy, 2007, 32, 2296–2304 CrossRef CAS PubMed.
- A. Wang, D. Sun, G. Cao, H. Wang, N. Ren and W.-M. Wu,
et al., Integrated hydrogen production process from cellulose by combining dark fermentation, microbial fuel cells, and a microbial electrolysis cell, Bioresour. Technol., 2011, 102, 4137–4143 CrossRef CAS PubMed.
- L. Lu, D. Xing, T. Xie, N. Ren and B. E. Logan, Hydrogen production from proteins via electrohydrogenesis in microbial electrolysis cells, Biosens. Bioelectron., 2010, 25, 2690–2695 CrossRef CAS PubMed.
- L. Lu, D. Xing, B. Liu and N. Ren, Enhanced hydrogen production from waste activated sludge by cascade utilization of organic matter in microbial electrolysis cells, Water Res., 2012, 46, 1015–1026 CrossRef CAS PubMed.
- W. Liu, S. Huang, A. Zhou, G. Zhou, N. Ren and A. Wang,
et al., Hydrogen generation in microbial electrolysis cell feeding with fermentation liquid of waste activated sludge, Int. J. Hydrogen Energy, 2012, 37, 13859–13864 CrossRef CAS PubMed.
- Y. Liu, Y. Zhang and B. J. Ni, Evaluating Enhanced Sulfate Reduction and Optimized Volatile Fatty Acids (VFA) Composition in Anaerobic Reactor by Fe(III) Addition, Environ. Sci. Technol., 2015, 49, 2123–2131 CrossRef CAS PubMed.
- D. E. Holmes, D. R. Bond and D. R. Lovley, Electron transfer by Desulfobulbus propionicus to Fe(III) and graphite electrodes, Appl. Environ. Microbiol., 2004, 70, 1234–1237 CrossRef CAS.
- D. R. Bond and D. R. Lovley, Electricity production by Geobacter sulfurreducens attached to electrodes, Appl. Environ. Microbiol., 2003, 69, 1548–1555 CrossRef CAS.
- Y. Liu, Y. Zhang, X. Quan, J. Zhang, H. Zhao and S. Chen, Effects of an electric field and zero valent iron on anaerobic treatment of azo dye wastewater and microbial community structures, Bioresour. Technol., 2011, 102, 2578–2584 CrossRef CAS PubMed.
- J. Zhang, Y. Zhang, X. Quan and S. Chen, Effects of ferric iron on the anaerobic treatment and microbial biodiversity in a coupled microbial electrolysis cell (MEC)–Anaerobic reactor, Water Res., 2013, 47, 5719–5728 CrossRef CAS PubMed.
- Y. Liu, Y. Zhang, X. Quan, H. Zhao and S. Chen, Applying an electric field in a built-in zero valent iron–anaerobic reactor for enhancement of sludge granulation, Water Res., 2011, 45, 1258–1266 CrossRef CAS PubMed.
- G. M. King, Effects of added manganic and ferric oxides on sulfate reduction and sulfide oxidation in intertidal sediments, FEMS Microbiol. Lett., 1990, 73, 131–138 CrossRef CAS PubMed.
- K. L. Straub, M. Benz, B. Schink and F. Widdel, Anaerobic, nitrate-dependent microbial oxidation of ferrous iron, Appl. Environ. Microbiol., 1996, 62, 1458–1460 CAS.
-
A. D. Eaton and M. A. H. Franson, Standard methods for the examination of water & wastewater, American Public Health Association, 2005 Search PubMed.
- B. Fr, T. Griebe and P. Nielsen, Enzymatic activity in the activated-sludge floc matrix, Appl. Environ. Microbiol., 1995, 43, 755–761 Search PubMed.
- X. Li and S. Yang, Influence of loosely bound extracellular polymeric substances (EPS) on the flocculation, sedimentation and dewaterability of activated sludge, Water Res., 2007, 41, 1022–1030 CrossRef CAS PubMed.
- Y. Liu, Y. Zhang, X. Quan, Y. Li, Z. Zhao and X. Meng,
et al., Optimization of anaerobic acidogenesis by adding Fe 0 powder to enhance anaerobic wastewater treatment, Chem. Eng. J., 2012, 192, 179–185 CrossRef CAS PubMed.
- Y. Liu, Y. Zhang, Z. Zhao, Y. Li, X. Quan and S. Chen, Enhanced azo dye wastewater treatment in a two-stage anaerobic system with Fe 0 dosing, Bioresour. Technol., 2012, 121, 148–153 CrossRef CAS PubMed.
- B. E. Logan, D. Call, S. Cheng, H. V. Hamelers, T. H. Sleutels and A. W. Jeremiasse,
et al., Microbial electrolysis cells for high production hydrogen gas production from organic matter, Environ. Sci. Technol., 2008, 42, 8630–8640 CrossRef CAS.
- B. E. Buchholz-Cleven, B. Rattunde and K. L. Straub, Screening for genetic diversity of isolates of anaerobic Fe(II)-oxidizing bacteria using DGGE and whole-cell hybridization, Syst. Appl. Microbiol., 1997, 20, 301–309 CrossRef.
- Y. Zhang, Y. Liu, Y. Jing, Z. Zhao and X. Quan, Steady performance of a zero valent iron packed anaerobic reactor for azo dye wastewater treatment under variable influent quality, Acad. J. Environ. Sci., 2012, 24, 720–727 CrossRef CAS.
- F. Ye, X. Liu and Y. Li, Effects of potassium ferrate on extracellular polymeric substances (EPS) and physicochemical properties of excess activated sludge, J. Hazard. Mater., 2012, 199, 158–163 CrossRef PubMed.
- Y. Zuo, D. Xing, J. M. Regan and B. E. Logan, Isolation of the exoelectrogenic bacterium Ochrobactrum anthropi YZ-1 by using a U-tube microbial fuel cell, Appl. Environ. Microbiol., 2008, 74, 3130–3137 CrossRef CAS PubMed.
- J. Zhang, Y. Zhang, X. Quan, Y. Liu, X. An and S. Chen,
et al., Bioaugmentation and functional partitioning in a zero valent iron-anaerobic reactor for sulfate-containing wastewater treatment, Chem. Eng. J., 2011, 174, 159–165 CrossRef CAS PubMed.
- Q. Yang, J. Yi, K. Luo, X. Jing, X. Li and Y. Liu,
et al., Improving disintegration and acidification of waste activated sludge by combined alkaline and microwave pretreatment, Process Saf. Environ. Prot., 2013, 91, 521–526 CrossRef CAS PubMed.
- D. Wang, Y. Chen, X. Zheng, X. Li and L. Y. Feng, Short-Chain Fatty Acid Production from Different Biological Phosphorus Removal Sludges: The Influences of PHA and Gram-Staining Bacteria, Environ. Sci. Technol., 2013, 47, 2688–2695 CrossRef CAS PubMed.
- Y. Zhang and I. Angelidaki, Microbial electrolysis cells turning to be versatile technology: Recent advances and future challenges, Water Res., 2014, 56, 11–25 CrossRef CAS PubMed.
- Y. Chen, J. J. Cheng and K. S. Creamer, Inhibition of anaerobic digestion process: a review, Bioresour. Technol., 2008, 99, 4044–4064 CrossRef CAS PubMed.
- Y. Wong, J. Juan, A. Ting and T. Wu, High efficiency bio-hydrogen production from glucose revealed in an inoculum of heat-pretreated landfill leachate sludge, Energy, 2014, 72, 628–635 CrossRef CAS PubMed.
- X. Guo, J. Liu and B. Xiao, Bioelectrochemical enhancement of hydrogen and methane production from the anaerobic digestion of sewage sludge in single-chamber membrane-free microbial electrolysis cells, Int. J. Hydrogen Energy, 2013, 38, 1342–1347 CrossRef CAS PubMed.
- R. Sun, D. Xing, J. Jia, Q. Liu, A. Zhou and S. Bai,
et al., Optimization of high-solid waste activated sludge concentration for hydrogen production in microbial electrolysis cells and microbialcommunity
diversity analysis, Int. J. Hydrogen Energy, 2014, 39, 19912–19920 CrossRef CAS PubMed.
- L. Wang, W. Liu, L. Kang, C. Yang, A. Zhou and A. Wang, Enhanced biohydrogen production from waste activated sludge in combined strategy of chemical pretreatment and microbial electrolysis, Int. J. Hydrogen Energy, 2014, 39, 11913–11919 CrossRef CAS PubMed.
- F. Kargi, E. Catalkaya and S. Uzuncar, Hydrogen gas production from waste anaerobic sludge by electrohydrolysis: effects of applied DC voltage, Int. J. Hydrogen Energy, 2011, 36, 2049–2056 CrossRef CAS PubMed.
Footnote |
| † Electronic supplementary information (ESI) available. See DOI: 10.1039/c5ew00112a |
|
| This journal is © The Royal Society of Chemistry 2015 |
Click here to see how this site uses Cookies. View our privacy policy here.