
Detection of trace arsenic in drinking water: challenges and opportunities for microfluidics
Nevetha
Yogarajah
a and
Scott S. H.
Tsai
*b
aRyerson University, Environmental Applied Science and Management Program, Toronto, Canada
bRyerson University, Department of Mechanical and Industrial Engineering, Toronto, Canada. E-mail: scott.tsai@ryerson.ca
First published on 1st May 2015
Abstract
Arsenic contamination of drinking water is a major global problem, with contamination in Bangladesh deemed most serious. Although the current World Health Organisation (WHO) maximum contamination limit (MCL) for arsenic in drinking water is 10 μg L−1, due to practical and economic constraints, the standard limit in Bangladesh and many other developing nations is 50 μg L−1. We propose that an ideal arsenic sensor, designed for routine monitoring, will have five essential qualities: sensitivity and selectivity for arsenic; speed and reliability; portability and robustness; reduced health and environmental risks; and affordability and ease of use for local technicians. It is our opinion that many of these characteristics can be accentuated by microfluidic systems. We describe candidate colorimetric, electrochemical, biological, electrophoretic, surface-sensing, and spectroscopic methods for arsenic detection; and comment on their potential for portable microfluidic adaptation. We also describe existing developments in the literature towards the ultimate creation of microfluidic total analysis systems (μTASs) for arsenic detection. The fundamental purpose of this review is to highlight the need for better portable arsenic contamination detection, and describe how microfluidic technology may be developed to address this need.
Water impactArsenic contamination of groundwater is an important global problem, especially in the developing world. Existing water testing methods are not suitable for routine arsenic analysis at the field level. Therefore, this review highlights current advancements in portable trace arsenic detection, with a specific focus on potential advantages conferred by microfluidic and lab-on-a-chip technology. These emerging methods may be practical alternatives for use in routine water monitoring efforts in arsenic-affected regions. |
1. Introduction to the global arsenic problem
Arsenic contamination affects regions in all corners of the world. Among others, contaminated areas include Argentina, Bangladesh, China, India, Mexico, Myanmar, Nepal, Pakistan, Vietnam, and parts of the USA (Fig. 1).1,2 Specifically, contamination of aquifers in Bangladesh is deemed most serious; consequently, a great deal of research efforts and field studies concerning arsenic contamination and mitigation have been focused on this region. | ||
| Fig. 1 Map depicting global arsenic occurrence; as indicated in the legend, arsenic-affected aquifers are highlighted in red, areas with arsenic related to mining are indicated by red dots, and geothermal waters are indicated by green dots. Reprinted from Smedley and Kinniburgh; with permission from Elsevier.170 | ||
An estimated 35–77 million Bangladeshi people, or 28–62% of the nation's population, are at risk of exposure to arsenic contaminated water.3 The arsenic epidemic in Bangladesh is described as “the largest mass poisoning of a population in history.”3,4 A prospective cohort study following almost 12![[thin space (1/6-em)]](https://www.rsc.org/images/entities/char_2009.gif) 000 Bangladeshis over the course of 10 years, from 2000–2009, reported that nearly 20% of all deaths in the nation are due to arsenic.5 In some parts of Bangladesh, arsenic levels in water are up to 2500 μg L−1; the source of this contamination is attributed to a naturally high percent composition of the element within ground sediments.1,6,7
000 Bangladeshis over the course of 10 years, from 2000–2009, reported that nearly 20% of all deaths in the nation are due to arsenic.5 In some parts of Bangladesh, arsenic levels in water are up to 2500 μg L−1; the source of this contamination is attributed to a naturally high percent composition of the element within ground sediments.1,6,7
Arsenic poisoning incurred from chronic exposure to high levels of arsenic is referred to as arsenicosis. Symptoms of this condition include skin lesions and hard patches on the palms of hands and soles of feet; skin and internal organ cancers; diseases of blood vessels in the legs; and also diabetes, high blood pressure, and reproductive disorders.5,6,8–15 Arsenicosis severity is highly dependent on the dose and number of years of exposure to arsenic.5,10,11,13,14,16–20 The current World Health Organisation (WHO) maximum contamination limit (MCL) for arsenic in drinking water, defined in 1993, is 10 μg L−1.21 This limit is based on the projected health effects of lifetime exposure to arsenic.3
In solution, arsenic is readily converted from one species to another via chemical and biological redox pathways. Since arsenic speciation determines both its bioavailability and its potency as a toxin, there is much interest in the literature for speciation studies of arsenic. Generally speaking, these studies are difficult and expensive to carry out, and so they are not ‘first response measures’. Arsenic speciation will not be extensively explored in this review. For the current status of the field, we direct you to a recent review by Chen et al.22 We find the As(III) and As(V) arsenic species to be of greatest interest for primary analyte detection because they are the most common forms of arsenic in water, and pose high toxicity to humans (Fig. 2).23
 | ||
| Fig. 2 Arsenic species that may be generated or encountered in water analyses; in order of decreasing toxicity (from left to right): arsine gas, arsenite oxoanion, arsenate oxoanion, monomethylarsonic acid (MMA), dimethylarsinic acid (DMA), and other organoarsenic species. | ||
An estimated 6–11 million tube-wells in Bangladesh need to be monitored for arsenic contamination.24 As with most of the developing world, the current arsenic standard in Bangladesh, for drinking water, is 50 μg L−1.1,25 Given the magnitude of contamination, it is not feasible for Bangladesh to adhere to the provisional WHO standard of 10 μg L−1. Furthermore, Bangladesh and India have adopted a system of painting arsenic-tested wells either green or red, to indicate ‘safe’ and ‘unsafe’ water sources respectively. Since, for arsenic, the primary mode of entry into the body is through ingestion and inhalation rather than absorption, ‘unsafe’ wells can still be used for non-consumption purposes such as washing clothes.6
Established laboratory techniques such as hydride generation atomic absorption spectroscopy (HG AAS), inductively coupled plasma mass spectrometry (ICP MS), and atomic fluorescence spectroscopy (AFS) can easily measure arsenic levels below 10 μg L−1.26–30 While highly sensitive, these techniques are bulky, expensive, and require highly trained personnel for their maintenance and operation. As an additional drawback, laboratory detection also involves labelling and shipping of samples to a central facility. Developing nations do not have the infrastructure to perform these procedures reliably and with high throughput.
In light of these issues, the WHO, the United Nations International Children's Emergency Fund (UNICEF), and other organisations use portable test kits for arsenic analysis. Over one million tube-wells in Bangladesh and India have been tested and labelled using portable arsenic test kits.31 Most kits on the market are based on the Gutzeit reaction, known since at least 1907.32 Here, colorimetric detection is based on the reaction of arsine gas with mercuric bromide embedded on a paper strip; both of these reactants are toxic and hazardous to the user. Independent studies have shown that these kits have a high rate of false negative and false positive results, and are unreliable for the determination of arsenic levels below 70 μg L−1.24,31,33,34 As a result, many people continue to drink contaminated waters from ‘clean’ sources. Furthermore, many people in these regions are still waiting for the drinkability of their water sources to be tested. The Bangladesh Arsenic Mitigation and Water Supply Program (BAMWSP), which conducted arsenic blanket testing between the years 2000–2005, is the most recent national campaign to test tube-wells for arsenic contamination.35
It is expected that 1 out of 100 people who consume water in excess of 50 μg L−1 of arsenic, will die specifically due to an arsenic-related cancer.6 The development of an arsenic sensor with the detection power of a laboratory method, and cost and convenience of a portable kit, is vital to control the number of people exposed to this pollutant. Many groups, including our own, are working on the advancement of alternate analytical methods for arsenic detection; however, a comprehensive solution is yet to be developed. To be successfully used in developing nations, we propose that a new arsenic sensor should be: sensitive and selective for arsenic, quick and reliable, portable and robust, health and environmental risk free, affordable and easy to use for local technicians.
Microfluidics is an emerging field which focuses on the development of miniaturized, integrated lab-on-a-chip (LOC) devices. In the past 25 years, there has been a surge of interest in the field as researchers miniaturize traditional macro-scale processes to micro-dimensions, and explore new aspects of science previously unseen from a macro-scale vantage point. This technology has been used by studies in a range of applications, from clinical medicine and microbiology, to electronics and the oil industry.36–39 In comparison to their macro-scale counterparts, microfluidic processes have the following advantages: faster reaction times and better process-control; reduced waste generation and reagent consumption; system compactness and parallelization; and reduced cost and disposability.
Several groups are now exploring the use of microfluidics for arsenic and other heavy metal detection. The inherent portability of microfluidics, coupled with the successful employment of LOC devices in other fields, readily lends this technology for the development of practical arsenic sensors. Here, we review the potential use of microfluidics with new and emerging analytical techniques for portable arsenic detection. While there are many reviews of existing arsenic detection techniques, to the best of our knowledge, this is the first review to present an analysis of microfluidic technology in arsenic detection.33,40–43
We first discuss existing laboratory and field methods for arsenic detection; and the challenges they face. Next, we describe what we postulate are characteristics of an ideal, routine arsenic sensor; we also give the advantages of using a microfluidic platform to effect these qualities. Then, we describe alternate emerging techniques for arsenic detection, and the role, or potential role, of microfluidics in their development. In closing, we paint a description of advancements in microfluidic technology towards the feasibility of a micro total analytical system (μTAS) for arsenic detection.
2. Current methods for arsenic detection
2.1 Laboratory methods
As cited by Bose et al., laboratory techniques that can be used for arsenic analysis include: atomic spectroscopy, mass spectrometry, neutron activated analysis, electrophoresis, chromatography, potentiometry, and voltammetry.49 Most accepted laboratory methods have a limit of detection (LOD) for arsenic on the order of 1 μg L−1 or 1 part per billion (ppb).29 All of these listed techniques can accurately perform high throughput sample analyses with good reproducibility. However, this remarkable detection power is accompanied by an upfront cost upwards of $30000 USD; not to mention the cost of maintenance, consumables, and highly trained technicians.29
Specifically, atomic absorption spectroscopy (AAS), mass spectrometry (MS), and atomic fluorescence spectroscopy (AFS) are the favoured techniques of choice used in the literature for calibration and validation of alternate arsenic detection methods.24,31,48,50Table 1 compares some general performance attributes of these chosen methods. Although these are powerful analytical tools, the high cost and maintenance associated with laboratory methods renders them unsuitable for routine arsenic monitoring in developing regions (Fig. 3).
| Detection technique | |||
|---|---|---|---|
| AAS | ICP MS | AFS | |
| 1. Limit of detection (μg L−1) | 0.0009 – 1 | 0.0003 – 1 | 0.0003 – 10 |
| 2. Reproducibility (% RSD) | <10 | <10 | <10 |
| 3. Sample size (μL) | >1000 | 2–200 | 20–200 |
| 4. Time required | ~30 minutes | ~30 seconds | ~10 minutes |
| 5. Cost (USD) | ~$60000 |
~$200000 |
~$60000 |
| 6. Skill requirement | Easy to use for a trained technician | Difficult initial method development even for a trained technician | Easy to use for a trained technician |
| 7. Data type | Ground state and resonance transition optical spectra | Mass-charge peak spectra, simpler than optical spectra | Ground state transition optical spectra |
| 8. References | 24,26,28,29,31,44,45 | 27,29,30,42,45–47 | 29,44–48 |
 | ||
| Fig. 3 Venn diagram comparing the utility of atomic absorption spectroscopy (AAS), inductively-coupled plasma mass spectrometry (ICP MS), and atomic fluorescence spectroscopy (AFS). All three of these analytical techniques can detect arsenic with very high sensitivity and selectivity; and HG AAS and ICP MS are analytical ‘gold standards’ for arsenic detection. AAS is a relatively cheaper technique than ICP MS; but involves difficult sample preparation procedures, requires larger sample volumes, and produces more complex spectra. Conversely, ICP MS is a much more expensive technique; but involves very little sample preparation, can be interfaced with upstream speciation, and produces easily read spectra. AFS detection enjoys many of the individual advantages of both AAS and ICP MS; namely relatively lower cost, and speciation ability. | ||
2.2 Portable methods
In the 1990's, an epidemic of arsenic poisoning emerged in Bangladesh as a result of widespread use of arsenic contaminated tube-wells. Tube-wells had been used in Bangladesh since the 1940's, but their widespread use did not begin until the 1970's. Over one million additional wells were added to the region to address the emergence of diarrheal disease caused by bacterial colonization of surface waters.3It was later discovered that many of these tube-wells contained arsenic contaminated water. Organisations such as the WHO, UNICEF and the World Bank unanimously decided to combat the problem. Millions of US dollars have since been invested in the development of cheap and portable field kits for arsenic detection. Many of the introduced arsenic tests were designed to comply with the Bangladeshi arsenic MCL of 50 μg L−1. Table 2 organizes different arsenic field test kits and compares selected performance attributes pertaining to their suitability as a routine test.
| Portable arsenic test kits based on the Gutzeit reaction | ||||||||
|---|---|---|---|---|---|---|---|---|
| NIPSOM | Merck | GPL | AAIH&PH | AAN | Quick As | Hach EZ | Arsenator | |
| 1. Theoretical LOD (μg L−1) | 10 | 10 | 10 | 50 | 10 | 5 | 10 | 0.5–2 |
| 2. Practical LOD (μg L−1) | >20 | >50 | >50 | >20 | ||||
| 3. Reliability | Unreliable <70 μg L−1. | Unreliable <70 μg L−1. | Unreliable <70 μg L−1. | Unreliable <70 μg L−1. | Unreliable <70 μg L−1. | Can identify samples with over 15 μg L−1 of arsenic as being over WHO limit. | Can identify samples with over 15 μg L−1 of arsenic as being over WHO limit. | Found to be correct 85% of the time. |
| Very poor correlation with labs. | More reliable at lower concentrations. | |||||||
| 4. Cost per sample (USD) | $0.40, $2.00* | $0.50–1.00, $2.00* | $0.40, $2.00* | $0.40, $2.00* | $0.40, $2.00* | $1.00–2.00 | <$1.–2.00 | $1.00, $9.00** |
| 5. Time per sample (min) | 5 | 30 | 20 | 30 | 20–40 | 20 | ||
| 6. Skills required by technician | Colour sensitivity to yellow; working quickly. | Colour sensitivity to yellow; working quickly. | Colour sensitivity to yellow; working quickly. | Colour sensitivity to yellow; working quickly. | Colour sensitivity to yellow; working quickly. | Colour sensitivity to yellow; working quickly. | Colour sensitivity to yellow; working quickly. | Ability to make accurate dilutions. |
| 7. Data type | Colour change (range) | Colour change (range) | Colour change (range) | Colour change (binary) | Colour change (range) | Colour change (range) | Colour change (range) | Digital readout |
| 8. References | 31,51 | 31,33,34,51 | 31 | 31,51 | 31,34,51 | 48 | 34,48 | 34,50,52 |
To date, over one million tube-wells have been tested using these arsenic field kits. Upon testing, wells with arsenic levels below 50 μg L−1 were painted green and the water was deemed ‘safe’ for consumption. Wells with arsenic levels above this limit were painted red and deemed ‘unsafe’; the majority of the wells tested were labelled as unsafe.31
All test kits employed in these original initiatives are based on a one-hundred-year-old method known as the Gutzeit reaction.32 The kits proceed by first reducing all arsenic in solution to the highly toxic arsine gas, and then reacting the evolved gas with mercuric bromide embedded paper to induce a colour change (Fig. 4). Upon reaction, depending on the number of –AsH2 groups that are bound to the mercury, the paper strip becomes a yellowish colour of varied intensity.
 | ||
| Fig. 4 General scheme of the modified Gutzeit reaction used by arsenic test strips; (1–4) generation of arsine gas, (5) generation of coloured As(HgBr)3.171 | ||
Reported findings indicate that the original test kits yield high frequencies of well mislabelling as either false positive or false negative; that several of the original field kits are unreliable for the detection of arsenic concentrations below 70 μg L−1; and that visual perception of “yellowness” varies greatly from person to person.31 It has even been suggested that well samples around the 50 μg L−1 threshold should be routinely re-analysed for verification of the determination.24 Others have also pointed out that during analysis, nearly 50% of the evolved arsine gas escapes to the environment before detection.33 Arsine gas is more toxic than arsenic in solution; and technician exposure to this compound is of great concern.
Studies of newer generation test kits have generally been none the more favourable. It has been concluded that none can be used to determine arsenic levels of 10 μg L−1; and that the lowest detectable arsenic concentration is 20 μg L−1.51,53 In some cases, improved accuracy has been cited with increased reaction times.54 In other cases, it has been further sought to improve the accuracy of the methods via even longer reaction times and imaging of the test strips using a flatbed scanner.55 A study from Nebraska, USA looking at the Quick Arsenic and Hach EZ kits has concluded favourably with regards to their routine use.48 Evaluating against the US Environmental Protection Agency (US EPA) standard of 10 μg L−1 of arsenic in solution, the authors have found that, largely, water samples containing 15 μg L−1 or more of arsenic were correctly identified as exceeding the MCL. Consequently, the authors suggest that these particular field kits are reliable for use in arsenic detection and remediation initiatives. We note that this is a minority point of view, as most evaluations of Gutzeit method-based field test kits conclude that the kits are unreliable for testing near the 10 μg L−1 arsenic toxicity concentration threshold.
(i) The human eye is not very sensitive to the colour yellow.
There is a large person to person variability in the detection of the degree of yellow-ness developed; this subsequently leads to discrepancies in sample classifications.
(ii) The evolved yellow colour fades with time.
Determinations must be made quickly; and, in order to be comparable to one another, must all be taken after a uniform time lapse.
(iii) Mercuric halide test strips are sensitive to hydrogen sulphide (H2S) interference.
H2S produces a black stain when bound to mercury, and thereby renders the test strip useless. Some newer methods, address this by including additional reagents to remove the sulphur interference.56
(iv) There are difficulties in working with zinc.
Zinc serves as a reducing agent in the reaction. Zinc ores naturally contain high levels of arsenic, so this may introduce error in the determination. In some cases, this issue is addressed via reduction by sodium borohydride instead.56
The usefulness of a test derives from the information it produces.34 So, if arsenic field kits cannot reliably classify a water source as either ‘safe’ or ‘unsafe’, then they do not serve the purpose for which they are were designed.
Electronic kits such as the Wagtech Arsenator drastically increase the precision of field test measurements. While one study has found Arsenator determinations to be correct 85% of the time, a separate set of researchers believe the internal calibration of the Arsenator to be poor and have developed a correction algorithm addressing this problem.50,52 The nominal working range of the Arsenator spans from 5 to 100 μg L−1, but there is poor precision above 20 μg L−1.
In recent times, there has also been a shift in the direction of research toward signal quantification by use of regular, day-to-day image producers. For example, Kearns et al. have used flatbed scanners to obtain digital images of the Hach EZ test kit; they then quantify the amount of arsenic detected by analysing the image using the computer software Colours.55 In this method, the image is deconstructed into its component RGB colour values and a calibration is developed between arsenic concentration and colour intensity. The authors report that the generation of their own arsenic calibration and the elimination of human colour subjectivity allows greater precision and reduces the frequency of false positive and false negative determinations. Similarly, Salman et al. have also used flatbed scanning to develop another arsenic detection method.57 Rather than working with an existing test kit, these authors have developed a Gutzeit method inspired spot test; they then analyse the colour intensity of the scanned image using a Visual Basic application. The method is reported to have a linear range of 2–20 μg L−1 of arsenic.
On-going efforts in our own group aim to develop a MATLAB-based code for the calibration of arsenic determinations using the Hach EZ field kit. We believe that increased portability can be afforded to the system by use of a digital camera, rather than a scanner, for the imaging of the test strip. We note that despite the ability of digital signal processing to increase precision of arsenic determinations, the analytical ability of the method continues to remain a function of the quality of the test kit itself. For example, manufacturing variability between individual test strips can have a significant effect on the reproducibility of field kit measurements.
3. Towards better arsenic detection in water
3.1 The ideal arsenic sensor
While extensive research has been invested towards portable arsenic detection, current field techniques lack the robustness and reliability required to accurately declare a water source as being ‘safe’ or ‘unsafe’. We assert that to be successfully used for mass monitoring of water drinkability, an ideal arsenic sensor must meet five essential criteria:(i) The arsenic sensor must be sensitive and selective.
Although the provisional MCL in most developing nations is 50 μg L−1, we want to have the ability to measure down to the WHO limit of 10 μg L−1. It would be desirable to quantitatively measure a range of arsenic concentrations to determine the extent of contamination. Moreover, since arsenic is a trace contaminant of water, most other potentially interfering species would be present in high excess. Therefore, we need to ensure that the sensor is selective to arsenic. Also, it is desirable to be able to differentiate the various species of arsenic, as the form in which it is present dictates its bioavailability and toxicity.
(ii) The arsenic assay must proceed quickly and yield reproducible results.
Millions of tube-wells need to be tested in regions such as Bangladesh; achieving this in practice requires an assay that can be performed in high throughput. Because most wells will be tested only once before being painted green or red, it is imperative that all sensors produce reliable and reproducible results.
(iii) The arsenic kit must be fully portable and robust enough for field use.
Preferably, the entire assay should be physically performed at the source location. Not only will this eliminate the need for complex sample labelling and handling, but more importantly it will increase local awareness about the monitoring process. For reliable use in the field, the sensor and all associated reagents/components must be robust enough to withstand harsh ambient conditions.
(iv) The arsenic detection process must reduce health and environmental risks.
The purpose of arsenic monitoring is to mitigate the development of arsenicosis and arsenic-related cancers within a population. Chemical processes in the analysis should reduce the risks of exposure by technicians and convert arsenic species to less toxic forms. Also, the testing of millions of tube-wells will generate a large volume of chemical waste; the toxicity of these waste-products should be minimized such that they do not further poison the surrounding environment.
(v) The arsenic monitoring plan must be affordable and easy to implement for the local population.
Current field kits average less than 1 USD per test.50 This is a good target price for products designed for the developing world. To be affordably implemented, the ideal field sensor should be simple enough to be directly used by the well owners themselves, or local technicians, with only very minimal training.
3.2 The merits of microfluidics
The field of microfluidics is characterised by the manipulation of small volumes of fluids, typically on the sub-millilitre scale.97 Relative to their macro-scale counterparts, microfluidic processes have the advantages of faster reaction times and better process-control; reduced waste generation and reagent consumption; system compactness and parallelization; and reduced cost and disposability.98When compared to traditional analytical techniques, microfluidic processes are known for their general advantages associated with their smaller size. This smaller size is accompanied by many virtues such as portability, enhanced resolution, better process integration, and risk mitigation. Miniaturization allows smaller reaction volumes and diffusion distances, and therefore faster reaction times. In addition, such systems are capable of both high speed and high throughput processes. This quality is quite advantageous, because in many applications, information is of little value unless it can be generated quickly. Miniaturization also reduces costs. Smaller devices have lower material and waste disposal costs. This reduces the environmental footprint of the analysis. Faster reactions also have lower opportunity costs and personnel costs.
In light of these advantages, there have been a surge of microfluidic developments for the advancement of biotechnology. However, much of this research can also be adapted for environmental and other applications. The potential portability of microfluidics coupled with the successful employment of LOC devices in other fields readily lends this technology for the development of practical arsenic sensors. Several groups are exploring the use of microfluidics for the detection of arsenic and other heavy metals.
4. Candidate methods for microfluidic arsenic detection
Given the challenges associated with reliable and affordable arsenic monitoring using current detection methods, much research has been devoted to developing alternate methods for arsenic detection. In the following sections, we highlight some of these candidate methods. We compare the performance of these methods against the criteria for the ideal arsenic sensor outlined in section 3.1, and we comment on the methods' suitability for microfluidic adaptation. Table 3 organizes characteristics of each candidate arsenic detection method with regards to the criteria for an ideal sensor.| Characteristics of an ideal arsenic sensor | ||||||
|---|---|---|---|---|---|---|
| Sensitive and selective | Quick and reproducible | Portable and robust | Low health and environmental risks | Affordable and easy | References | |
| Colorimetric methods | ||||||
| Molybdenum blue (PFI) | -LOD: 1–15 μg L−1 | -Detection time: >30 min | -Not portable; bulky instrument | -Toxic AsH3 gas generated | -Expensive | 58–60 |
| -Selective over P, Si | -Good reproducibility | -Requires some specialized skills | ||||
| Molybdenum blue (pKa effects) | -LOD: 4–8 μg L−1 | -Detection time: 7–10 min | -Potentially portable | -Yes; As always remains in solution | -Yes | 61,62 |
| -Only 20% accuracy at low concentrations | ||||||
| -Selective over P | ||||||
| Molybdenum blue (ethyl violet) | -LOD: 10–25 μg L−1 | -Detection time: ~30 min | -Potentially portable | -Yes; As always remains in solution | -Yes | 63,64 |
| -Interference from P, Si, F | ||||||
| Methylene dye | -LOD: 10–100 μg L−1 | -Detection time: ~ 6 min (micelle mediated) | -Potentially portable | -Generation of toxic AsH3 gas; but always remains in solution | -Yes | 65–67 |
| Sulfanilic acid - NEDA | -LOD: 18 μg L−1 | -Detection time: ~30 min | -Portable | -Yes; As always remains in solution | -Yes | 68 |
| -Selective over P | -Must prevent exposure to air | |||||
| Paper based | -LOD: 1 μg L−1 | -Yes | -Yes | -Yes | -Yes | 69 |
| -Selective over P | ||||||
| Electrochemical methods | ||||||
| ASV (traditional) | -Sensitivity on the order of ng L−1 | -Require sample pre-dilution and electrode surface regeneration | -Not robust; electrodes are fragile | -Yes; As always remains in solution | -Expensive to fabricate electrodes | 43,70–72 |
| -Interference from Cu | -Require very small volumes of sample | -Relatively simple procedure | ||||
| ASV (enzyme-modified) | -Sensitivity on the order of μg L−1 | -Detection time function of enzyme metabolic rate | -Not robust; electrodes are fragile | -Yes; As always remains in solution | -Expensive to fabricate electrodes | 73–75 |
| -Tolerant of Cu | -Detection of bioavailable As | -Require very small volumes of sample | -Relatively simple procedure | |||
| SPE | -Sensitivity on the order of μg L−1 | -Detection time function of enzyme metabolic rates | -Yes | -Yes; As always remains in solution | -Yes | 76,77 |
| -Tolerant of Cu | -Detection of bioavailable As | -Require very small volumes of sample | ||||
| Biological methods | ||||||
| Strip based | -Sensitivity on the order of μg L−1 | -Detection time function of enzyme metabolic rates | -Strips are portable | -Yes; as always remains in solution | -Yes | 78–81 |
| -Very selective for As | -Detection of bioavailable As | -Sensitive to ambient conditions | -Require very small volumes of sample | |||
| Continuous flow microfluidics | -Sensitivity on the order of μg L−1 | -Detection of bioavailable As | -Potentially portable | -Yes; as always remains in solution | -Disposable | 78,82–85 |
| -Very selective for As | -Must normalize amount of bacteria present | -Require pumps, microscopes, refrigeration, etc. | -Require very small volumes of sample | -Requires some specialized skills | ||
| -Sensitive to ambient conditions | ||||||
| Electrophoretic methods | ||||||
| ITP | -Sensitivity on the order of mg L−1 (conductivity detection) | -Detection time: <10 min | -Potentially portable | -Yes; As always remains in solution | -Requires some specialized skills | 86,87 |
| -Selective over Se | -Require pumps, microscopes, etc. | -Require very small volumes of sample | ||||
| -Interference from NO3−, CO32−, PO43− | ||||||
| CE | -Sensitivity on the order of μg L−1 (AFS detection) | -Detection time: <1 min | -Require pumps, etc. | -Yes; As always remains in solution | -Expensive | 88 |
| -As(III)/As(V) resolution | -AFS is not portable | -Require very small volumes of sample | -Requires some specialized skills | |||
| Surface sensing methods | ||||||
| SPR | -LOD: 1–15 μg L−1 | -Yes | -Potentially portable | -Yes; as always remains in solution | -Disposable | 89–91 |
| -Selective over P | -Require pumps, microscopes, etc. | -Require very small volumes of sample | -Fabrication of modified surfaces is difficult | |||
| -Requires some specialized skills | ||||||
| SERS | -LOD: 1 μg L−1 | -Yes | -Some Raman spectrometers are portable | -Yes; As always remains in solution | -Expensive | 92 |
| -Very selective for As | -Require very small volumes of sample | -Relatively simple procedure | ||||
| -As(III)/As(V) resolution | ||||||
| Spectroscopic methods | ||||||
| LIBS | -LOD: 100 μg L−1 | -Must allow time for As adsorption to substrate | -Potentially portable | -Yes; do not evolve toxic AsH3 gas | -Very simple setup | 93 |
| XRF | -LOD: 0.7 μg L−1 | -Must allow time for As adsorption to substrate | -Some XRF detectors are portable | -Yes; do not evolve toxic AsH3 gas | -Very simple setup | 94,95 |
| CL | -LOD: 2 μg L−1 | -Reaction time: ~1 min | -Yes | -Toxic AsH3 gas generated | -Relatively simple procedure | 96 |
| -Results agree well with ICP MS data | ||||||
4.1 Colorimetric methods
Colorimetric methods are desirable for portable arsenic monitoring because they have very simple detection. As with the traditional field kits, detection can be carried out by the human eye; or digital imaging can be used for more sophisticated analyses. An advantage of colorimetry with respect to field determinations is that several digital detection equipment are already easily portable; for example, a camera, a UV–Vis spectrometer, or a smartphone can be used as a digital detector. | ||
| Fig. 5 Basic scheme of the molybdenum blue reaction for arsenic detection.172 Arsenic and molybdenum in solution react to form an α-Keggin arsenomolybdate heteropolyacid, which, when reduced, forms a coloured β-Keggin product. | ||
One approach against such interference effects is to couple the molybdenum blue reaction with pervaporation flow injection (PFI) of the arsenic sample. PFI can be used to selectively remove arsenic out of solution in the form of arsine gas, for analysis; while phosphates and silicates are not volatilized and hence remain in solution.58–60 While these methods have approximate arsenic LODs in the range, 1–15 μg L−1; PFI is not suitable for portable adaptation due to the bulkiness of instrumentation, requirement for high temperatures, and complex sampling handing steps.
Another method to overcome phosphate interferences in this reaction is to take advantage of the different protonation states of penta- (pKa ~ 2.2) and trivalent (pKa ~ 9.2) species in solution.61 Penta- and trivalent species can thus be separated and analysed independently.61 The sample can also be assayed as two aliquots, once with all species in the pentavalent form and once with all species in the trivalent; the total arsenic content can be correlated to the difference of the two measurements.62 Both of these approaches can detect arsenic with an LOD of approximately 4 to 8 μg L−1; an additional advantage being that ion separation has the potential to be carried out microfluidically using on-chip electrophoretic or chromatographic techniques. (See sections 4.4 and 5.1).
Due to the low molar absorptivity of molybdenum blue, arsenic detection by this reaction generally calls for spectrophotometric detection. Heteropoly blue has a low molar absorptivity (1 × 10⁻⁴ L mol−1 cm−1) rendering direct quantification of the reaction by visual inspection quite difficult for environmental samples.64 However, by complexing the heteropoly blue to an organic dye, Morita and Kaneko have developed a molybdenum-based assay for arsenic detection by visual inspection (Fig. 6).63,64 In this approach, interference effects are removed by anion exchange and masking agents; and then, following the classical reaction, the molybdenum blue product is induced to form stable, coloured micro particles by reaction with cationic ethyl violet dye. This method has a LOD of 25 μg L−1 for arsenic. In a second reaction, the authors use iodine tetrachloride as a ‘probe’ for the molybdoarsenate particles and achieve a final arsenic LOD of 10 μg L−1.
 | ||
| Fig. 6 Visual detection of arsenic in solution using molybdenum chemistry. Left: Arsenic detection by formation of coloured micro particles via reaction of molybdoarsenates with ethyl violet dye. Adapted from Morita and Kaneko, with permission from the Japan Society for Analytical Chemistry.64 Right: Ultra-sensitive arsenic detection via iodine-tetrachloride probing for molybdoarsenate micro particles. Adapted with permission from Morita and Kaneko; copyright (2006), American Chemical Society.63 | ||
Since detection is based on visual observation, the Morita and Kaneko reaction is well suited for the field. Also, as the reaction proceeds by passive flows, the required mixing steps can be easily implemented on-chip. On-going efforts in our own lab aim to develop a portable microfluidic adaptation of this assay. We have found that the macro-scale reactions achieve colour stability with a time scale on the order of hours; the reduced diffusion distances of a microfluidic adaptation is expected to make this reaction much faster.
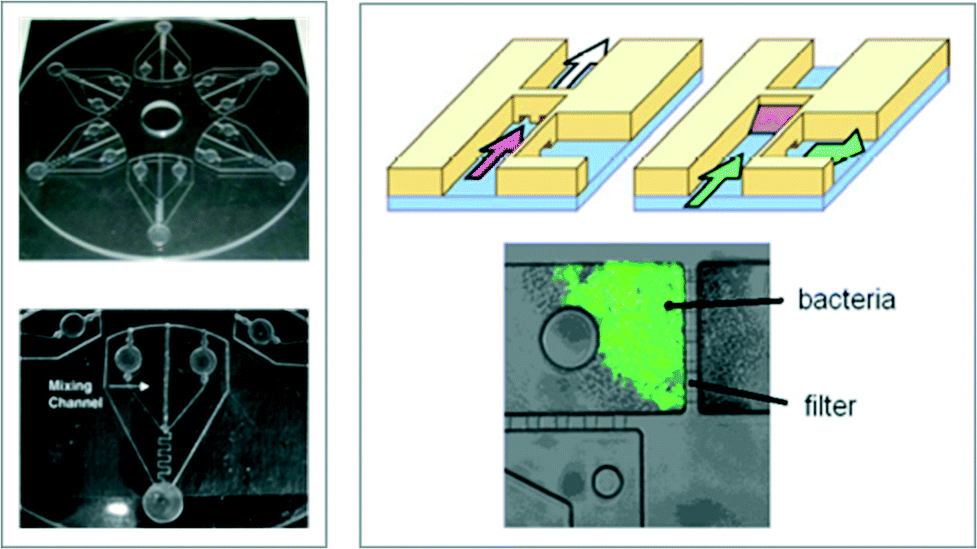
Unlike in traditional field kits, the arsine gas evolved by these methods remains in solution throughout the entire analysis, thereby reducing the risk of exposure to the technician. Further, microfluidic adaptations can be developed for both of these approaches. Typical microfluidic channel widths are on the order of 100 μm. This small size of microfluidic devices makes them suitable to manipulate the kinetics of nano-scale micelle formation. Also, with regards to the toluene extraction, a microfluidic liquid-liquid extraction protocol can be adapted from, for example, the work of Wagli et al. for cocaine extraction from saliva (Fig. 7).100
 | ||
| Fig. 7 Schematic diagram of a microfluidic setup for on-chip liquid-liquid extraction of cocaine out of saliva. Top: 3D schematic diagram of a microfluidic chip. Right to left: Cocaine containing saliva enters the chip and is introduced to droplets of the extraction solvent. Cocaine particles partition into the extraction media. The cocaine-containing droplets are then drained out of suspension and merged together. Bottom: Perpendicular cross-sections illustrating the extraction process along the length of the channel. Reprinted with permission from Wagli et al.; copyright (2013) American Chemical Society.100 | ||
A microfluidic improvement of the paptode approach may result in improved reaction times by means of reduced diffusion distances and also active mixing. Since sulfanilic acid and NEDA do not react in the absence of arsenic, they can be premixed before on-chip mixing with arsenic. In these approaches, due to the three dimensional nature of microfluidic chips, image acquisition can no longer proceed via a scanner. Rather, a photograph of the chip may be obtained, and then analysed via similar MATLAB-type software signal quantification.
Nath et al. have developed a portable paper-based sensor for arsenic detection, by reaction with modified gold nanoparticles.69 Their rapid, ultrasensitive Y-shaped design is specific for As(III), and can detect arsenic concentrations down to 1 μg L−1. The authors propose the use of the modified gold nanosensor, Au–TA–TG, which binds to As(III) to produce a black-blue precipitate at the interface where the two species interact (Fig. 8). In addition to low cost and portability, the technological advantage of having a paper substrate in this system is the facilitation of a slow, self-driven flow of the sample and nanosensor flows; which in turn allows for their reaction.
 | ||
| Fig. 8 Schematic diagram of an ultrasensitive arsenic μPAD. Arsenic containing solution and a modified gold nanosensor are allowed to wick up the arms of a Y-shaped chromatography paper device. Upon meeting at the junction, the two solutions react to form a dark, black-blue precipitate that is indicative of the presence of arsenic in the test sample. The amount of precipitate formed can then be related to the amount of arsenic originally present in solution. Reproduced from Nath et al.69 | ||
Paper-based techniques are quickly gaining traction in heavy metal detection in both water and air samples.102,103 For example, a patterned paper device has been developed for the simultaneous detection of several common metal ions in water (Fig. 9).102 Here, channels are delineated by a wax-printed pattern, and metal responsive reagents are inkjet deposited into defined zones within this pattern. During analysis, the water sample is added to the detection zone, and the device is placed upright into a chromatography chamber. The reaction proceeds as water is wicked up through the device by capillary action, and carries the deposited reagents to their respective reaction zones.
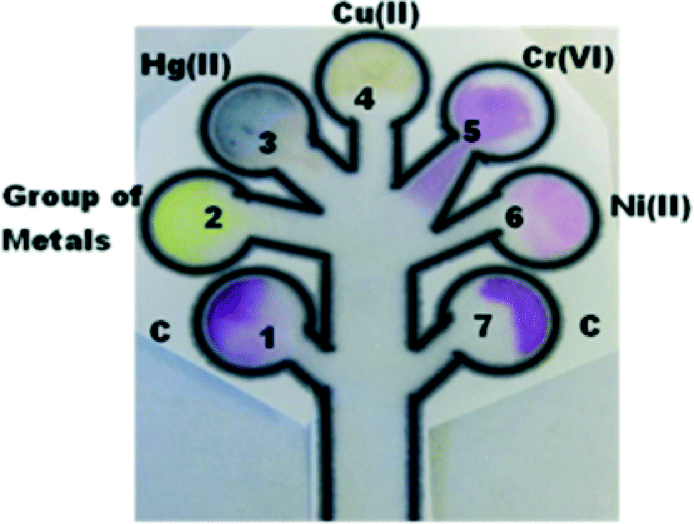 | ||
| Fig. 9 A μPAD for the simultaneous detection of multiple metal ions in water. The device is fabricated by wax-printing of the channel design and inkjet printing of chromogenic agents onto locations 1–7. During analysis, contaminated water samples are introduced to the circular testing regions and the device is placed into a chromatography chamber; the chromogenic reagents are then moved into these regions by the upwards capillary action of deionized water in the base of the chamber. Reprinted with permission from Hossain et al.; copyright (2011) American Chemical Society.102 | ||
A particular advantage of this design is the ability to simultaneously test for the presence of several different metals. The different reaction zones may alternately also be used to generate a real-time calibration using known standards at the same time as the measurement of unknown samples. The simultaneous analysis of samples and standards together corrects for ambient variations. In section 5.2, we further describe in why paper-based sensing may become a desirable route for arsenic well-testing.
4.2 Electrochemical methods
Electrochemical detection methods have an inherent advantage over colorimetry with regards to miniaturization. The output of a colorimetric measurement is the absolute amount of an analyte in solution; so the smaller the sample size is, the more difficult the measurement. The output of an electrochemical measurement is the concentration of an analyte in the solution; this is independent of the size of the sample measured. In electrochemistry, smaller samples yield more accurate determinations due to higher surface-area-to-volume ratios of the electrochemical probe, and lower interference effects from other species in solution. For this reason, there is a trend in analytical chemistry and arsenic sensing towards the development of miniaturised electroanalytical systems.104 Although electrochemical systems do not employ microfluidic flows in the classical sense, we have included them in this review due to the benefits conferred to them by miniaturisation.Typically, electrochemical detection techniques have very high sensitivities, with LODs on the order of ng L−1 of arsenic in solution. Since arsenic contamination of water sources is typically on the order of μg L−1, sometimes protocols call for the pre-dilution of real samples before analysis.71 However, this introduces additional errors into the measurement.
When measuring arsenic, many electrochemical techniques suffer from copper interferences due to co-deposition of the two species on the electrode surface.43,72 To overcome this issue and increase arsenic selectivity, some groups have developed arsenic-respondent enzyme modified electrodes.73–75 In these systems, the electrode measures enzyme activity, and this is correlated to the amount of arsenic present in solution. As with any biological application, a major drawback to this approach is the question of whether the enzyme activity is a true function of the total arsenic in solution, or if it measures only the bioavailable arsenic.
Although several microelectrodes and electrode arrays have been designed for arsenic detection, these devices are not suitable for implementation on the field. This is because electrochemical devices are inherently not robust. Electrode fragility and the need to regenerate the sensing surface between measurements render these systems ineffective outside of the controlled environment of a laboratory. Furthermore, typical electrodes consist of highly polished inert metal. Accordingly, they are expensive to fabricate and are not effective in disposable devices.
4.3 Biological methods
Biological detection methods developed for arsenic have been mostly based on the arsR bacterial operon. To easily measure the presence of arsenic, the bacteria are modified by plasmid transformation and the arsR operon is reconstructed to also include a reporter gene (Fig. 10). Common reporter proteins include green fluorescent protein, luciferase, and β-galactosidase. Measurements of these arsenic-induced products allow LODs on the order of 1 μg L−1 of arsenic. A major advantage of biological sensing is high assay selectivity for the analyte of interest. For a detailed discussion of various bioassays for bacterial detection of arsenic we refer you to the 2009 review by Diesel et al.78 Below, we restrict our discussion to focus only on those biological sensing systems that have been engineered portably. | ||
| Fig. 10 General mechanism of the arsR bacterial operon for arsenic detection. Top: When arsenic is absent, the ArsR repressor protein binds the operator promoter site of the gene and prevents the transcription of arsenic defense genes (arsD, arsC, arsA, and arsB) further downstream. When arsenic is present, ArsR loses its affinity to the operator and no longer binds the promoter site; so RNA polymerase is able to transcribe the arsDCAB genes. ArsD is an additional regulatory protein, ArsC is an arsenate reductase that converts As(V) to As(III); ArsAB is a membrane transporter that pumps As(III) out of the cell. Bottom: Arsenic reporter strains have an additional gene construct of the arsR promoter region fused to a reporter gene. When arsenic is sensed by the cell, ArsR will unbind and the reporter gene will be transcribed and translated; detection of the reporter protein is an indication of the amount of arsenic that is sensed. Reprinted from Diesel et al., with kind permission from Springer Science and Business Media.78 | ||
Furthermore, similar to the Arsenator, the ArsoLUX is a portable digital system for bioluminescence detection.81 During analysis, the arsenic water sample is introduced into a vial containing live, lyophilised bacteria which have the lux reporter gene; a luminosity measurement is then taken 10 seconds after sample introduction. The overall method is quick and sensitive for arsenic, but is accompanied by a start-up cost of 4000 €. Field tests in Vietnam have shown that the ArsoLUX has performance comparable to the Arsenator and Merck field kits, but with considerably fewer steps and less reagent consumption.81
A PMMA compact disk microfluidic biosensor has been designed by Rothert et al. to achieve sample flow and mixing by centrifugal force.82 Typical microfluidic geometries require external pumps for sample introduction onto the chip. Here, on-chip sample introduction is achieved by the outward centrifugal force generated by spinning the disk-shaped design (Fig. 11). After mixing, the bacterial GFP response is then detected by fluorescence microscopy. We note that use of a large enough product collection reservoir will further increase the portability of this system, by allowing for fluorescence imaging by a regular camera.
 | ||
| Fig. 11 Two microfluidic geometries used in biological arsenic sensors. Left: Compact disc microfluidic arsenic sensor with six reaction zones; a close-up of one reaction zone is also shown (bottom). There are two reagent reservoirs at the inner region of the disc (one for the bacteria, and the other for the arsenic solution), a mixing channel with outward fluid flow driven by the centrifugal force, and a collection reservoir at the end of the channel for fluorescence detection. Reprinted from Rothert et al., with permission from Elsevier.82 Right: Schematic of a microfluidic sensor with a bacteria filter (top), and a fluorescence image of bacteria that have sensed arsenic (bottom). Reprinted from Theytaz et al., with permission from Elsevier.83 | ||
A more conventional example of a continuous flow microfluidic set-up consists of a closed, single use chip.83 Theytaz et al. propose such a channel geometry which includes a filter to immobilise bacteria while the arsenic solution flows through. The captured bacteria are then exposed to the arsenic solution for a fixed amount of time, and then the response is quantified. While the technique can identify a 50 μg L−1 arsenic threshold, it does not have adequate sensitivity to discern 10 μg L−1 of arsenic from a blank solution. As with the compact disk design, arsenic detection proceeds by whole cell bacterial sensing with a GFP reporter protein (Fig. 11).
In order to achieve signal reproducibility, it is imperative to use equal amounts of sensing bacteria for each measurement. To address this, microfluidic cartridges have been designed to consistently hold a constant amount of bacteria (Fig. 12).84 Originally, these methods involved first encapsulating arsenic-responsive E. coli in 50 μm diameter agarose beads, and then capturing these beads within a 500 × 500 μm microfluidic cage. The chips and beads are then exposed to arsenic solutions for detection. Signal reproducibility arises from the fact that the amount of bacteria in each bead and the number of beads trapped in each experiment are the same. The assay, based on the GFP reporter, can discriminate 10 and 50 μg L−1 from the blank with an incubation period of 1 hour. By reducing the spacing of the cage walls, applications of the microfluidic cage have been extended to also capture individual cells and bacterial spores for arsenic detection.85 Recently, Truffer et al. have developed an automated, electronic sampling and monitoring device to quantitate the fluorescence signal from biosensors similar to those in Fig. 12.116
 | ||
| Fig. 12 Schematic diagram of a microfluidic arsenic sensor with a cage for bacterial capture. In the far right is an image of a microfluidic cage that has captured agarose beads containing bacteria. Adapted from Buffi et al.84 | ||
Bacterial metabolic rates are sensitive to ambient conditions, so it is not possible to normalise bioassay measurements taken at different times to a pre-calibrated curve. It is crucial that only those measurements taken under the exact same conditions are compared. As exemplified in the bioassay examples in Fig. 11 and 12 microfluidic devices can perform multiple determinations in parallel. Therefore, these geometries facilitate simultaneous analysis of a sample with replicates, or a sample with standard additions, or a sample with calibration standards. Despite these advantages of bacterial microfluidic arsenic sensing, there are several inherent challenges associated with working with biological systems. A large issue is the maintenance of cellular activity and proliferation under ambient conditions. Biological responses are very sensitive to ambient stress factors such as heat, pressure, presence of oxygen, water availability, and nutrient availability. Although lyophilised and refrigerated cells can maintain their activity for prolonged periods, it is difficult and costly to maintain refrigeration of cells during transport and when working in the field. Another factor to consider is the total assay time. Unlike other diffusion-limited approaches, miniaturization of biological processes cannot significantly improve reaction times. The observed ArsR signal results from the cell detecting the presence of arsenic and then undergoing subsequent transcription and translation processes to produce a measurable protein product. This entire process is limited by the metabolic rate of the cell. Furthermore, as already mentioned, it is unknown whether the biological assay is measuring the total arsenic that is present in solution, or only the bioavailable amount.
4.4 Electrophoretic methods
Electrophoresis is the movement of particles in solution under the influence of an electric field. Although it is most commonly used for the separation and purification of biological compounds such as nucleic acids and proteins; electrophoresis can be effectively used for the separation of any charged species in solution. In the 1990s, it was realised that the coupling of electrophoresis to microfluidics is quite advantageous for a number of reasons.117 Importantly, microfluidic flows allow easy handling of small volumes and microfluidic chip separation avoids the need for long, tangled electrode wires. Furthermore, small scale microfluidic separation is much quicker than the long hours that are usually required for traditional electrophoretic techniques.118Fig. 13 illustrates two microfluidic geometries for electrophoretic detection of arsenic, using isotachophoresis and capillary electrophoresis. | ||
| Fig. 13 Schematic diagrams of microfluidic geometries for electrophoretic determination of arsenic. Top: Miniaturised separation device for Isotachophoresis (ITP) with conductivity detection. Letters A–E refer to fluid inlets and outlets, and related valves. The arsenic containing sample is introduced as a plug between the leading and tailing electrolytes (LE, TE). Reproduced with kind permission from Springer Science and Business Media.87 Bottom: Chip-based capillary electrophoresis (CE) integrated with AFS detection. Numbers 1–7 refer to fluid inlets and outlets, and reservoirs. The chip-to-AFS interface consists of a ‘tube-in tube’ design. Reprinted from Li et al., with permission from Elsevier.88 | ||
These methods also have very poor conductivity-based LODs that are on the order of mg L−1 of arsenic in solution; this can potentially be improved microfluidically. In addition to sample separation, ITP systems can be used for sample focusing and pre-concentration. Notably, a shallow channel ITP-μPAD, capable of up to 1000-fold sample enrichment, has very recently been developed.120 Cheap, easy to manufacture, and easy to use, the wax printed device shows good promise for portable arsenic pre-concentration. Further, the technique may alleviate the current sensitivity barrier for conductivity detection.
While AFS is not a suitable field detection method, this system can be microfluidically employed on the field if coupled to a secondary assay downstream of the As(III)/As(V) separation location. For example, any of the portable arsenic sensors described in this review (see section 4) would work for this purpose. This ability to facilitate the integration of several different functional modules is an important advantage of microfluidic technology. Conceivably, the need for AFS analysis can be eliminated by coupling the separation to any of the secondary assays described in this review.
4.5 Surface sensing methods
The electronic properties of metallic surfaces can be exploited in analytical processes to facilitate detection. Two such methods include surface plasmon resonance (SPR) and surfaced-enhanced Raman spectroscopy (SERS). Both of these techniques can be engineered as on chip processes; this microscale implementation lends SPR and SERS technology as favourable platforms for portable arsenic detection.Arsenic is strongly bound by sulphur-containing groups; a single arsenic atom can chelate up to three sulphurs at one time. This interaction has been exploited by chelation therapies for arsenicosis that use sulphur-containing agents.122 This chelation property has also been exploited for arsenic detection by use of gold nanoparticles that have surface modifications with sulphur-containing compounds.123 In the presence of As(III), the gold particles aggregate together due to chelation of the sulphur atoms in the surface groups, and the solution changes in colour from red to blue.
Furthermore, a label-free SPR detection method has been developed using the sulphur-containing phytochelatin-like peptide, PC3R.121 When unmodified gold nanoparticles and PC3R are mixed in the absence of arsenic, the gold is chelated by the peptide and aggregates are formed. When As(III) is present in the solution, it chelates the peptide and the nanoparticles become mono-dispersed; the solution changes in colour from blue to red. In addition to peptides, DNA aptamers can also be used for label-free gold nanoparticle assays for arsenic detection.89,90
With optical detection, gold nanoparticle-based arsenic assays have LODs as low as 0.015 μg L−1 and linear dynamic ranges spanning up to six orders of magnitude.123 While still powerful, these assays only have a visual LOD of about 5–15 μg L−1. The SPR effect can also be used to look at binding interactions, as the resultant increase in mass causes a shift in the observed resonance angle.
Gold nanoparticles are very expensive. Thus, it is natural to use microfluidic geometries to perform these assays, as microfluidics require only small volumes of consumables. Commonly, SPR is carried out using flow injection (FI) geometries where a flow is used to transport the analyte in solution across the sensing surface. Microfluidics has proven to be a very suitable platform for this type of analysis. Some microfluidic SPR applications include molecular detection and biosensing, affinity analyses, and adsorption thermodynamics.124–131
As an adaptation of biotechnological microfluidic-SPR advancements towards an environmental application, Forzani et al. have developed a microfluidic SPR device for total arsenic detection from groundwater (Fig. 14).91 Their differential SPR sensor is functionalised with an inert modifier as the reference surface and an arsenic-recognizing element as the sensing surface. Based on the SPR band shift between the two regions, the device can classify solutions as having more or less than 10 μg L−1 of arsenic. The system can detect arsenic levels even less than 1 μg L−1 in pure buffer, but does not exhibit the same sensitivity in real samples due to matrix interferences.
 | ||
| Fig. 14 SPR sensor for arsenic detection. A: Schematic of SPR sensor and incident laser beam. B: Arsenic-induced SPR shift generated by arsenic-sensing region relative to reference region. Reproduced from Forzani et al., with permission from Elsevier.91 | ||
Mulvihill et al. have taken this technology back to its original application of inorganic molecular detection through the development of a SERS sensor for trace arsenic analysis.92 This sensor consists of a dense array of silver nanoparticle monolayers modified with adsorbed poly(vinyl pyrrolidone) polymer (PVP), which stabilizes the nanocrystal structure and facilitates interactions between silver and arsenate. Arsenic sensing experiments are carried out by bringing a droplet of the arsenic solution in contact with the sensing surface, and covering with a glass cover slip; quantitation is primarily based on the detection of the As–O Raman stretch, with a linear response observed from 1–180 μg L−1 of arsenic in solution. Since SERS spectra provide a chemical ‘fingerprint’ of the sample, this method can also differentiate between As(III) and As(V) in solution.
During static SERS measurements, it is necessary to search for SERS ‘hot spots’ which have measurably high signals; it has been shown that the use of microfluidic geometries can resolve this problem.134 Microfluidic SERS sensors have been used for a variety of applications, including high efficiency target molecule detection, drug detection, and bacterial stain discrimination, among others.135–137 These devices would likely confer similar benefits to the removal of SERS hotspots during arsenic analysis as well.
4.6 Spectroscopic methods
Environmental chemistry often involves the spectroscopic analysis of solid matrices; laser induced breakdown spectroscopy (LIBS) and X-ray fluorescence (XRF) are two solid-state analysis techniques that have currently been explored for arsenic detection. Chemiluminescence (CL) is another spectroscopic technique which, however, detects arsenic in its gas phase.LIBS has been used to detect arsenic in solution at concentrations levels down to 100 μg L−1.93 This sensitivity has been achieved through concentration enhancement via boiling, followed by sample adsorption onto a zinc oxide substrate However, miniaturised LIBS systems (μLIBS) have been developed for the elemental analyses of sodium and lead, which achieve similar sensitivities while analysing liquid samples directly.142,143 μLIBS applications require pulse energies on the order of 100 μJ; so they are capable of analysing smaller spot areas and also are compatible with fibre lasers. Such features facilitate the possibility of LOC-type LIBS technology. A miniaturised LIBS system will likely have increased sensitivity for arsenic relative to the existing method, and will also likely be a suitable method of detection for coupling with electrophoretic separations (Fig. 15).
 | ||
| Fig. 15 Conceptual layout of a potential LOC set-up for a μLIBS system. Micron-sized sample droplets are first generated using a thermal or piezoelectric technique, and then their chemical composition is analysed by a LIBS probe. We note that the flow-through nature of the system renders it a suitable detector for electrophoretic separation techniques such as ITP and CE. Therefore, μLIBS may prove to be a more practical choice over conductivity or AFS detection for portable arsenic monitoring. Reproduced from Godwal et al., with permission from Cambridge University Press.143 | ||
XRF has been used for the analysis of arsenic in water samples by pre-concentration of the arsenic on to solid substrates such as tape and alumina.94,95 The latter approach, in which arsenic is pre-concentrated onto alumina particles and then centrifuged into pellets for solid-state analysis, has an LOD of 0.7 μg L−1 of arsenic in solution. In microfluidics, it is possible to concentrate very high levels of arsenic into very small areas; this will likely increase the sensitivity of such a method and eliminate the need for centrifugation. As an additional advantage to field sensing, some XRF detectors are currently already portable.
Hashem et al. have developed a portable set-up for arsenic CL that avoids the need for a carrier gas, or liquid reagents, altogether (Fig. 16).96 In this approach, arsenic in solution is converted to arsine gas, by means of a solid reducing agent; and ozone is generated separately using a corona discharge source. A pressure difference then drives the arsine gas into the ozone chamber, and the resultant CL is detected using a photomultiplier tube (PMT). The entire process has a reaction time of one minute, and an arsenic LOD of 2 μg L−1. The system is small, light, and has low power consumption; accordingly, it has strong potential to perform well on the field. However, we caution that both arsine gas and ozone are toxic to human health, so this may not be an ideal method when considered from a use-safety standpoint.
 | ||
| Fig. 16 Schematic set-up of a portable gas-phase CL system for arsenic detection. The set-up consists of two fundamental regions: an arsine generator (bottom), and a gas-phase CL detector (top). Arsine generation occurs in a 50 mL vial, and proceeds via NaBH4 reduction of arsenic in solution. The evolved gas flows through a stopcock to the detector, where it reacts with ozone to generate CL. Signal detection occurs with 1 μg L−1 resolution by use of a photomultiplier tube connected to the CL cell by an optical window. Reproduced from Hashem et al., with permission from the Japan Society for Analytical Chemistry.96 | ||
We note that arsenic CL has recently also been used in a slightly different application to detect the amount of arsenic, and other heavy metals, removed from water using a nanoporous anodic aluminium oxide (AAO) membrane.147 Here, the nanomembrane is affixed on a microfluidic platform, and pneumatic and centrifugal microfluidic forces are used for the filtration of the sample as well as the CL detection of the signal. Furthermore, another microfluidic CL system has also been developed for As(III)/As(V) speciation.148 This system, capable of detecting arsenic levels below 10 μg L−1, splits the injected sample into two flows, and independently detects the two arsenic species by taking advantage of the fact that As(III) and As(V) undergo different CL reactions.
5. Micro total analytical systems (μTASs) for arsenic detection
The arsenic detection process can be broken down into three stages: sample preparation, sample analysis, and signal processing. In section 4, we have outlined potential microfluidic LOC techniques that address the issue of arsenic sample analysis. Oftentimes these labs-on-a-chip require labs-around-the-chip to perform pre- and post- analysis processing. By labs-around-a-chip, we refer to the pumps, microscopes, and other large scale external instrumentation that are required for the use and function of microfluidic LOCs.As described by Manz et al., a total analytical system carries out “sampling, sample transport, any necessary chemical reactions, chromatographic separations, as well as detection.”149 A micro total analysis system (μTAS) would encompass an integration of all of these processes into a single platform. The ideal arsenic sensor, as defined in section 3.1, is a μTAS that can achieve the entire arsenic detection process, starting with well water on-site, from start to finish (Fig. 17). General advances in microfluidics technology can serve to fulfil the needs to make this a reality; a few of these advances, relating to pre- and post- arsenic analysis processes, are highlighted below.
 | ||
| Fig. 17 Schematic diagram of the ideal μTAS for portable arsenic detection. Here, the entire arsenic detection process is carried out by a single integrated system. The first step, sample preparation, involves sample introduction to the chip, any arsenic pre-concentration and speciation conversions, as well as interference masking. The next step, sample analysis, involves the actual arsenic assay of choice. And the final step, signal acquisition, involves any additionally required detection processes. We note that microfluidic techniques do currently exist which perform each of these three detection stages separately. | ||
5.1 Specific concerns for arsenic analysis
A particular challenge concerning the analysis of real water samples is interference effects and arsenic oxidation requirements. These issues must be addressed before the arsenic detection assay can proceed. Arsenic and phosphorus compounds share very similar chemistry, owing to their similarities in size and shape. A simple method for the removal of phosphate interference from arsenic containing solutions is by ion chromatography. Ion chromatography for phosphate and arsenate separation proceeds via anion exchange. Phosphorus(V) and arsenic(V) species have different pKa's (~2.2) than arsenic(III) species (~9.2). By starting with an initial solution in which all arsenic is reduced to arsenic(III), ion chromatography can then be used to separate the arsenate and phosphate compounds in solution.61There are several examples in the literature regarding microfluidic chromatography.150 As a proof-of-principle, an on-chip liquid chromatography (LC) system has been developed for the separation of dye and biopolymer mixtures (Fig. 18).151 In this design, a microfluidic column that is packed with mesoporous silica beads separates dyes from biopolymers, using only the pressure generated by a standard syringe pump. Using soft lithography, it is possible to fabricate a multi-layered poly-dimethyl siloxane (PDMS) chip that is interfaced via a polyethylene (PE) membrane to a silica packed channel. It is conceivable that similar packed column devices can be designed for the analysis of environmental samples as well; in the instance of ion exchange channels the mesoporous beads must be replaced with charged polymers instead.
 | ||
| Fig. 18 Schematic diagram of a microfluidic size-exclusion liquid chromatography (LC) system. A packed, mesoporous silica column is interfaced to a poly-dimethyl siloxane (PDMS) microfluidic chip by means of a polyethylene (PE) membrane. Using just the pressure generated by a standard syringe pump, the device can size-exclusion separate dye molecules from biopolymer mixtures. Reproduced from Chan et al., with permission from Hindawi Journals.151 | ||
A common drawback of miniaturisation with regards to trace analysis is that it is difficult to detect low levels of an analyte from a very small sample volume. With regards to arsenic detection, this can potentially be addressed via microfluidic enrichment and pre-concentration. A microfluidic extractor has been developed for the on-chip concentration of arsenic within a hollow-fibre (Fig. 19).152
 | ||
| Fig. 19 A microfluidic hollow fibre membrane extractor for arsenic pre-concentration. Supported liquid membrane extraction (SLME) occurs of arsenic from the original aqueous donor solution (introduced in the microfluidic channel) into an organic acceptor solution (introduced within the hollow fibre membrane, HFM); the pH's of the donor and acceptor solutions are adjusted such that arsenic is uncharged in solution and preferentially partitions into the organic phase. Reproduced from Hylton et al., with permission from Elsevier.152 | ||
Iron oxide binding of arsenic is a fairly well-understood phenomenon that is commonly used in industrial waste management and pollution control systems for arsenic removal.153–158 We propose that iron oxide binding can therefore be another viable option for arsenic pre-concentration applications. Iron oxide pre-concentration binding of arsenic can easily be achieved using a microfluidic platform. As previously mentioned, microfluidic systems readily facilitate diffusion-controlled reactions such as adhesion binding. It can be conceived that arsenic and iron oxide solutions can be mixed on chip. After a characteristic binding time, the arsenic-containing particles can be collected and the arsenic can be re-suspended in a smaller volume for further analysis. Current research efforts in our own group focus on the magnetic pull down and desorption of arsenic from iron-oxide magnetic particles. The arsenic containing extract can then be microfluidically analysed further downstream.
5.2 General issues of portability
Some more general issues for portable continuous-flow microfluidics are sample introduction onto the device, and visualisation of micro-scale processes.Traditionally, microfluidic sample introduction occurs via external syringe pumps; but these pumps cannot be brought to the field. Alternative micro-pumps have been developed with various modes of sample actuation, but many still have limited portability due to continuous need for a power supply. However, hand-powered pumps are one mode of sample introduction that do not require any additional resources. For example, in the hand-powered microfluidic membrane pump developed by Gong et al., the sample is first injected via syringe into the membrane pump, causing the membrane to deform; and then subsequent deflation of the pump by the operator causes the sample to travel downstream (Fig. 20).159
 | ||
| Fig. 20 Schematic diagram of a hand-powered microfluidic membrane pump. The sample is first introduced via syringe, through the syringe interface, to fill and inflate the membrane pump. Then, the membrane pump deflates when pressed and pushes the sample flow through the fluidic resistor to the downstream component of the chip. The rate of fluid flow is regulated by the properties of the fluidic resistor, not the pressure exerted by the mechanical pressing force. Reprinted with permission from Gong et al.; copyright (2012), AIP Publishing LLC.159 | ||
Also, the traditional inverted microscopes and cameras typically used to magnify and capture images of microfluidic devices are extremely expensive, and not practical for use on the field. However, recently, the ‘Foldscope’, an origami-based paper microscope, has been constructed for a mere fifty cents.160 This device consists simply of a sheet of punched cardstock, a spherical lens, a light-emitting diode (LED) with a diffuser panel, and a battery to power the diode. It is easily assembled via folding, weighs only 8 ounces so is easily portable, and yet has a magnification power of up to 2000 times. In addition to the Foldscope, there is also much interest in the use of smartphones coupled to magnifying lenses as portable imaging detectors.161–168
Possibly, the most useful development forward towards increasing the accessibility of portable arsenic testing to the developing world is via signal quantification by use of cell phones. The computational power of the modern smartphone rivals that of computers; so smartphones can be used both for image acquisition, via camera, and also for image processing, via a specialized mobile application. This, coupled to the fact that these devices are becoming increasingly popular everywhere around the world, renders smartphone technology very favourable for portable microfluidic process visualisation. For example, Sicard et al. have integrated the hardware, software, and social media capabilities of cellphones to develop a water quality monitoring system.169 Here, a paper-based water quality sensor is imaged by a cell phone and the signal is quantified by a downloadable image processing application; the results are then mapped onto an online water monitoring network. The implementation of such a system for arsenic well monitoring and mapping may generate a paradigm shift in how the issue of arsenic contamination is tackled both in Bangladesh and around the world.
6. Conclusion
Arsenic contamination is an ubiquitous problem all over the world; particularly in Bangladesh, where contamination is attributed to naturally high arsenic levels in ground sediments.1,6,7 Although the current WHO MCL for arsenic in drinking water is set at 10 μg L−1, analytical and economic constraints cause Bangladesh and many other developing nations to adopt a higher limit of 50 μg L−1.1,3,25 Unfortunately, it is expected that 1 out of 100 people who consume water in excess of 50 μg L−1 of arsenic, will die due to an arsenic-related cancer.6To date, 6–11 million tube-wells need to be tested for arsenic contamination in Bangladesh.24 While common laboratory techniques such as AAS, MS, and AFS all have the ability to detect arsenic levels well below the WHO limit, their high costs and the requirement for a centralized facility render them ineffective for mass monitoring applications. Furthermore, the portable Gutzeit-method based arsenic test strips introduced in the 2000s have been shown to lack the safety, sensitivity, and reliability required for a human-health risk determination.
We stipulate that an ideal arsenic sensor, aimed to address the global need for arsenic monitoring, must meet the criteria of sensitivity and selectivity, speed and reproducibility, portability and robustness, health and environmental safety, and affordability and ease of use. Several efforts are currently in place for the development of alternate arsenic sensors using colorimetric, electrochemical, biological, electrophoretic, surface sensing, spectroscopic and paper-based methods. We note that the integration of microfluidic technology lends many advantages to point-of-care-type device development; including increased portability, faster reactions, higher throughput, increased reliability, reduced cost, reduced health and environmental impacts, and easier handling.
Presently, we have reviewed these different alternate detection methods in terms of their potential as a routine arsenic sensor. Many of the mentioned alternate arsenic analyses either already have been, or can be, implemented microfluidically in the form of LOC devices; it is also evident that many sample work-up and other required manipulations can be portably implemented as well. In light of these developments, it is clear that the future of portable microfluidic arsenic detection is quite bright. Once an integrated LOC is developed for arsenic analysis, all that is required is to click together the necessary auxiliary modules and voila: the ideal portable arsenic sensor.
Acknowledgements
The authors are thankful for helpful discussions with B Battaglia (Ryerson), and A Safarzadeh-Amiri (Trojan UV). Funding support has been provided by Grand Challenges Canada—Stars in Global Health Phase 1 (grant # 0377–01).References
- B. Petrusevski and S. Sharma, IRC Int. Water Sanit. Cent., 2007 Search PubMed.
- World Bank Water and Sanitation Program, Towards a more effective operational response: arsenic contamination of ground water in South and East Asian countries, 2005 Search PubMed.
- A. H. Smith, E. O. Lingas and M. Rahman, Bull. W. H. O., 2000, 78, 1093–1103 CAS.
- D. Kinniburgh and P. Smedley, Arsenic contamination of groundwater in Bangladesh, 2001, vol. 1 Search PubMed.
- M. Argos, T. Kalra, P. J. Rathouz, Y. Chen, B. Pierce, F. Parvez, T. Islam, A. Ahmed, M. Rakibuz-Zaman, R. Hasan, G. Sarwar, V. Slavkovich, A. van Geen, J. Graziano and H. Ahsan, Lancet, 2010, 376, 252–258 CrossRef CAS.
- WHO, Water-related diseases: Arsenicosis, 2001 Search PubMed.
- L. A. Cicero, Stanford Rep., 2009 Search PubMed.
- C.-Y. Yang, C.-C. Chang, S.-C. Ho and H.-F. Chiu, J. Toxicol. Environ. Health, Part A, 2008, 71, 533–538 CrossRef CAS PubMed.
- C. J. Chen, Y. C. Chuang, S. L. You, T. M. Lin and H. Y. Wu, Br. J. Cancer, 1986, 53, 399–405 CrossRef CAS.
- M. M. Wu, T. L. Kuo, Y. H. Hwang and C. J. Chen, Am. J. Epidemiol., 1989, 130, 1123–1132 CAS.
- C. Ferreccio, C. González, V. Milosavjlevic, G. Marshall, A. M. Sancha and A. H. Smith, Epidemiology, 2000, 11, 673–679 CrossRef CAS PubMed.
- C. Hopenhayn-Rich, M. L. Biggs and A. H. Smith, Int. J. Epidemiol., 1998, 27, 561–569 CrossRef CAS PubMed.
- T. Tsuda, A. Babazono, E. Yamamoto, N. Kurumatani, Y. Mino, T. Ogawa, Y. Kishi and H. Aoyama, Am. J. Epidemiol., 1995, 141, 198–209 CAS.
- K. H. Morales, L. Ryan, T. L. Kuo, M. M. Wu and C. J. Chen, Environ. Health Perspect., 2000, 108, 655–661 CrossRef CAS.
- R. Baastrup, M. Sørensen, T. Balstrøm, K. Frederiksen, C. L. Larsen, A. Tjønneland, K. Overvad and O. Raaschou-Nielsen, Environ. Health Perspect., 2008, 116, 231–237 CrossRef CAS PubMed.
- N. Sohel, L. A. Persson, M. Rahman, P. K. Streatfield, M. Yunus, E.-C. Ekström and M. Vahter, Epidemiology, 2009, 20, 824–830 CrossRef PubMed.
- C.-Y. Yang, H.-F. Chiu, T.-N. Wu, H.-Y. Chuang and S.-C. Ho, Arch. Environ. Health, 2004, 59, 484–488 CrossRef CAS PubMed.
- S. H. Lamm, A. Engel and A. B. Kruse, J. Occup. Environ. Med., 2004, 46, 298–306 CrossRef CAS.
- C.-H. Tseng, Angiology, 2002, 53, 529–537 CrossRef PubMed.
- C. Villanueva and M. Kogevinas, Environ. Health Perspect., 1999, 107, 359–365 CrossRef.
- WHO, Arsenic in Drinking-water: Background document for development of WHO Guidelines for Drinking Water Quality, 2011 Search PubMed.
- M.-L. Chen, L.-Y. Ma and X.-W. Chen, Talanta, 2014, 125, 78–86 CrossRef CAS PubMed.
- G. Samanta, T. R. Chowdhury, B. K. Mandal, B. K. Biswas, U. K. Chowdhury, G. K. Basu, C. R. Chanda, D. Lodh and D. Chakraborti, Microchem. J., 1999, 62, 174–191 CrossRef CAS.
- M. Jakariya, M. Vahter, M. Rahman, M. A. Wahed, S. K. Hore, P. Bhattacharya, G. Jacks and L. A. Persson, Sci. Total Environ., 2007, 379, 167–175 CrossRef CAS PubMed.
- S. V. Flanagan, R. B. Johnston and Y. Zheng, Bull. W. H. O., 2012, 90, 839–846 CrossRef PubMed.
- J. R. Behari and R. Prakash, Chemosphere, 2006, 63, 17–21 CrossRef CAS PubMed.
- B. Klaue and J. D. Blum, Anal. Chem., 1999, 71, 1408–1414 CrossRef CAS.
- M. A. Wahed, D. Chowdhury, B. Nermell, S. I. Khan, M. Ilias, M. Rahman, L. A. Persson and M. Vahter, J. Health. Popul. Nutr., 2006, 24, 36–41 CAS.
- United States Environmental Protection Agency Office of Water, Analytical Methods Support Document For Arsenic In Drinking Water, 1999, vol. 22027 Search PubMed.
- V. Roje, N. Mikac and G. Kniewald, Croat. Chem. Acta, 2007, 80, 91–100 Search PubMed.
- M. M. Rahman, D. Mukherjee, M. K. Sengupta, U. K. Chowdhury, D. C. R. Lodh, S. Roy, M. Selim, Q. Quamruzzaman, A. H. Milton, S. M. Shahidullah, M. T. Rahman and D. Chakraborti, Environ. Sci. Technol., 2002, 36, 5385–5394 CrossRef CAS.
- C. R. Sanger and O. F. Black, Proc. Am. Acad. Arts Sci., 1907, 43, 297–324 CrossRef.
- M. Arora, M. Megharaj and R. Naidu, Environ. Geochem. Health, 2009, 31 Suppl 1, 45–48 CrossRef PubMed.
- D. G. Kinniburgh and W. Kosmus, Talanta, 2002, 58, 165–180 CrossRef CAS.
- C. M. George, J. H. Graziano, J. L. Mey and A. van Geen, Environ. Health, 2012, 11, 7 CrossRef CAS PubMed.
- K. Hettiarachchi, E. Talu, M. L. Longo, P. A. Dayton and A. P. Lee, Lab Chip, 2007, 7, 463–468 RSC.
- R. Gómez-sjöberg, D. T. Morisette and R. Bashir, J. Microelectromech. Syst., 2005, 14, 829–838 CrossRef.
- G. Bindiganavale, S. M. You, H. Moon and M. Amaya, in ASME 2012 Third International Conference on Micro/Nanoscale, Heat Mass Transfer, 2012, pp. 39–42 Search PubMed.
- H. Fadaei, B. Scarff and D. Sinton, Energy Fuels, 2011, 25, 4829–4835 CrossRef CAS.
- D. Melamed, Anal. Chim. Acta, 2005, 532, 1–13 CrossRef CAS PubMed.
- D. Q. Hung, O. Nekrassova and R. G. Compton, Talanta, 2004, 64, 269–277 CrossRef CAS PubMed.
- K. A. Francesconi and D. Kuehnelt, Analyst, 2004, 129, 373–395 RSC.
- J. H. T. Luong, E. Majid and K. B. Male, Open Anal. Chem. J., 2007, 1, 7–14 CrossRef CAS.
- F. Deng, R. Dong, K. Yu, X. Luo, X. Tu, S. Luo and L. Yang, Microchim. Acta, 2013, 180, 509–515 CrossRef CAS.
- D. A. Skoog, F. J. Holler and S. R. Crouch, Principles of Instrumental Analysis, Cengage Learning, 6th edn, 2006 Search PubMed.
- J. L. Gómez-Ariza, D. Sánchez-Rodas, I. Giráldez and E. Morales, Talanta, 2000, 51, 257–268 CrossRef.
- A.-L. Lindberg, W. Goessler, M. Grandér, B. Nermell and M. Vahter, Toxicol. Lett., 2007, 168, 310–318 CrossRef CAS PubMed.
- C. M. Steinmaus, C. M. George, D. Kalman and A. H. Smith, Environ. Sci. Technol., 2006, 40, 3362–3366 CrossRef CAS.
- U. Bose, M. Rahman and M. Alamgir, Int. J. Chem. Technol., 2011, 3, 14–25 CrossRef CAS.
- A. Safarzadeh-Amiri, P. Fowlie, A. I. Kazi, S. Siraj, S. Ahmed and A. Akbor, Sci. Total Environ., 2011, 409, 2662–2667 CrossRef CAS PubMed.
- S. P. Pande, L. S. Deshpande and S. N. Kaul, Environ. Monit. Assess., 2001, 68, 1–18 CrossRef CAS.
- N. Sankararamakrishnan, D. Chauhan, R. T. Nickson, R. M. Tripathi and L. Iyengar, Sci. Total Environ., 2008, 401, 162–167 CrossRef CAS PubMed.
- L. S. Deshpande and S. P. Pande, Environ. Monit. Assess., 2005, 101, 93–101 CAS.
- A. Mukherjee, M. K. Sengupta, S. Ahamed, M. A. Hossain, B. Das, B. Nayak and D. Chakraborti, Environ. Sci. Technol., 2005, 39, 5501–5502 CrossRef CAS ; author reply 5503–4.
- J. Kearns and J. Tyson, Anal. Methods, 2012, 4, 1693 RSC.
- J. Das, P. Sarkar, J. Panda and P. Pal, J. Environ. Sci. Health, Part A: Toxic/Hazard. Subst. Environ. Eng., 2014, 49, 108–115 CrossRef CAS PubMed.
- M. Salman, M. Athar, U. Shafique, J. Anwar, R. Rehman, S. Ameer and M. Azeem, Anal. Methods, 2012, 4, 242–246 RSC.
- P. Linares and M. D. L. De Castro, Anal. Chem., 1986, 58, 120–124 CrossRef CAS.
- T. Rupasinghe, T. J. Cardwell, R. W. Cattrall, I. D. Potter and S. D. Kolev, Anal. Chim. Acta, 2004, 510, 225–230 CrossRef CAS PubMed.
- T. Rupasinghe, T. J. Cardwell, R. W. Cattrall, M. D. L. de Castro and S. D. Kolev, Anal. Chim. Acta, 2001, 445, 229–238 CrossRef CAS.
- P. K. Dasgupta, H. Huang, G. Zhang and G. P. Cobb, Talanta, 2002, 58, 153–164 CrossRef CAS.
- R. K. Dhar, Y. Zheng, J. Rubenstone and A. van Geen, Anal. Chim. Acta, 2004, 526, 203–209 CrossRef CAS PubMed.
- K. Morita and E. Kaneko, Anal. Chem., 2006, 78, 7682–7688 CrossRef CAS PubMed.
- K. Morita and E. Kaneko, Anal. Sci., 2006, 22, 1085–1089 CrossRef CAS.
- S. K. Ghosh, S. Kundu, M. Mandal and T. Pal, Langmuir, 2002, 18, 8756–8760 CrossRef CAS.
- S. Kundu, S. K. Ghosh, S. Nath, S. Panigrahi, S. Praharaj and S. Basu, Indian J. Chem., 2005, 44, 2030–2033 Search PubMed.
- S. Kundu, S. K. Ghosh, M. Mandal, T. Pal and A. Pal, Talanta, 2002, 58, 935–942 CrossRef CAS.
- R. D. Sharma, S. Joshi and S. Amlathe, Anal. Methods, 2011, 3, 452 RSC.
- P. Nath, K. Arun and N. Chanda, RSC Adv., 2014, 4, 59558–59561 RSC.
- D. E. Mays and A. Hussam, Anal. Chim. Acta, 2009, 646, 6–16 CrossRef CAS PubMed.
- R. Feeney and S. P. Kounaves, Talanta, 2002, 58, 23–31 CrossRef CAS.
- E. Majid, S. Hrapovic, Y. Liu, K. B. Male and J. H. T. Luong, Anal. Chem., 2006, 78, 762–769 CrossRef CAS PubMed.
- K. B. Male, S. Hrapovic, J. M. Santini and J. H. T. Luong, Anal. Chem., 2007, 79, 7831–7837 CrossRef CAS PubMed.
- S. Cosnier, C. Mousty, X. Cui, X. Yang and S. Dong, Anal. Chem., 2006, 78, 4985–4989 CrossRef CAS PubMed.
- M. Stoytcheva, V. Sharkova and M. Panayotova, Anal. Chim. Acta, 1998, 364, 195–201 CrossRef CAS.
- M. Khairy, D. K. Kampouris, R. O. Kadara and C. E. Banks, Electroanalysis, 2010, 22, 2496–2501 CrossRef CAS PubMed.
- S. Sanllorente-Méndez, O. Domínguez-Renedo and M. J. Arcos-Martínez, Sensors, 2010, 10, 2119–2128 CrossRef PubMed.
- E. Diesel, M. Schreiber and J. R. van der Meer, Anal. Bioanal. Chem., 2009, 394, 687–693 CrossRef CAS PubMed.
- J. Stocker, D. Balluch, M. Gsell, H. Harms, J. Feliciano, S. Daunert, K. Malik and J. R. van der Meer, Environ. Sci. Technol., 2003, 37, 4743–4750 CrossRef CAS.
- J. Aleksic, F. Bizzari, Y. Cai, B. Davidson, K. De Mora, S. Ivakhno, S. L. Seshasayee, J. Nicholson, J. Wilson, A. Elfick, C. French, H. Ma and A. Millar, IET Synth. Biol., 2007, 1, 87–90 CrossRef.
- K. Siegfried, C. Endes, A. F. M. K. Bhuiyan, A. Kuppardt, J. Mattusch, J. R. van der Meer, A. Chatzinotas and H. Harms, Environ. Sci. Technol., 2012, 46, 3281–3287 CrossRef CAS PubMed.
- A. Rothert, S. K. Deo, L. Millner, L. G. Puckett, M. J. Madou and S. Daunert, Anal. Biochem., 2005, 342, 11–19 CrossRef CAS PubMed.
- J. Theytaz, T. Braschler, H. van Lintel, P. Renaud, E. Diesel, D. Merulla and J. van der Meer, Procedia Chem., 2009, 1, 1003–1006 CrossRef PubMed.
- N. Buffi, D. Merulla, J. Beutier, F. Barbaud, S. Beggah, H. van Lintel, P. Renaud and J. R. van der Meer, Lab Chip, 2011, 11, 2369–2377 RSC.
- D. Merulla, N. Buffi, S. Beggah, F. Truffer, M. Geiser, P. Renaud and J. R. van der Meer, Curr. Opin. Biotechnol., 2013, 24, 534–541 CrossRef CAS PubMed.
- J. Prest, S. Baldock, P. Fielden, N. Goddard and B. Trevesbrown, J. Chromatogr. A, 2003, 990, 325–334 CrossRef CAS.
- J. E. Prest, S. J. Baldock, P. R. Fielden, N. J. Goddard and B. J. Treves Brown, Microchim. Acta, 2005, 151, 223–230 CrossRef CAS.
- F. Li, D.-D. Wang, X.-P. Yan, R.-G. Su and J.-M. Lin, J. Chromatogr. A, 2005, 1081, 232–237 CrossRef CAS PubMed.
- Y. Wu, S. Zhan, F. Wang, L. He, W. Zhi and P. Zhou, Chem. Commun., 2012, 48, 4459–4461 RSC.
- Y. Wu, L. Liu, S. Zhan, F. Wang and P. Zhou, Analyst, 2012, 137, 4171–4178 RSC.
- E. S. Forzani, K. Foley, P. Westerhoff and N. Tao, Sens. Actuators, B, 2007, 123, 82–88 CrossRef CAS PubMed.
- M. Mulvihill, A. Tao, K. Benjauthrit, J. Arnold and P. Yang, Angew. Chem., Int. Ed., 2008, 120, 6556–6560 CrossRef PubMed.
- A. F. M. Y. Haider, M. Hedayet Ullah, Z. H. Khan, F. Kabir and K. M. Abedin, Opt. Laser Technol., 2014, 56, 299–303 CrossRef CAS PubMed.
- V. M. Sbarato and H. J. Sánchez, Appl. Radiat. Isot., 2001, 54, 737–740 CrossRef CAS.
- H. Barros, L.-M. Marcó Parra, L. Bennun and E. D. Greaves, Spectrochim. Acta, Part B, 2010, 65, 489–492 CrossRef PubMed.
- A. Hashem, T. Jodai, S. Ohira, K. Wakuda and K. Toda, Anal. Sci., 2011, 27, 733–738 CrossRef.
- A. W. Martinez, S. T. Phillips, G. M. Whitesides and E. Carrilho, Anal. Chem., 2010, 82, 3–10 CrossRef CAS PubMed.
- G. M. Whitesides, Nature, 2006, 442, 368–373 CrossRef CAS PubMed.
- H. Levine, J. J. Rowe and F. S. Grimaldi, Science, 1954, 119, 327–328 CAS.
- P. Wagli, Y. Chang, A. Homsy, L. Hvozdara, H. P. Herzig and N. F. De Rooij, Anal. Chem., 2013, 85, 7558–7565 CrossRef CAS PubMed.
- G. Plinius Secondus, Historia Naturae, Book IX Search PubMed.
- S. M. Z. Hossain and J. D. Brennan, Anal. Chem., 2011, 83, 8772–8778 CrossRef CAS PubMed.
- M. M. Mentele, J. Cunningham, K. Koehler, J. Volckens and C. S. Henry, Anal. Chem., 2012, 84, 4474–4480 CrossRef CAS PubMed.
- F.-M. Matysik, Anal. Bioanal. Chem., 2003, 375, 33–35 CAS.
- R. Baron, B. Šljukić, C. Salter, a. Crossley and R. G. Compton, Russ. J. Phys. Chem. A, 2007, 81, 1443–1447 CrossRef CAS.
- X. Dai, O. Nekrassova, M. E. Hyde and R. G. Compton, Anal. Chem., 2004, 76, 5924–5929 CrossRef CAS PubMed.
- R. Feeney and S. Kounaves, Anal. Chem., 2000, 72, 2222–2228 CrossRef CAS.
- C. Gao, X.-Y. Yu, S.-Q. Xiong, J.-H. Liu and X.-J. Huang, Anal. Chem., 2013, 85, 2673–2680 CrossRef CAS PubMed.
- M. Rajkumar, S. Thiagarajan and S. Chen, Int. J. Electrochem. Sci., 2011, 6, 3164–3177 CAS.
- L. Xiao, G. G. Wildgoose and R. G. Compton, Anal. Chim. Acta, 2008, 620, 44–49 CrossRef CAS PubMed.
- A. Salimi, H. Mamkhezri, R. Hallaj and S. Soltanian, Sens. Actuators, B, 2008, 129, 246–254 CrossRef CAS PubMed.
- X. Dai and R. G. Compton, Analyst, 2006, 131, 516–521 RSC.
- G. Forsberg, J. W. O'Laughlin, R. G. Megargle and S. R. Koirtyihann, Anal. Chem., 1975, 47, 1586–1592 CrossRef CAS.
- O. D. Renedo, M. A. Alonso-Lomillo and M. J. A. Martínez, Talanta, 2007, 73, 202–219 CrossRef CAS PubMed.
- U. Kim, J. VanderGiessen, B. Demaree, M. Reynolds and K. Perricone, 2013 IEEE Biomed. Circuits Syst. Conf. BioCAS, 2013, 2013, 113–117 Search PubMed.
- F. Truffer, N. Buffi, D. Merulla, S. Beggah, H. Van Lintel, P. Renaud, J. R. Van, F. Truffer, N. Buffi, D. Merulla, S. Beggah and H. Van Lintel, Rev. Sci. Instrum., 2014, 85, 015120 CrossRef PubMed.
- C. S. Oh, US Pat., 5 904 824, 1999 Search PubMed.
- K. D. Dorfman, S. B. King, D. W. Olson, J. D. P. Thomas and D. R. Tree, Chem. Rev., 2013, 113, 2584–2667 CrossRef CAS PubMed.
- R. M. Guijt, C. J. Evenhuis, M. Macka and P. R. Haddad, Electrophoresis, 2004, 25, 4032–4057 CrossRef CAS PubMed.
- T. Rosenfeld and M. Bercovici, Lab Chip, 2014, 14, 4465–4474 RSC.
- N. Xia, Y. Shi, R. Zhang, F. Zhao, F. Liu and L. Liu, Anal. Methods, 2012, 4, 3937 RSC.
- M. Weiner, Natl. Cap. Poison Cent., 2000, 189 Search PubMed.
- J. R. Kalluri, T. Arbneshi, S. A. Khan, A. Neely, P. Candice, B. Varisli, M. Washington, S. McAfee, B. Robinson, S. Banerjee, A. K. Singh, D. Senapati and P. C. Ray, Angew. Chem., Int. Ed. Engl., 2009, 48, 9668–9671 CrossRef CAS PubMed.
- C.-Y. Yang, E. Brooks, Y. Li, P. Denny, C.-M. Ho, F. Qi, W. Shi, L. Wolinsky, B. Wu, D. T. W. Wong and C. D. Montemagno, Lab Chip, 2005, 5, 1017–1023 RSC.
- E. Galopin, M. Beaugeois, B. Pinchemel, J.-C. Camart, M. Bouazaoui and V. Thomy, Biosens. Bioelectron., 2007, 23, 746–750 CrossRef CAS PubMed.
- Y. Luo, F. Yu and R. N. Zare, Lab Chip, 2008, 8, 694–700 RSC.
- R. Kurita, Y. Yokota, Y. Sato, F. Mizutani and O. Niwa, Anal. Chem., 2006, 78, 5525–5531 CrossRef CAS PubMed.
- Z. Wang, T. Wilkop, D. Xu, Y. Dong, G. Ma and Q. Cheng, Anal. Bioanal. Chem., 2007, 389, 819–825 CrossRef CAS PubMed.
- R. Karlsson, a Michaelsson and L. Mattsson, J. Immunol. Methods, 1991, 145, 229–240 CrossRef CAS.
- Y. Wei and R. A. Latour, Langmuir, 2008, 24, 6721–6729 CrossRef CAS PubMed.
- V. N. Vernekar and R. A. Latour, Mater. Res. Innovations, 2005, 9, 337–353 CAS.
- S. Nie, Science, 1997, 275, 1102–1106 CrossRef CAS PubMed.
- X.-M. Qian and S. M. Nie, Chem. Soc. Rev., 2008, 37, 912–920 RSC.
- K. R. Strehle, D. Cialla, P. Rösch, T. Henkel, M. Köhler and J. Popp, Anal. Chem., 2007, 79, 1542–1547 CrossRef CAS PubMed.
- B.-B. Xu, Z.-C. Ma, L. Wang, R. Zhang, L.-G. Niu, Z. Yang, Y.-L. Zhang, W.-H. Zheng, B. Zhao, Y. Xu, Q.-D. Chen, H. Xia and H.-B. Sun, Lab Chip, 2011, 11, 3347–3351 RSC.
- K. R. Ackermann, T. Henkel and J. Popp, ChemPhysChem, 2007, 8, 2665–2670 CrossRef CAS PubMed.
- A. Walter, A. März, W. Schumacher, P. Rösch and J. Popp, Lab Chip, 2011, 11, 1013–1021 RSC.
- D. Rusak, B. C. Castle, B. W. Smith and J. D. Winefordner, Crit. Rev. Anal. Chem., 1997, 27, 257–290 CrossRef CAS PubMed.
- Z. Chen, Y. Godwal, Y. Y. Tsui and R. Fedosejevs, Appl. Opt., 2010, 49, C87 CrossRef CAS.
- G. Theriault, S. Bodensteiner and S. H. Lieberman, Field Anal. Chem. Technol., 1998, 2, 117–125 CrossRef CAS.
- B. J. Marquardt, S. R. Goode and S. M. Angel, Anal. Chem., 1996, 68, 977–981 CrossRef CAS.
- Y. Godwal, G. Kaigala, V. Hoang, S.-L. Lui, C. Backhouse, Y. Tsui and R. Fedosejevs, Opt. Express, 2008, 16, 12435–12445 CrossRef CAS.
- Y. Godwal, M. T. Taschuk, S. L. Lui, Y. Y. Tsui and R. Fedosejevs, Laser Part. Beams, 2008, 26, 95–103 CrossRef CAS.
- P. Brouwer, Theory of XRF, Lelyweg, Almelo, the Netherlands, 2010 Search PubMed.
- K. Fujiwara, Y. Watanabe and K. Fuwa, Anal. Chem., 1982, 54, 125–128 CrossRef CAS.
- D. H. Stedman, M. E. Fraser, M. Nazeeri and M. Nelson, Anal. Chem., 1983, 55, 1809–1810 CrossRef.
- H. Chang, Y. Chen, A. Lo, S. Hung, S. Lin, I. Chang and J. Lin, Mater. Res. Innovations, 2014, 18, 685–690 Search PubMed.
- N. Taokaenchan, R. Puntharod, T. Tangkuaram, P. Pookmanee, S. Phaisansuthichol and S. Sangsrichan, J. Flow Injection Anal., 2014, 31, 27–31 Search PubMed.
- A. Manz, N. Graber and H. M. Widmer, Sens. Actuators, B, 1990, 1, 244–248 CrossRef CAS.
- F. A. Gomez, in Methods in molecular biology, Springer, 2011, pp. 137–150 Search PubMed.
- A. S. Chan, M. K. Danquah, D. Agyei, P. G. Hartley and Y. Zhu, J. Anal. Methods Chem., 2014, 1–6 CrossRef PubMed.
- K. Hylton and S. Mitra, Anal. Chim. Acta, 2008, 607, 45–49 CrossRef CAS PubMed.
- I. A. Katsoyiannis and A. I. Zouboulis, Water Res., 2002, 36, 5141–5155 CrossRef CAS.
- O. S. Thirunavukkarasu, T. Viraraghavan and K. S. Subramanian, Water, Air, Soil Pollut., 2003, 142, 95–111 CrossRef CAS.
- J. T. Mayo, C. Yavuz, S. Yean, L. Cong, H. Shipley, W. Yu, J. Falkner, A. Kan, M. Tomson and V. L. Colvin, Sci. Technol. Adv. Mater., 2007, 8, 71–75 CrossRef CAS PubMed.
- C. T. Yavuz, J. T. Mayo, C. Suchecki, J. Wang, A. Z. Ellsworth, H. D'Couto, E. Quevedo, A. Prakash, L. Gonzalez, C. Nguyen, C. Kelty and V. L. Colvin, Environ. Geochem. Health, 2010, 32, 327–334 CrossRef CAS PubMed.
- S. Yean and L. Cong, et al. , J. Mater. Res., 2005, 3255–3264 CrossRef CAS.
- T. A. Kurniawan, M. E. T. Sillanpää and M. Sillanpää, Crit. Rev. Environ. Sci. Technol., 2012, 42, 1233–1295 CrossRef CAS PubMed.
- M. M. Gong, B. D. Macdonald, T. Vu Nguyen and D. Sinton, Biomicrofluidics, 2012, 6, 44102 CrossRef PubMed.
- J. Cybulski, J. Clements and M. Prakash, PLoS One, 2014, 9, 1–36 Search PubMed.
- T. S. Park, W. Li, K. E. McCracken and J.-Y. Yoon, Lab Chip, 2013, 13, 4832–4840 RSC.
- L. Shen, J. Hagen and I. Papautsky, Lab Chip, 2012, 12, 4240–4243 RSC.
- H. Zhu, S. Mavandadi, A. F. Coskun, O. Yaglidere and A. Ozcan, Anal. Chem., 2011, 83, 6641–6647 CrossRef CAS PubMed.
- A. W. Martinez, S. T. Phillips, E. Carrilho, S. W. Thomas, H. Sindi and G. M. Whitesides, Anal. Chem., 2008, 80, 3699–3707 CrossRef CAS PubMed.
- A. García, M. M. Erenas, E. D. Marinetto, C. A. Abad, I. de Orbe-Paya, A. J. Palma and L. F. Capitán-Vallvey, Sens. Actuators, B, 2011, 156, 350–359 CrossRef PubMed.
- D. A. Selck, M. A. Karymov, B. Sun and R. F. Ismagilov, Anal. Chem., 2013, 85, 11129–11136 CrossRef CAS PubMed.
- Y. Lu, W. Shi, J. Qin and B. Lin, Electrophoresis, 2009, 30, 579–582 CrossRef CAS PubMed.
- J. M. Ruano-López, M. Agirregabiria, G. Olabarria, D. Verdoy, D. D. Bang, M. Bu, A. Wolff, A. Voigt, J. Dziuban, R. Walczak and J. Berganzo, Lab Chip, 2009, 9, 1495–1499 RSC.
- C. Sicard, C. Glen, B. Aubie, D. Wallace, S. Jahanshahi-anbuhi, K. Pennings, G. T. Daigger, R. Pelton, J. D. Brennan and C. D. M. Filipe, Water Res., 2015, 70, 360–369 CrossRef CAS PubMed.
- P. L. Smedley and D. G. Kinniburgh, Appl. Geochem., 2002, 17, 517–568 CrossRef CAS.
- I. D. Brindle, Anal. Bioanal. Chem., 2007, 388, 735–741 CrossRef CAS PubMed.
- J. N. Barrows, G. B. Jameson and M. T. Pope, J. Am. Chem. Soc., 1985, 107, 1771–1773 CrossRef CAS.
| This journal is © The Royal Society of Chemistry 2015 |