
Selective adsorption of oil–water mixtures using polydimethylsiloxane (PDMS)–graphene sponges†
Diana N. H.
Tran
,
Shervin
Kabiri
,
Ting Rui
Sim
and
Dusan
Losic
*
School of Chemical Engineering, The University of Adelaide, Adelaide, SA 5005, Australia. E-mail: dusan.losic@adelaide.edu.au
First published on 12th March 2015
Abstract
We report a porous and green three dimensional (3-D) polydimethylsiloxane (PDMS)–graphene sponge with hydrophobic and oleophilic properties using the sugar templating method. The prepared sponge exhibited high adsorption performance for the removal of petroleum products, organic solvents and emulsified oil–water mixtures, especially under a continuous vacuum regime achieving an adsorption capacity of 4.5 L of hexane in 30 min. The proposed synthetic method is simple and economical for the scalable production of porous 3-D graphene sponges, which can be successfully used for efficient and cost-effective oil spill clean-ups and water purification for environmental applications.
Water impactA growing worldwide concern about frequent accidental releases of oil during extraction, transportation and storage with billions of spilled oil has caused catastrophic impact on the water environment. Considerable research towards the development of new porous materials and adsorbents with specific superhydrophobic and superoleophilic properties were explored to address this problem, but with limited success. Graphene based materials and their polymer composites with hierarchical 3D architectures, tailorable porosity and interfacial properties are offering new opportunities to design new advanced adsorbents and devices for scalable removal of spilled oil from waters. The presented work will provide new knowledge towards understanding the adsorption mechanism of mixed oil from the water and will provide valuable contribution for solving this significant environmental problem. |
Introduction
Oil spills are detrimental both to the environment and the economy. The recent Deepwater Horizon incident resulted in over 5![[thin space (1/6-em)]](https://www.rsc.org/images/entities/char_2009.gif) 000000 barrels of crude oil being emitted into the Gulf of Mexico. This is equivalent to 175000 km2 of oil and the loss of $600000000 USD.1 The economic loss is effectively irreversible, and the after effect on the marine and aquatic ecosystems is detrimental. However, the environmental damage can be reduced by developing effective mitigation and clean up strategies. Mechanical, biological and chemical clean ups are three of the commonly used methods employed to minimise and mitigate the effects of oil spills. Mechanical clean up involves the use of equipment and machineries, such as booms, barriers, skimmers and sorbent materials to facilitate the capturing and storage of spilled oil. Therefore, minimising the affected area until it is properly treated or disposed of.2 Biological treatment involves the use of microorganisms for the biodegradation of oil components.3 However, this method showed poor removal of oil and conflicting results in the literature.4–6 The chemical method involves combustion of the floating oils, and the use of dispersing agents and solidifiers.3 Burnings are often considered as the last resort but it is not environmentally benign due to the large production of soot and greenhouses.2 In addition, the performance of dispersants is still far from being accurately quantified. The spatial variations and heterogeneities of the dispersants concentration results are the underpinning challenge.6 Amongst all the methods used for oil remediation, the mechanical extraction of oil by sorbents or absorption is considered as one of the most efficient and cost effective methods.
000000 barrels of crude oil being emitted into the Gulf of Mexico. This is equivalent to 175000 km2 of oil and the loss of $600000000 USD.1 The economic loss is effectively irreversible, and the after effect on the marine and aquatic ecosystems is detrimental. However, the environmental damage can be reduced by developing effective mitigation and clean up strategies. Mechanical, biological and chemical clean ups are three of the commonly used methods employed to minimise and mitigate the effects of oil spills. Mechanical clean up involves the use of equipment and machineries, such as booms, barriers, skimmers and sorbent materials to facilitate the capturing and storage of spilled oil. Therefore, minimising the affected area until it is properly treated or disposed of.2 Biological treatment involves the use of microorganisms for the biodegradation of oil components.3 However, this method showed poor removal of oil and conflicting results in the literature.4–6 The chemical method involves combustion of the floating oils, and the use of dispersing agents and solidifiers.3 Burnings are often considered as the last resort but it is not environmentally benign due to the large production of soot and greenhouses.2 In addition, the performance of dispersants is still far from being accurately quantified. The spatial variations and heterogeneities of the dispersants concentration results are the underpinning challenge.6 Amongst all the methods used for oil remediation, the mechanical extraction of oil by sorbents or absorption is considered as one of the most efficient and cost effective methods.
Sorbents are materials that can be distributed on the surface of the water and absorb the liquid chemical. This means that the sorbent needs to be less dense than water. The sorption mechanisms for all liquid chemicals are different.7,8 For oil adsorption, the sorbent must be highly selective and possess oleophilic and hydrophobic properties for the separation of oil–water mixtures.3 For practical oil remediation applications, sorbents with low production cost, high recyclability and reusability is advantageous to benefit the environment and economy.
To date, a wide range of materials, such as natural adsorbents, synthetic microporous polymers and carbon-based nanomaterials have been used and studied for oil spill removal.7–9 Due to the excellent adsorption characteristics and fast adsorption kinetics, microporous polymers and carbon-based materials have significant advantages over natural adsorbents, such as kenaf,10 wood fibre,11 sawdust,12 and corn cob.13 Microporous polymers, such as polypropylene14 and polyurethane foams,15 and polydimethylsiloxane (PDMS) sponges16 show excellent oil adsorption capacity due to their large surface area and oleophilic and hydrophobic properties. Carbon-based materials, such as activated carbon,17–19 carbon nanotubes,20–22 and graphene23–26 have recently become the focus of interest for oil remediation due to its outstanding chemical, mechanical and electronic properties. In particular, graphene-based polymer composites have shown infinite functionalization and modification possibilities of the starting material to form highly robust architectures for environmental remediation.9,15,27,28
Graphene is a two-dimensional (2-D) atomic thick sheet of carbon atoms that are arranged in a honeycomb lattice. The unique structure of graphene enables it to exhibit excellent adsorption properties, including large surface area (2630 m2 g−1), low bulk density and hydrophobicity. These properties have highlighted its potential to address oil contamination and adsorption problems.29 Three dimensional (3-D) graphene microstructures have been developed to retain the large surface area of the 2-D graphene sheets that tend to irreversibly agglomerate and restack due to the Van der Waals interactions between the carbon atoms and pi–pi stacking.30
PDMS is one of the widely studies polymer in the field of biomedical science and material engineering. The Si–O backbone of the PDMS endows it with a broad range of intriguing properties, such as non-toxicity, low bulk density, non-flammability and high flexibility.31 The nature of the bonding and the low intermolecular forces between the side chains attribute to the low surface energy of PDMS, hence giving this polymer superhydrophobicity. Porous PDMS has also attracted attention due to its high porosity and volume capacity, and low cost of fabrication compared to other polymers, which makes it applicable for use in oil remediation, as already shown by various reports.32–36
The aim of this work is to develop a porous, robust 3-D eco-friendly PDMS–graphene sponge by embedding 2-D graphene sheets in an elastomeric PDMS structure. A simple and cost effective method by Choi et al.16 will be used for the fabrication of the PDMS sponge, and the graphene sheets are synthesised from natural graphite rocks. The combination of the starting materials will enhance the hydrophobicity and adsorption capacity of the sponge, and exhibit as an ideal candidate for the efficient separation of oils and organic pollutants, and remove oil droplets from an oil–water mixture. More importantly, the fabricated sponges will increase the robustness of graphene-based aerogels that currently have low mechanical stability, therefore enhancing the applicability of graphene-based sorbents for practical oil remediation.
Experimental
Materials and chemicals
Natural graphite flakes were supplied by a local mining site (Uley, Eyre Peninsula, South Australia) that were milled into a fine powder using a bench top ring mill (Rocklabs). Polydimethylsiloxane (PDMS) prepolymer (Sylgard 184) and curing agent (Sylgard 184) were purchased from Dow Corning Corportaion (USA). Sugar cubes and canola oil were purchased from a local supermarket. Potassium permanganate (KMnO4, Sigma-Aldrich), sulphuric acid (98% H2SO4, Chem-Supply), phosphoric acid (85 w/w%, H3PO4, Chem-Supply), hydrochloric acid (35% HCl, Chem-Supply), ammonium solution (28% NH4OH, Chem-Supply), toulene (Chem-Supply), dimethyfluoride (DMF, Sigma-Aldrich), tetrahydrofuran (THF, Sigma-Aldrich), hexane (Sigma-Aldrich) and gasoline (hardware store) were used directly without further purification. High-purity Milli-Q water (18.2 MΩ) was used throughout the study, unless otherwise stated.Preparation of graphene oxide (GO)
Graphene oxide was prepared by oxidation of natural graphite according to the improved Hummer's method.37 Briefly, a 9:1 mixture of concentrated sulphuric acid and phosphoric acid (240:26 mL) was cooled to 4 °C. Under stirring at room temperature the cooled acid mixture was slowly added to the graphite powder (2 g) and potassium permanganate (12 g) then heated to 50 °C for about 12 h, forming a thick paste. The reaction was cooled to room temperature and poured onto ice (300 mL) with 30% hydrogen peroxide (2 mL). The mixture was then washed with distilled water and hydrochloric acid (32%) followed by repeated washing with ethanol. For each successive wash the product was centrifuged at 4200 rpm for 2 h. The obtained GO was vacuum dried overnight at room temperature.
Preparation of graphene
The solvothermal process was used for the reduction of GO to graphene.38 200 mg of GO was fully dispersed in 200 mL of DI water and the mixture was adjusted to pH 10–11 using NH4OH solution. The mixture was transferred to a Teflon container and sealed in an autoclave before placing in a 180 °C oven for 6 h to yield a graphene solution. After the reduction process the graphene solution was centrifuge at 4200 rpm for 60 min to remove the water and freeze dried (EL VirTis SP Scientific, Scitek, −15 °C, 600 μBar) to obtain the graphene powder.Synthesis of PDMS sponges
PDMS sponges were prepared by the sugar templating method.16 A mixture of the PDMS prepolymer and curing agent in the ratio of 10:1 by weight (40:4 g) was prepared in a petri dish. The petri dish was placed in a vacuum chamber to degas the mixture until no bubbles were observed. The sugar cones (diameter = 15 mm, height = 17 mm) were then placed in the mixture and degassed in the vacuum chamber for approx. 1 h to allow the PDMS mixture to fully permeate into the sugar templates by capillary forces. The petri dish containing the sugar templates with the absorbed PDMS mixture was then removed and cured in a 120 °C oven for 12 min. After the curing process, the sugar templates were removed from the petri dish and soaked in a beaker of warm water (~27 °C) to leach the sugar from the PDMS. To shorten the leaching time, the beaker containing the sugar templates was placed in a sonication bath at 35 °C for 30–60 min. Once the sugar was completely removed from the templates, they were air dried at room temperature to obtain the corresponding PDMS sponge.
Preparation of PDMS–graphene sponges
The PDMS–graphene sponges were prepared by injecting the graphene solution into the PDMS sponges. Graphene powder (50 mg) was mixed with DMF (20 mL) and ultrasonicated for 15 min until the powder was homogeneously dispersed in the solution. The particle solution was injected into the PDMS sponge by a plastic syringe until it was fully absorbed. The PDMS–graphene sponge was then air dried at room temperature on a petri dish. This process was repeated three times.Characterisation of materials
Scanning electron microscopy (FE-SEM, Quanta 450, FEI, USA) was conducted to confirm the structure and morphology of the PDMS and PDMS–graphene sponges. To investigate the graphitic structure of graphite, GO and graphene the materials were analysed by Raman spectroscopy (LabRAM Evolution, Horiba Jvon Yvon, Japan) using a 532 nm laser (mpc 3000) as the excitation source. A 100× objective was used with a confocal hole size of 300 μm. The laser power was kept at or below 50%. A scan was collected for each sample in the spectral range of 500–3500 cm−1 using an integration time of 10 s for 3 accumulations. Samples were deposited on glass slides in solid form without any solvent. All spectra shown are from raw and unprocessed data. Thermal decomposition of graphite, GO and graphene was performed under air using a thermogravimetric analyser (TGA, Q500, TA Instruments, USA) where the samples were heated to 1000 °C at a flow rate of 10 °C min−1. Dynamic light scattering (Mastersizer 2000, Malvern, Australia) was also collected for the graphite powder in DI water. An average of three measurements was taken. Under ambient conditions, contact angle measurements were performed using the Attension Theta Optical tensiometer (KSV Instruments, Finland) system in sessile drop mode. For sample preparation, the PDMS and PDMS–graphene sponges were cut with a sharp blade to obtain a flat slice of the sponge, which was then stuck on a clean microscope slide with double-sided tape. The substrate was placed on the sample stage and a drop of water (2 μL) was dispensed automatically on the sponge sample from the micro-syringe. The image of the water droplet was recorded right at the instant when the drop touched the surface of the sponge with a FireWire camera (55 mm focus length). Curve fitting and data analysis was determined by using the OneAttension software installed on the computer. Three different positions on the aerogel were measured and an average was taken. The specific surface areas (SSA) of the sponges were determined by the methylene blue (MB) adsorption method by UV–vis spectroscopy (Shimadzu UV-1601, Japan).39 A known mass of the sponge was placed into a MB solution of standard concentration (i.e. 200 ppm). The suspension was sonicated for 2 h and then continuously stirred for 24 h to reach the adsorption–desorption equilibrium of MB. An aliquot was taken from the suspension and centrifuged to remove any suspended material. The MB concentration was determined by measuring the supernatant with UV–vis at a wavelength of 665 nm compared with the initial standard concentration. The SSA can be calculated from the amount of adsorbed MB according to the following equation:where NA represents Avogadro number (6.02 × 10²³ mol−1), AMB (m2) is the covered area of per MB molecules (typically assumed to be 1.35 nm2), V (L) is the volume of MB solution, MMB (g mol−1), is the relative molecular mass of MB, mS (g) is the mass of the sample, and C0 (mg L−1) and Ce (mg L−1) are the initial and equilibrium concentrations of MB, respectively.
Adsorption capacity and reusability test of PDMS–graphene sponges
The measurement of oil adsorption capacity was conducted based on ASTMF726-99: Standard Test Method for Sorbent Performance of Adsorbents. To investigate the adsorption performance of the PDMS–graphene sponges, various oils were tested, such as commercial petroleum products (gasoline), fats (canola oil), including some organic solvents, such as toluene, hexane, dimethyfluoride (DMF), and tetrahydrofuran (THF).Batch adsorption
The performance of the PDMS–graphene sponges were evaluated in three types of batch adsorption systems. They were (1) an oil (or organic), (2) oil–water, and (3) oil–seawater. For oil adsorption tests, oils and organic solvents (50 mL) were poured into 100 mL beakers. The weight of the sponges was recorded before immersing in the oil, which removed after 30 min ± 5 s of immersing and allowed to drain for a few minutes. The saturated sponge was then transferred to a pre-weighed container and weighed immediately. In the oil–water system adsorption tests, the sponges were immersed in a mixture of oil and distilled water (50 mL of each). The sponges were also removed after a particular time of immersing and transferred to a pre-weighed container to weigh. The oils and organic solvents were stained with Sudan red 5B to facilitate evaluation by the naked eye. The performance of the sponges was also tested by replacing DI water with natural seawater (Glenelg, Adelaide) to investigate if the water quality in the oil–seawater system affected the adsorption capacity of the sponges. To assess the reusability and regeneration of the used adsorbent, the saturated sponges were manually squeezed to remove the oil, and air dried for 10 min for use in the next oil adsorption test. The cycle of adsorption and recovery was repeated to characterise the recycling performance of the different sponges.The adsorption capacity (Q) was calculated using the weight (wt) of sponge before and after adsorption as follows:
In addition, the adsorption capability of the PDMS–graphene sponges was evaluated in a fourth batch adsorption system but in an emulsified oil–water mixture using toluene. Three toluene solutions (1, 5 and 10%) were prepared by sonicating the mixture for 2 h to facilitate the formation of a cloudy organic emulsion system. The adsorption performance of the sponges was determined by calculating the total area of the emulsions present as a function of time using a Nikon inverted microscope (Nikon Eclipse Ti, China). The experiment was performed as follows: firstly, a droplet of the emulsified toluene mixture was placed on a clean glass microscope slide where the emulsions were imaged under the microscope. This image was taken as time zero (t = 0). The PDMS–graphene sponge was then placed in the emulsified toluene mixture for 10 min before another droplet of the mixture was collected and imaged under the microscope. This procedure was then repeated every hour for a total of 5 h. Images taken with the microscope were analysed using Image J to calculate the total area of emulsions present at the different time intervals. All adsorption experiments were conducted three times and an average value of adsorption capacity was calculated.
Continuous adsorption
To demonstrate the adsorption performance of the PDMS and PDMS–graphene sponges to remove oil from the water in a continuous regime a vacuum system was set up (see ESI,† Fig. S1). The sponges were inserted at one end of a plastic tube (diameter of 1 cm) and the other end was connected to a collection flask attached to a vacuum pump through a tube. Two sets of experiments were performed: water–oil model solution where the oil is on top of the water surface and when the oil is mixed with the water under high turbulence, which mimic real environmental conditions. The stirring of the water–oil solution was performed by using a magnetic stirrer during the continuous adsorption process. The cumulative adsorption was only determined for the non-turbulence hexane–water system by considering the adsorbed volume of hexane until the sponge loss its efficiency.Results and discussion
Characterisation of graphite, GO and graphene
A photo of the natural graphite rock used in this work for the preparation of GO is presented in Fig. 1a. The amorphous natures of the GO sheets before reduction can be seen in Fig. 1b, whereas wrinkled and paper-like sheets were observed for reduced GO (rGO, Fig. 1c). The changes in the structural features of GO to rGO is due to the removal of the oxygen functional groups. During the reduction process the rGO is partially repaired from sp3 hybridized carbon atoms dominating in GO to newly formed crystalline sp2 hybridized carbons. The number of the sp2 domains has increased but the sizes of the sp2 domains have decreased.40 The Raman spectra also supports the structural change before and after the reduction of GO (Fig. 1d). As expected, GO displays a D band at ~1330 cm−1 and G band at ~1590 cm−1, which is caused by the defects and disorders of the oxidised sheets, and the vibration of sp2-bonded carbon atoms in the two-dimensional (2-D) hexagonal lattice, respectively. However, compared to graphite, this type of D band is absent and a prominent peak around 2700 cm−1 (2D) is observed, which is due to the two phonon lattice vibrations in the graphitic structure.41 In the Raman spectrum of GO after reduction to graphene the G band is broadened and shifted to ~1600 cm−1. Also graphene shows a slight increase in the D/G intensity ratio (0.86) than GO (0.84). The intensity ratio of the D and G band (ID/IG) in the Raman spectrum is a measure of disordered carbon. An increase of ID/IG suggests a decrease in the average size but an increase in the number of sp2 domains with the reduction of GO to graphene.42 TGA measurements provide further evidence of the preparation of GO and reduction to graphene (Fig. 1e). Graphite is highly stable up to 800 °C, as expected, whereas GO is thermally unstable. The first mass loss that takes place around 200 °C is attributed to the removal of adsorbed water. The next mass loss is due to the decomposition of labile oxygen functional groups present in the material, and then finally over the temperature range above 600 °C, the removal of more stable oxygen functionalities.43 On the other hand, the removal of the labile oxygen functional groups by the chemical reduction results in a greater thermal stability for the reduced GO, and 20% of the mass was lost at around 200 °C. Therefore, confirming the successful oxidation of graphite to GO, and reduction of GO to graphene. | ||
| Fig. 1 (a) A digital photograph of the graphite rock. (b–c) TEM images of GO before and after the solvothermal reduction, respectively. (c) Raman spectra of graphite, GO and graphene (rGO) showing G, D and 2D bands. (d) TGA spectra of graphite, GO and rGO. | ||
A three-dimensional (3-D) white and spongy PDMS sponge was obtained after the sugar templating process (Fig. 2a inset). SEM images of the cross-sectional area of the PDMS sponge shows a macroporous and interconnected framework as shown in Fig. 2a. The walls of the pores are somewhat smooth when observed at high magnification (Fig. 2b). Some wrinkles and protrusion can be seen on the edges of the walls, which are caused by the removal of the sugar particles. In contrast, the PDMS–graphene sponge is black (Fig. 2c inset) and thin layers of stacked graphene sheets is observed on the surface of the PDMS structure. No difference in the morphology is observed from the inner surface or the side walls of the structure of the sponges. The prepared sponges are very light, flexible and can recover its original shape upon squeezing.
 | ||
| Fig. 2 SEM images of PDMS (a–b) and PDMS–graphene sponges (c), respectively. Inset of (a) and (c) shows the photos of the PDMS and PDMS–graphene sponges, respectively. | ||
Batch adsorption
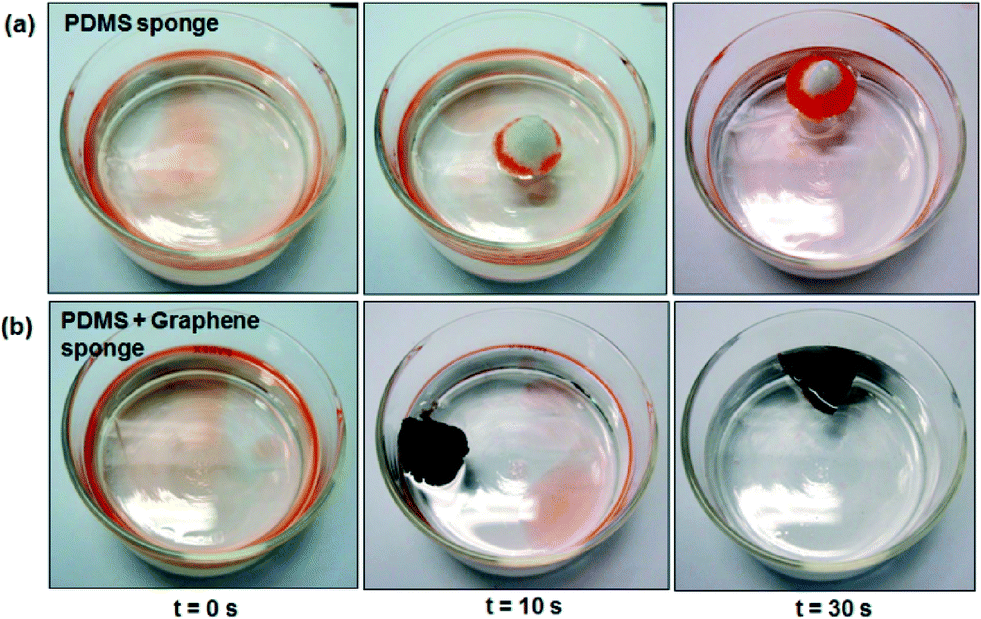 | ||
| Fig. 3 Digital photographs showing the adsorption of gasoline on the water surface using (a) PDMS and (b) PDMS–graphene sponge at different times (0, 10 and 30 s). | ||
The adsorption capacity (Q) was used to assess the performance of the prepared sponges in the different oil–water systems for several types of oil and organics and the results are compiled in Fig. 4a–b. The results show that the adsorption capacity of the PDMS–graphene sponge ranges from 220 to 800 wt% depending on the type of oil and organics used. Compared with other graphene-based materials, such as graphene aerogel, exfoliated graphite sponge and graphene/polyurethane (PU) sponge the adsorption capacity of the PDMS–graphene sponge is much lower. However, compared with other oil adsorbents tested in the literature using gasoline for comparison, such as kenaf (3.9 g/g),44 activated carbon (2.0 g/g),45 PDMS sponge (4.5 g/g) and gold nanoparticle/PDMS foam,34 the PDMS–graphene sponge (6.5 g/g) used in this study exhibited greater performance. Furthermore, the adsorption capacity of the sponges in the tested oil–water systems decreased slightly than in the pure oil systems due to the competitive adsorption of water, which agrees with the findings of Li et al.15 for their graphene/PU foams. Furthermore, the performance of the prepared sponges was also evaluated in seawater. Fig. 4c shows the adsorption capacity of the tested systems and the results show that the water quality does not affect the adsorption performance of the PDMS and PDMS–graphene sponges. Although, the slight decrease in the oil adsorption (2–4%) in the seawater system compared to the DI water system can be due to the presence of competing ions and foreign matter. In addition, swelling of the PDMS and PDMS–graphene sponges were observed during the adsorption tests similar to the PDMS sponges prepared by Zhao et al.36 The volume of the sponges gradually increased with time when they were immersed in oil and organics, such as, gasoline, toluene, THF and DMF. Although, the sponges increased in size (Fig. 4e) the swelling did not influence the sponge's adsorption properties.
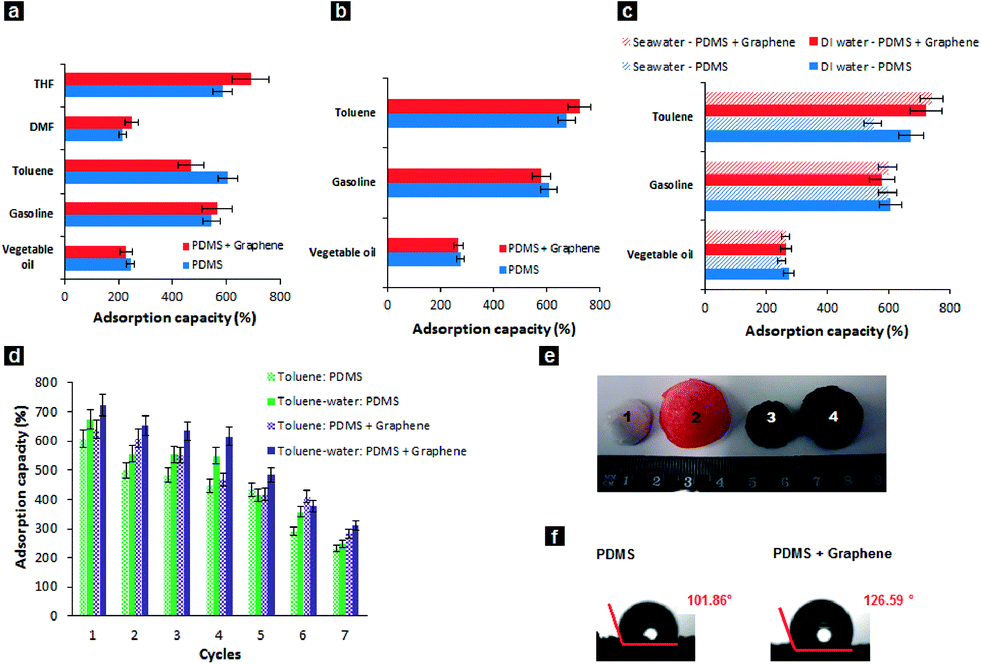 | ||
| Fig. 4 Adsorption capacity of sponges in (a) pure oil, (b) oil–water, and (c) oil–seawater systems. (d) Adsorption capacity of the sponges after 4 cycles in the toluene system. (e) Digital photograph showing the PDMS (1, 2) and PDMS–graphene (3, 4) sponges before swelling and after being immersed in gasoline, respectively. (f) Water contact angle measurements of PDMS and PDMS–graphene sponges. | ||
For practical oil remediation, the recyclability and recoverability of adsorbents is critical. Due to the elastic nature of the PDMS sponge, the adsorbed oil can be removed and reused by manually squeezing the sponge. The PDMS–graphene sponge showed good recycling performance and maintained its adsorption capacity (~60–80% of the first maximum) after five cycles of testing in the toluene system (used as the model) due to its robust porous network as presented in Fig. 4d. The decrease in adsorption capacity could be due to traces of oil still trapped within the pores of the sponge, which could not be all simply removed by squeezing the sponges. Importantly, the high performance for the separation of oil and water and the mechanical robustness of the PDMS sponge depends on the structure of the template. Different types and sizes of the sugar particles used in the formation of the PDMS sponge will affect the adsorption capacity of the adsorbent.16 The preparation process of the PDMS-based adsorbents is also an influencing factor.
Nevertheless, the prepared PDMS–graphene sponge has both hydrophobic and oleophilic properties, which is essential for a good oil adsorbent. Fig. 4f shows that the water contact angle of the PDMS and PDMS–graphene sponge is about 101.9 and 126.6°, respectively. The larger hydrophobicity of the PDMS–graphene sponge is due to the influence of the graphene sheets, which has increased the roughness of the PDMS surface. On the contrary, when an oil drop was placed on the sponges, the droplets immediately spread and penetrated into the sponge (contact angle ~0°, Movie S1†), indicating the hydrophobic and oleophilic property and selective oil adsorption of the sponge. The combined oleophilicity and hydrophobicity of the PDMS–graphene sponge is attributed to the low surface energy and the porous morphology of the PDMS and graphene material.
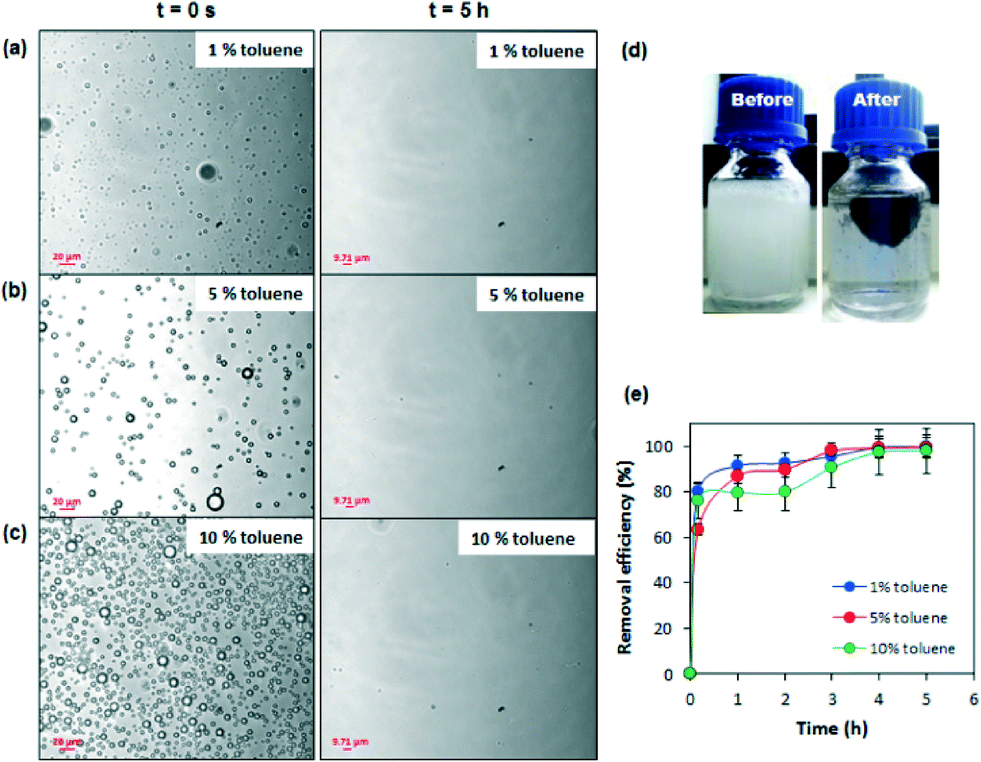 | ||
| Fig. 5 (a–c) Optical images of a 1, 5 and 10% toluene-in-water emulsion system, before (time = 0 s) and after adsorption (time = 5 h) for a PDMS–graphene sponge, respectively. (d) Digital photographs of the 1% toluene-in-water emulsion system before and after adsorption. (e) Removal efficiency of toluene with time during the adsorption for the different toluene-in-water systems. | ||
Furthermore, we analysed the adsorption capacity in relation with the density of oil and organic solvents and found that the adsorption is increasing by increasing the density of the material (results not shown). The results are in agreement with previous studies suggesting that organic materials with higher density have larger adsorption.46 In the adsorption experiments, oils and organic solvents attract to the hydrophobic sponge based on their same nature. Meanwhile, they also start to diffuse in the macropores of the porous sponge. Therefore, liquids with higher viscosity and surface tension will resist the molecular disruption and refuse diffusion toward the porous sponge as the surface molecules try to pack closer together. The decrease in the gasoline adsorption seen in Fig. 4a was lower than the other organic solvents because of its lower density. Although the volume of gasoline absorbed by the sponge is higher due to its greater viscosity and lower surface tension (see Table 1) compare to the other organic solvents but, due to its lower density the weight gain of the sponge is less than the other materials.
| Solvent | Viscosity (cP) | Surface tension (mN/m) |
|---|---|---|
| Gasoline | 0.6 | 21 |
| DMF | 0.92 | 37.10 |
| Toluene | 0.585 | 28.40 |
| THF | 0.48 (25 °C) | 26.40 |
| Vegetable oil | 57 (25 °C) | 34.0 |
The selectivity of the PDMS–graphene sponge for oil adsorption is also attributed to the high degree of π electron delocalization conjugated system on the surface of the graphene, due to the sp2 hybridization of the carbon atoms after hydrothermal reduction of GO. Furthermore, the pore structures of adsorbents are playing an important role in the adsorption, as oil adsorption mainly occur in larger pores, and the macroporous structure of the sponge assisted in the oil adsorption.47,48
Continuous adsorption
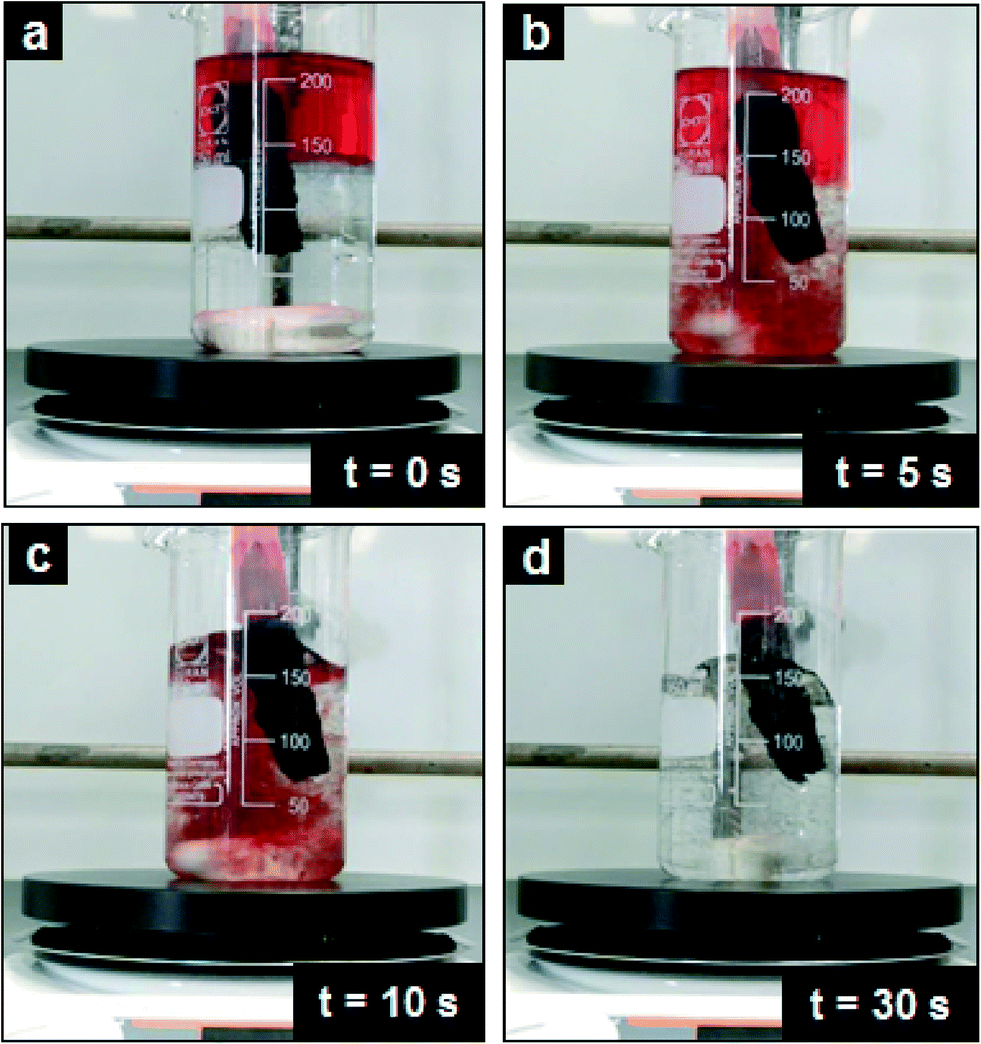
The continuous removal of oil from water using a pressure driven system (e.g. vacuum pump) could also be demonstrated. For these experiments, the length of the sugar template for the PDMS–graphene sponges was increased from 17 mm to 55 mm. The sequential images taken during the continuous adsorption experiment with no disturbance to the hexane and water system is illustrated in Fig. 6. As the vacuum pump is turned on, the hexane on the water surface is selectively removed from the water at a fast rate (Movie S2†). The water level in the beaker is unaffected and hexane can be continuously added to the system and again filtered by the PDMS–graphene sponge. Extraordinarily, a total of 4.5 L of hexane could be continuously removed in 30 min before the PDMS–graphene sponge began to lose its adsorption efficiency. During the 30 min period the collected hexane contained no water (Movie S3†).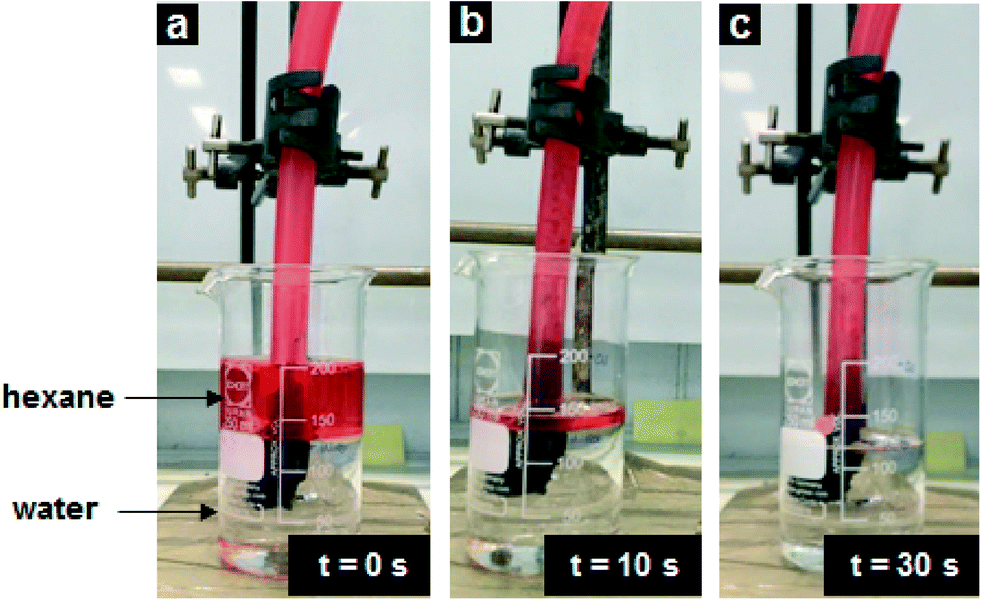 | ||
| Fig. 6 Digital photographs illustrating the progress of the continuous removal of hexane from a non-turbulent oil–water system. | ||
Under real environmental conditions, such as in a stream, river and the sea, the bulk water is always in motion and not stationary as the previous experiment (Fig. 6). Therefore, as an example, this experiment was repeated under high turbulent conditions in order to mimic the real environmental conditions. To create this turbulent effect, the hexane–water system was stirred vigorously with a magnetic stirring bar to induce the formation of hexane droplets in the water before the vacuum pump was turned on (Movie S4†). The hexane droplets could be continuously removed from the water in less than 30 s under turbulence conditions as shown in Fig. 7. Similarly, the water in the system was undistributed and not adsorbed by the PDMS–graphene sponge as in the non-turbulent system. This demonstration shows that the PDMS–graphene sponges can be recycled and reused for the removal of oil and organics for practical applications.
 | ||
| Fig. 7 Digital photographs illustrating the progress of the continuous removal of hexane from a turbulent oil–water system using a magnetic stirring plate. | ||
Importantly to note, all the above experiments are performed with low viscosity oils. However, in most oil spill accidents, the oil floating on the ocean surface is crude oil, which is of high viscosity. Therefore the experiment for the non-turbulent oil–water system was repeated using crude oil (Movie S5†). The results show that the PDMS–graphene sponge is able to continuously separate crude oil from the water but at a slower rate, which is to be expected due to the higher viscosity of the oil.
Conclusions
Porous, eco-friendly 3-D structures of PDMS–graphene sponges with superhydrophobic and oleophilic properties were successfully prepared. The sponge shown excellent adsorption performance for different types of oil and water mixtures, and the reusability of the sponge could be demonstrated in the continuous adsorption experiments with and without turbulence. A sufficient removal of 4.5 L of hexane in 30 min could be achieved in the non-turbulence pressure driven oil–water system. Although, the saturated oil PDMS–graphene sponges could not all be efficiently removed by manual means (i.e. squeezing) during the batch adsorption experiments optimisation of the starting materials and sugar templating procedure would solve this problem and thus enhance the mechanical robustness of the sponge while maintaining its high adsorption performance. However, the sponges shown great separation of oil and water in the continuous adsorption experiments, thus offering great potential for these adsorbents in the removal of oil spills and organic contaminants in the marine and aquatic systems.Acknowledgements
The authors acknowledge the financial support of the Australia Research Council (FT 110100711), the University of Adelaide, and Industrial partner Valence Industries Ltd.Notes and references
- United States Coast Guard. On scene coordinator report deepwater horizon oil spill, 2011, pp. 1–244 Search PubMed.
- M. Fingas, The basics of oil spill cleanup, CRC Press, Boca Raton, 3rd edn, ch. 6–11, 2012 Search PubMed.
- M. O. Adebajo, R. L. Frost, J. T. Kloprogge, O. Carmody and S. Kokot, J. Porous Mater., 2003, 10, 159–170 CrossRef CAS.
- C. Teas, S. Kalligeros, F. Zanikos, S. Stournas, E. Lois and G. Anastopoulos, Desalination, 2001, 140, 259–264 CrossRef CAS.
- P. F. Alvarez, J. Vila, J. M. G. Fernandez, M. Grifoll and J. M. Lema, J. Hazard. Mater., 2006, B137, 1523–1532 CrossRef.
- S. Cappello, R. Denaro, M. Genovese, L. Giuliano and M. M. Yakimov, Microbiol. Res., 2006, 162, 185–190 CrossRef PubMed.
- M. M. Khin, A. S. Nair, V. J. Babu, R. Murugan and S. Ramakrishna, Energy Environ. Sci., 2012, 5, 8075–8109 CAS.
- R. Asadpour, N. B. Sapari, Z. Z. Tuan, H. Jusoh, A. Riahi and O. K. Uka, Caspian J. Appl. Sci. Res., 2013, 2, 46–58 Search PubMed.
- K. C. Kemp, H. Seema, M. Saleh, N. H. Le, K. Mahesh, V. Chandra and K. S. Kim, Nanoscale, 2013, 5, 3149–3171 RSC.
- T. R. Annunciado, T. H. D. Sydenstricker and S. C. Amico, Mar. Pollut. Bull., 2005, 50, 1340–1346 CrossRef CAS PubMed.
- A. Bayat, S. F. Aghamiri, A. Moheb and G. R. Vakili-Nezhaad, Chem. Eng. Technol., 2005, 28, 1525–1528 CrossRef CAS.
- F. Yong and D. D. L. Chung, Appl. Clay Sci., 2011, 53, 634–641 CrossRef PubMed.
- B. A. Olufemi, L. A. Jimoda and N. F. Agbodike, Asian J. Appl. Sci. Eng., 2014, 3, 7–19 Search PubMed.
- C. P. Karan, R. S. Rengasamy and D. Das, Indian J. Fibre Text. Res., 2011, 36, 190–200 CAS.
- H. Li, L. Liu and F. Yang, Procedia Environ. Sci., 2013, 18, 528–533 CrossRef CAS PubMed.
- S.-J. Choi, T.-H. Kwon, H. Im, D.-I. Moon, D. J. Baek, M.-L. Seol, J. P. Duarte and Y.-K. Choi, ACS Appl. Mater. Interfaces, 2011, 3, 4552–4556 CAS.
- Y. Nishi, N. Iwashita, Y. Sawada and M. Inagaki, Water Res., 2002, 36, 5029–5036 CrossRef CAS.
- M. J. Ayotamuno, R. B. Kogbara, S. O. T. Ogaji and S. D. Probert, Appl. Energy, 2006, 83, 1258–1264 CrossRef CAS PubMed.
- K. Okiel, M. El-Sayed and M. Y. El-Kady, Egypt. J. Pet., 2011, 20, 9–15 CrossRef CAS PubMed.
- K. Zhu, Y.-Y. Shang, P.-Y. Sun, Z. Li, X.-M. Li, J.-Q. Wei, K.-L. Wang, D.-H. Wu, A.-Y. Cao and H.-W. Zhu, Front. Mater. Sci., 2013, 7, 170–176 CrossRef.
- Z. Shi, W. Zhang, F. Zhang, X. Liu, D. Wang, J. Jin and L. Jiang, Adv. Mater., 2013, 25, 2422–2427 CrossRef CAS PubMed.
- L. Camilli, C. Pisani, E. Gautron, M. Scarselli, P. Castrucci, F. D'Orazio, M. Passacantando, D. Moscone and M. De Crescenzi, Nanotechnology, 2014, 25, 065701–065707 CrossRef CAS PubMed.
- H. Bi, X. Xie, K. Yin, Y. Zhou, S. Wan, L. He, F. Xu, F. Banhart, L. Sun and R. S. Ruoff, Adv. Funct. Mater., 2012, 22, 4421–4425 CrossRef CAS.
- J. Zhao, W. Ren and H.-M. Cheng, J. Mater. Chem., 2012, 22, 20197–20202 RSC.
- M. Iqbal and A. Abdala, Environ. Sci. Pollut. Res., 2013, 20, 3271–3279 CrossRef CAS PubMed.
- S. Kabiri, D. N. H. Tran, T. Altalhi and D. Losic, Carbon, 2014, 80, 523–533 CrossRef CAS PubMed.
- Y. Liu, J. Ma, T. Wu, X. Wang, G. Huang, Y. Liu, H. Qiu, Y. Li, W. Wang and J. Gao, ACS Appl. Mater. Interfaces, 2013, 5, 10018–10026 CAS.
- R. Li, C. Chen, J. Li, L. Xu, G. Xiao and D. Yan, J. Mater. Chem. A, 2014, 2, 3057–3064 CAS.
- A. K. Geim, Science, 2009, 324, 1530–1534 CrossRef CAS PubMed.
- Y. Zhu, S. Murali, W. Cai, X. Li, J. W. Suk, J. R. Potts and R. S. Ruoff, Adv. Mater., 2010, 22, 3906–3924 CrossRef CAS PubMed.
- J. E. Mark, Acc. Chem. Res., 2004, 37, 946–953 CrossRef CAS PubMed.
- I. Park, K. Efimenko, J. Sjöblom and J. Genzer, J. Dispersion Sci. Technol., 2009, 30, 318–327 CrossRef CAS.
- A. Scott, R. Gupta and G. U. Kulkarni, Macromol. Chem. Phys., 2010, 211, 1640–1647 CrossRef CAS.
- R. Gupta and G. U. Kulkarni, ChemSusChem, 2011, 4, 737–743 CrossRef CAS PubMed.
- A. K. Kota and A. Tuteja, NPG Asia Mater., 2013, 5, 1 Search PubMed.
- X. Zhao, L. Li, B. Li, J. Zhang and A. Wang, J. Mater. Chem. A, 2014, 2, 18281–18287 CAS.
- D. C. Marcano, D. V. Kosynkin, J. M. Berlin, A. Sinitskii, Z. Sun, A. Slesarev, L. B. Alemany, W. Lu and J. M. Tour, ACS Nano, 2010, 4, 4806–4814 CrossRef CAS PubMed.
- H. Wang, J. T. Robinson, X. Li and H. Dai, J. Am. Chem. Soc., 2009, 131, 9910–9911 CrossRef CAS PubMed.
- Y. Yukselen and A. Kaya, Eng. Geol., 2008, 102, 38–45 CrossRef PubMed.
- T. Kuila, S. Bose, A. K. Mishra, P. Khanra, N. H. Kim and J. H. Lee, Prog. Mater. Sci., 2012, 57, 1061–1105 CrossRef CAS PubMed.
- L. M. Malarda, M. A. Pimenta, G. Dresselhaus and M. S. Dresselhaus, Phys. Rep., 2009, 473, 51–87 CrossRef PubMed.
- A. C. Ferrari, J. C. Meyer, V. Scardaci, C. Casiraghi, M. Lazzeri, F. Mauri, S. Piscanec, D. Jiang, K. S. Novoselov, S. Roth and A. K. Geim, Phys. Rev. Lett., 2006, 97, 187401–187404 CrossRef CAS.
- J. I. Paredes, S. Villar-Rodil, A. Martínez-Alonso and J. M. D. Tascón, Langmuir, 2008, 24, 10560–10564 CrossRef CAS PubMed.
- S. J. Lips and J. G. Van Dam, Kenaf fibre crop for bioeconomic industrial development, Kenaf: A Multi-purpose crop for several industrial applications, Springer, London, 2013 Search PubMed.
- T. C. Voice, D. Pak, X. Zhao, J. Shi and R. F. Hickey, Water Res., 1992, 26, 1389–1401 CrossRef CAS.
- M.-Q. Zhao, J.-Q. Huang, Q. Zhang, W.-L. Luo and F. Wei, Appl. Clay Sci., 2011, 53, 1–7 CrossRef CAS PubMed.
- X. Gui, J. Wei, K. Wang, A. Cao, H. Zhu, Y. Jia, Q. Shu and D. Wu, Adv. Mater., 2010, 22, 617–621 CrossRef CAS PubMed.
- M. Toyoda, Y. Nishi, N. Iwashita and M. Inagaki, Desalination, 2003, 151, 139–144 CrossRef CAS.
Footnote |
| † Electronic supplementary information (ESI) available: Figure of vacuum system setup for continuous oil removal from water; movies for continuous removal of pure water, hexane in water, and crude oil in water under non-turbulent conditions; movie for continuous removal of hexane in water under turbulent conditions; movie illustrating hydrophobic and oleophilic property of PDMS–graphene sponge. See DOI: 10.1039/c5ew00035a |
| This journal is © The Royal Society of Chemistry 2015 |