
Research highlights: natural passive samplers – plants as biomonitors
Vivian S.
Lin
*
Institute of Biogeochemistry and Pollutant Dynamics, ETH Zurich, CH-8092, Zurich, Switzerland. E-mail: vivian.lin@usys.ethz.ch
First published on 18th May 2015
Abstract
In the past decade, interest in boosting the collection of data on environmental pollutants while reducing costs has spurred intensive research into passive samplers, instruments that monitor the environment through the free flow of chemical species. These devices, although relatively inexpensive compared to active sampling technologies, are often tailored for collection of specific contaminants or monitoring of a single phase, typically water or air. Plants as versatile, natural passive samplers have gained increased attention in recent years due to their ability to absorb a diverse range of chemicals from the air, water, and soil. Trees, lichens, and other flora have evolved exquisite biological features to facilitate uptake of nutrients and water from the ground and conduct gas exchange on an extraordinary scale, making them excellent monitors of their surroundings. Sampling established plant specimens in a region also provides both historical and spatial data on environmental contaminants at relatively low cost in a non-invasive manner. This Highlight presents several recent publications that demonstrate how plant biomonitoring can be used to map the distribution of a variety of pollutants and identify their sources.
Biomonitoring
Monitoring chemical species in the environment over time is essential to providing insight into the sources, distribution, and fate of pollutants. Biomonitoring, the analysis of chemicals present in living organisms, has been used for many years to assess the amounts of inorganic and organic contaminants in the environment. Microorganisms, plants, and animals, including humans, have been used as biomonitors. Important considerations for development of biomonitoring methods include pollutant toxicity to the biomonitor organism, biochemical degradation of the contaminant, differences in accumulation across different species, access to unexposed specimens as controls, and consideration for the growing season during which samples are collected.1Plants such as trees uptake chemicals from the air, water, and substrate in which they grow, making them appealing subjects of study (Fig. 1). Trees with deep roots and large canopies have the ability to sample large volumes of soil and air. Furthermore, analyzing multiple specimens in an area can provide useful spatial information. The solubility, size, and stability of different pollutants affect how they are taken up and transported within growing plants. We highlight several recent research articles that employ biomonitoring techniques to quantify chemical pollutants and identify their likely origins, with a focus on plants as biomonitors—the use of trees, lichens, and other plant life to map out the distribution of contaminants in water, soil, and air.1
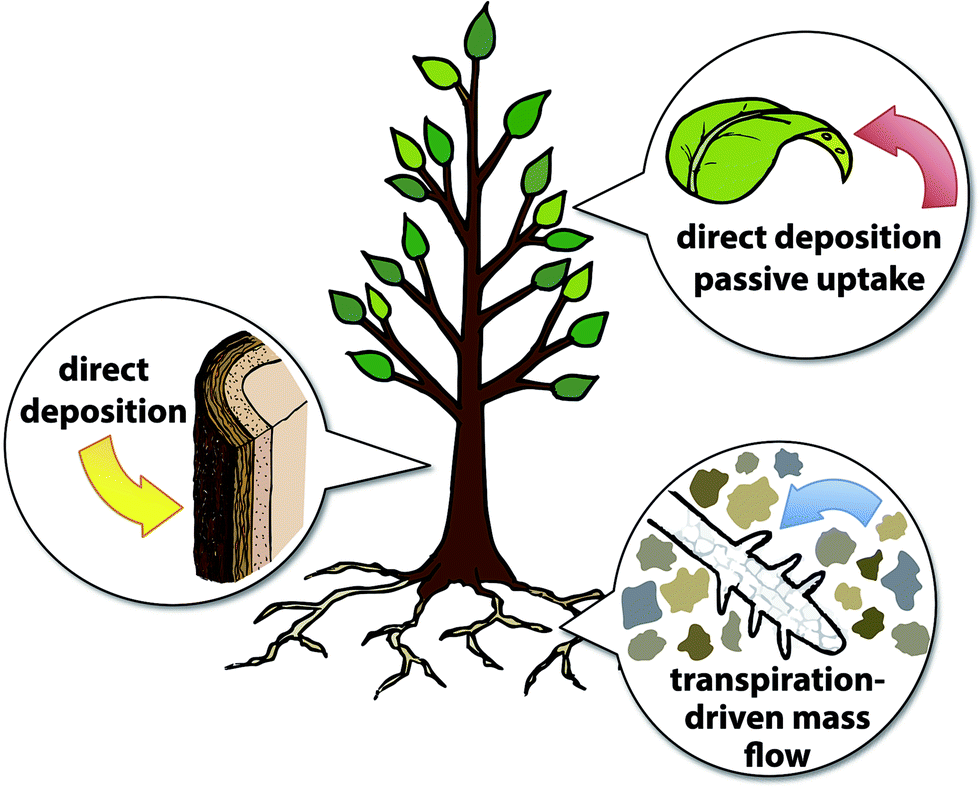 | ||
| Fig. 1 Major mechanisms by which plants can accumulate environmental contaminants. Airborne pollutants such as volatile organics and particulate matter may passively diffuse into the leaves during gas exchange or be directly deposited onto plant surfaces, including leaves and bark. Water-soluble metals and ionic species, leachates, and pesticides in soil and water can be taken up through the roots. | ||
Lichens and trees as passive samplers of inorganic contaminants
For aerosols, particulate matter, and volatile chemical pollutants in the air, plants act as passive samplers—they take up contaminants from the air via the free flow of chemical species,2 rather than via active transport. Inorganic pollutants, such as heavy metals and radioactive species can associate with particulate matter in the atmosphere and can be deposited directly onto the surfaces of plants or taken up passively through leaf stomata.3Two research groups used lichens as biomonitors for identifying and mapping sources of inorganic pollutants. Lichens are favored for many biomonitoring studies due to their longevity, slow growth rate, and ability to survive in a wide range of ecosystems, including harsh environments.4,5 Recent work by Długosz-Lisiecka and Wróbel showed that lichens and mosses can be used to monitor polonium-210 levels in an urban area.6210Po is a radioactive metal isotope that is released into the atmosphere primarily through soil resuspension and high-temperature industrial processes, such as coal combustion. A survey of Lodz, a densely populated city in central Poland, was conducted to examine 210Po accumulation in several species of mosses and lichens. The lichen Hypogymnia physodes showed the highest levels of 210Po, although it was not present in areas with the highest 210Po concentrations. Contamination factors measured for the selected biomonitors showed that the highest levels of 210Po were observed in biomonitors growing near coal power plants and nearest the Old Town region, where domestic furnace use is expected to be highest. Długosz-Lisiecka and Wróbel's work highlights the utility of data gathered from biomonitors to map contaminant levels in an urban region and identify probable sources.
Lichens were also featured in a recent publication by Barros et al. on monitoring atmospheric sulfur emissions and sources. Gaseous sulfur species such as SO2 are released into the atmosphere naturally by volcanic activity as well as by industrial processes such as burning of sulfur-containing ores and fuel. SO2 itself is toxic and forms sulfuric acid upon dissolving in water, leading to acid rain when present at sufficient concentrations. Barros et al. examined sulfur isotope concentrations in lichens and developed an analysis method to differentiate between anthropogenic emissions of sulfur and naturally occurring sulfur species.7 Using the correlation between isotopic ratios of 34S (δ34S) and distance to the sea, the authors could detect values that experienced additional influence from anthropogenic sources (Fig. 2a). Displaying the collected biomonitor data according to this model produced a heat map of sulfur distributions in an industrial region on the coast (Fig. 2b). Human activity such as major cities, main roads, and power plants were clearly visible in hotspots, while areas with greater ocean influence were also revealed; treatment of the data in this manner exposed sources of sulfur emissions that were otherwise masked by ocean influence. This analysis method provides a valuable tool to account for natural sulfur emissions and better monitor anthropogenic sources of atmospheric sulfur pollution.
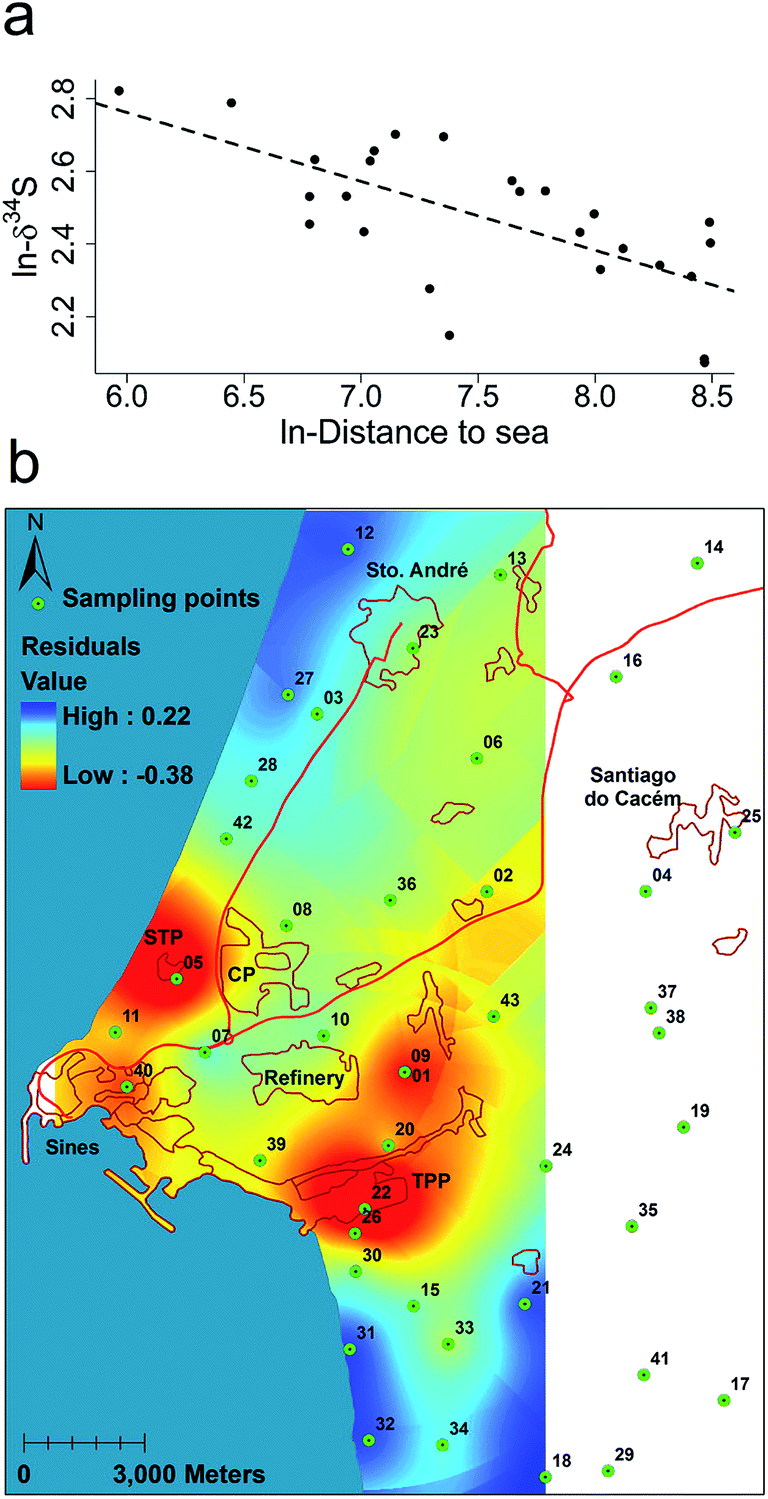 | ||
| Fig. 2 Spatial model of the effect of artificial areas on isotopic values. (a) A logarithmic plot of isotopic values (δ34S) and distance to the sea is shown, providing a model for identifying sulfur sources with increased land use influence. Interpolation of the residuals from (a) was used to produce map (b) showing departures from this model, or from the dominant influence of the sea on δ34S, using ordinary kriging. A sewage treatment plant (STP), coal-fired thermal power plant (TPP), oil refinery, and petrochemical plant (CP) are indicated on the map. Artificial areas and main roads are represented by red lines, green dots are the sampling points and main cities and industries are labeled. Cool colors (blue) suggest a greater marine influence, while warm colors (red) indicate additional influence from human activities. Reprinted (adapted) with permission from C. Barros, P. Pinho, R. Durão, S. Augusto, C. Máguas, M. J. Pereira, and C. Branquinho, Environ. Sci. Technol., 2015, 49, 2222–2229. Copyright 2015 American Chemical Society. | ||
Trees as biomonitors for persistent organic pollutants
Persistent organic pollutants (POPs) such as polyaromatic hydrocarbons (PAHs) and polybrominated diphenyl ethers (PBDEs) can also make their way into plants directly through deposition onto plant surfaces or passively through gas exchange in leaves. Adverse health effects of POPs include altered immune and endocrine system function, as well as abnormal neurodevelopment.8 POPs are problematic in the environment due to their lipophilicity and consequent buildup in the fatty tissues of various organisms. Consequently, lipid-rich parts of plants such as leaf cuticles and bark can serve as excellent materials for trapping POPs from the air. Two recent publications focus on the accumulation of POPs in tree tissues to monitor these contaminants in different regions.Odabasi et al. used trees to monitor POPs levels in an industrial area in Turkey.9 Pine trees, due to their widespread distribution, are frequently selected for tree biomonitoring studies. Specimens from two species of pine found at 27 sites in Turkey were sampled. Notably, the authors also measured POPs in the air, tree litter, and soil for comparison with tree tissues that included needles, branch, bark, and tree rings. Medium to high molecular weight compounds were more prominent in soil, litter, and bark compared to low molecular weight species, potentially due to the propensity of these contaminants to partition into the particle-phase vs. gas-phase, respectively. Lighter, more volatile species, generally were transported farther than heavier compounds and were observed to be taken up into needles, branch, and stems. POP levels obtained from tree samples were consistent with measurements taken from passive air samplers.
A recent publication by Hites and coworkers describes in detail how monitoring POPs in tree bark can be used to map out potential sources of these compounds.10 The authors use kriging on previously published data to visualize pollutant distribution on global, regional, and local scales, producing the images in Fig. 3. The article provides historical context for each of the highlighted POPs, with attention to production timelines and atmospheric conditions. This work provides an excellent discussion of how tree biomonitoring can offer detailed spatial information on contaminants and be used to pinpoint sources.
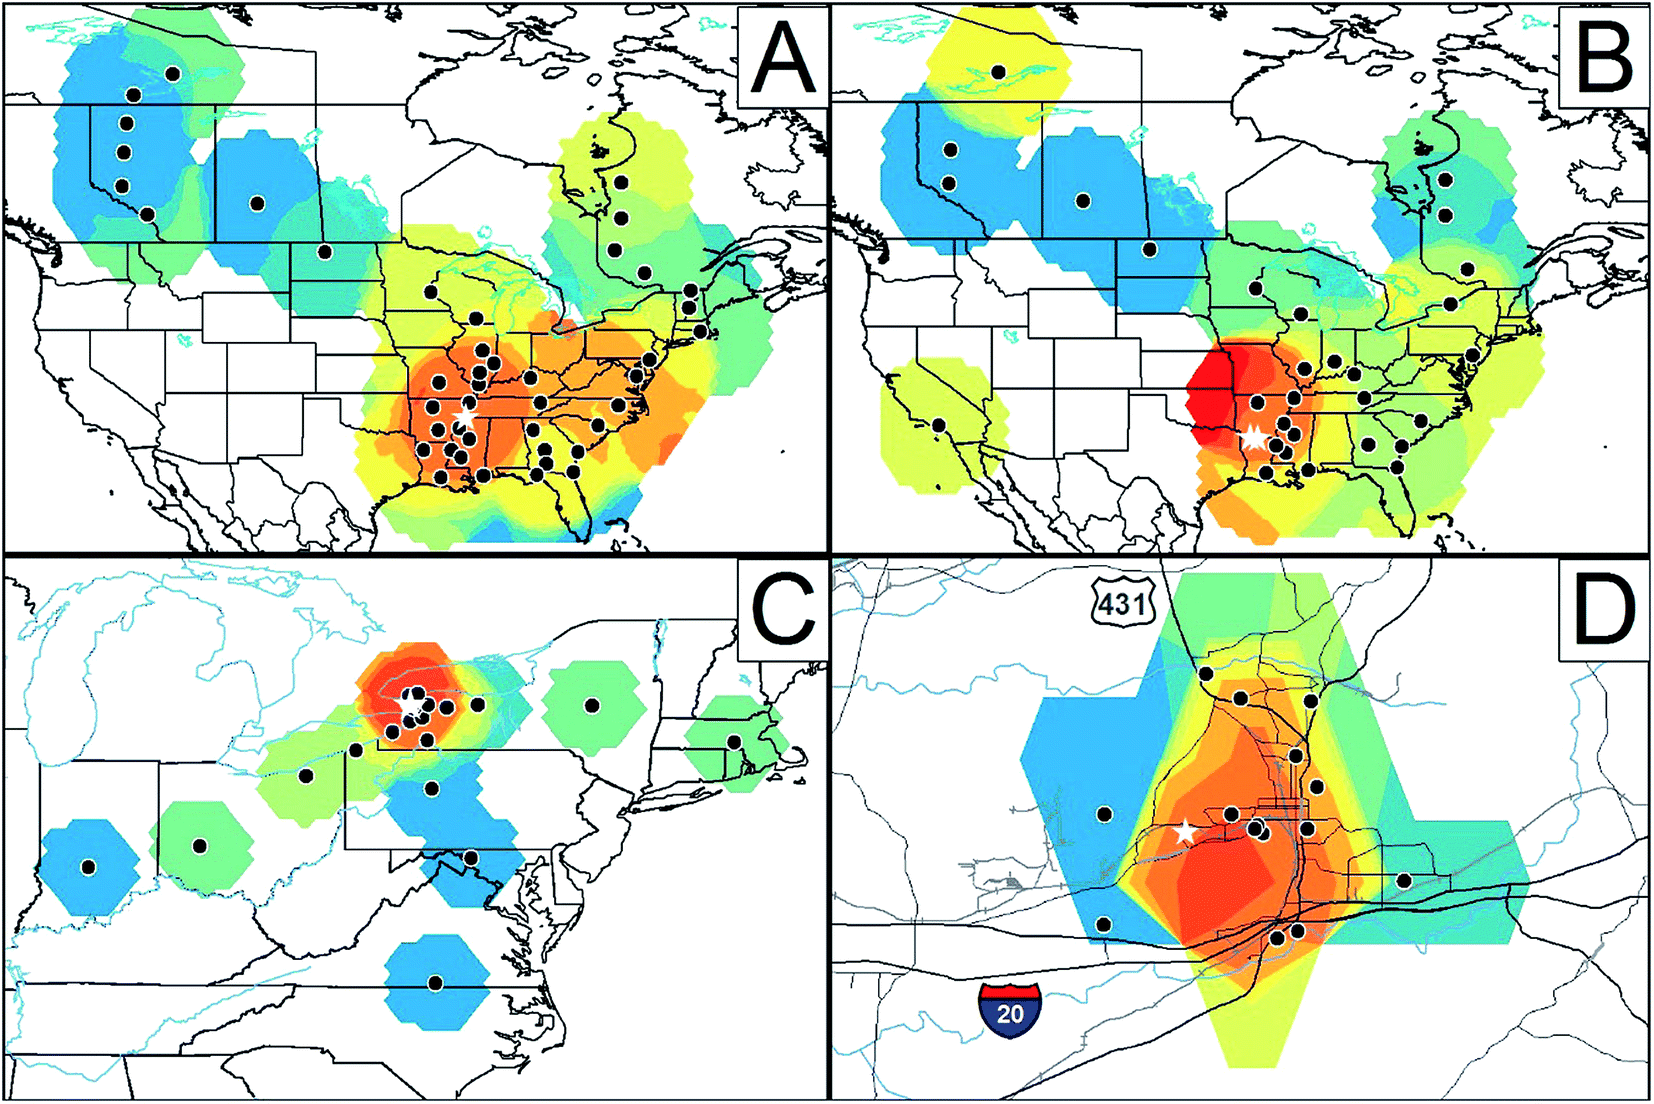 | ||
| Fig. 3 Relative concentrations of (A) toxaphene in tree bark from North America,11 (B) polybrominated diphenyl ethers in tree bark from North America,12 (C) dechlorane plus in tree bark from the northeastern United States,13 and (D) total PCBs in tree bark from northeastern Alabama, United States.14 The black dots indicate sampling sites. Red represents “hot spots,” and blue represents the opposite. The width of each panel represents a total distance of: (A) 7400 km, (B) 7400 km, (C) 2100 km, and (D) 45 km. The white stars in each panel represent likely sources of each substance. Reprinted with permission from A. A. Peverly, A. Salamova, and R. A. Hites, Environ. Sci. Technol., in press. Copyright 2015 American Chemical Society. | ||
Transpiration-driven uptake of pollutants from soil and water
In addition to passive sampling of the air by lichen, mosses, and the leaves and bark of trees, biomonitoring of rooted plants such as trees can provide information on local soil and water. Transpiration, by which trees draw water up from their roots, enhances the uptake of nutrients as well as water-soluble contaminants. Groundwater contamination can therefore be detected using trees as biomonitors, taking advantage of their ability to sample soil and groundwater via their root network.Limmer and coworkers developed a method for extracting and measuring perchlorate in tree sap, as a variety of plants have been observed to take up perchlorate readily through their roots.15 Perchlorate salts are known for their oxidizing properties and have been used extensively for manufacturing explosives, fireworks, and propellants. The perchlorate ion (ClO4−) is highly water-soluble, degrades slowly in the environment, and has been linked to the disruption of thyroid function and other negative health effects in humans. Initial studies by Limmer et al. demonstrated that willow cuttings in a hydroponic greenhouse setting took up quantities of perchlorate that were proportional to exposure concentrations. A freeze centrifugation method was used to extract liquids from tree samples, which were then analyzed using ultra-fast ion exchange chromatography tandem mass spectrometry (UFIC-MS/MS). Limmer and coworkers showed that the general shape and intensity of a perchlorate plume could be mapped using data gathered from tree cores at field sites (Fig. 4). Sap perchlorate and measured groundwater concentrations of perchlorate were correlated at some of the sampling sites; disparities between these measurements at other sites might be associated with differences in rooting depth and depth to groundwater that would affect access to the perchlorate plume. Overall, the described method for monitoring perchlorate in groundwater using tree core samples is a cost-effective, rapid alternative to conventional groundwater sampling, especially in forested areas and regions with limited access.
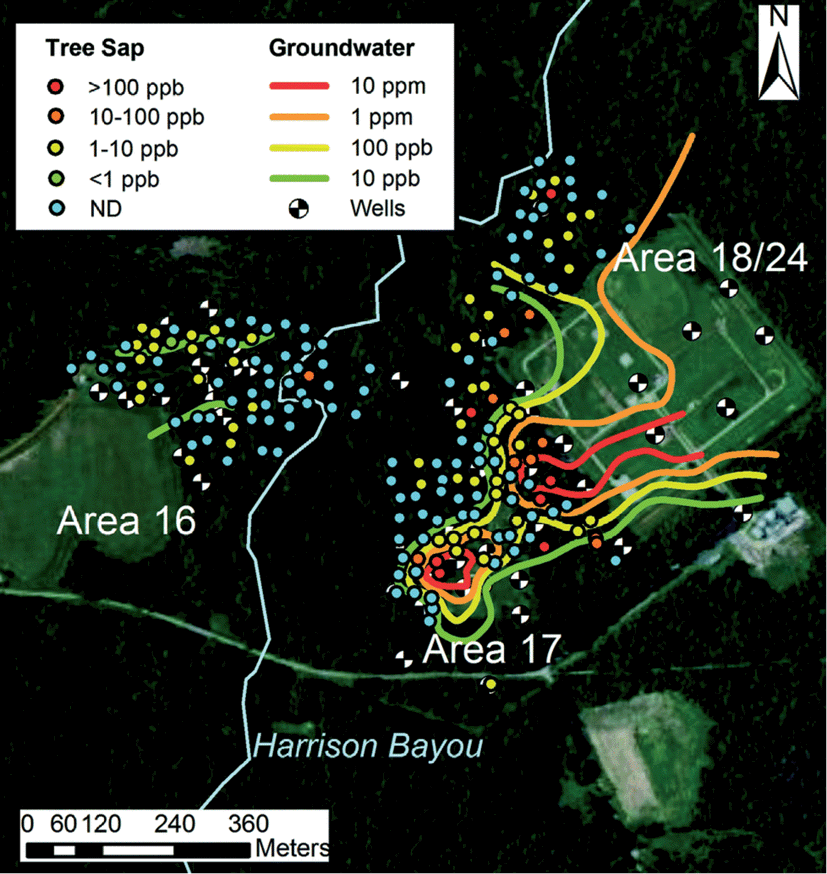 | ||
| Fig. 4 Measurements of tree perchlorate overlaid on groundwater perchlorate isoconcentration contours of the Longhorn Army Ammunition Plant field site in Texas. Reproduced from ref. 15 with permission from The Royal Society of Chemistry. | ||
Concluding remarks
The ability to sample living plants in a region provides useful data that can supplement information gathered from more traditional passive and active sampling devices. Furthermore, when the deployment of traditional instrumentation may be limited due to cost and accessibility, the use of biomonitors provides a relatively inexpensive means of collecting environmental data. These highlighted articles demonstrate the versatility and usefulness of plants for monitoring contaminant levels on a variety of scales; the spatial resolution achieved in some of these studies can help trace pollutants back to their sources, exemplifying why biomonitoring of plants is also often referred to as “phytoforensics.” With continuing improvement of sampling methods and analytical techniques, we anticipate many more contributions to our understanding of chemicals in our environment via biomonitoring of plants and other organisms.References
- J. G. Burken, D. A. Vroblesky and J. C. Balouet, Environ. Sci. Technol., 2011, 45, 6218–6226 CrossRef CAS PubMed.
- G. A. Mills, R. Greenwood, B. Vrana, I. J. Alland and T. Ocelkae, J. Environ. Monit., 2011, 13, 2979–2982 RSC.
- G. Bertolotti and S. Gialanella, Anal. Methods, 2014, 6, 6208–6222 RSC.
- M. E. Conti and G. Cecchetti, Environ. Pollut., 2001, 114, 471–492 CrossRef CAS.
- L. Van der Wat and P. B. C. Forbes, Trends Anal. Chem., 2015, 64, 165–172 CrossRef CAS PubMed.
- M. Długosz-Lisiecka and J. Wróbel, Environ. Sci.: Processes Impacts, 2014, 16, 2729–2733 Search PubMed.
- C. Barros, P. Pinho, R. Durão, S. Augusto, C. Máguas, M. J. Pereira and C. Branquinho, Environ. Sci. Technol., 2015, 49, 2222–2229 CrossRef CAS PubMed.
- Q. Q. Li, A. Loganath, Y. S. Chong, J. Tan and J. P. Obbard, J. Toxicol. Environ. Health, Part A, 2006, 69, 1987–2005 CrossRef CAS PubMed.
- M. Odabasi, E. O. Falay, G. Tuna, H. Altiok, M. Kara, Y. Dumanoglu, A. Bayram, D. Tolunay and T. Elbir, Environ. Sci. Technol., 2015, 49, 2105–2114 CrossRef CAS PubMed.
- A. A. Peverly, A. Salamova and R. A. Hites, Environ. Sci. Technol. DOI:10.1021/es505394y.
- J. G. McDonald and R. A. Hites, Environ. Sci. Technol., 2003, 37, 475–484 CrossRef CAS.
- L. Y. Zhu and R. A. Hites, Environ. Sci. Technol., 2006, 40, 3711–3716 CrossRef CAS.
- X. H. Qiu and R. A. Hites, Environ. Sci. Technol., 2008, 42, 31–36 CrossRef CAS.
- M. H. Hermanson and G. W. Johnson, Chemosphere, 2007, 68, 191–198 CrossRef CAS PubMed.
- M. A. Limmer, D. M. West, R. Mu, H. Shi, K. Whitlock and J. G. Burken, Environ. Sci.: Water Res. Technol., 2015, 1, 138 Search PubMed.
| This journal is © The Royal Society of Chemistry 2015 |