Band engineering of high performance p-type FeNbSb based half-Heusler thermoelectric materials for figure of merit zT > 1†
Chenguang
Fu
a,
Tiejun
Zhu
*ab,
Yintu
Liu
a,
Hanhui
Xie
a and
Xinbing
Zhao
ab
aState Key Laboratory of Silicon Materials, Department of Materials Science and Engineering, Zhejiang University, Hangzhou 310027, China. E-mail: zhutj@zju.edu.cn
bKey Laboratory of Advanced Materials and Applications for Batteries of Zhejiang Province, Zhejiang University, Hangzhou 310027, China
First published on 11th November 2014
Abstract
We report new p-type FeNb1−xTixSb (0.04 ≤ x ≤ 0.24) half-Heusler thermoelectric materials with a maximum zT of 1.1 at 1100 K, which is twice that of the ZrCoSb half-Heusler alloys. The electrical properties are optimized by a tradeoff between the band effective mass and mobility via a band engineering approach. A high content of Ti up to x = 0.2 optimizes the power factor and reduces the lattice thermal conductivity. In view of abundantly available elements, good stability and high zT, FeNb1−xTixSb alloys could be promising materials for high temperature power generation.
Broader contextThermoelectric materials enable heat to be directly converted into electricity. However, the relatively poor efficiency, low stability and high cost of these materials have limited their potential as a practical alternative to conventional power generation technologies. For thermoelectric conversion, a large temperature difference across the devices and a high dimensionless figure of merit zT of thermoelectric materials will result in enhanced conversion efficiency. In recent years, half-Heusler (HH) thermoelectric materials have attracted much attention due to their high temperature stability and potential for high temperature power generation. However, developing high performance p-type HH compounds is a big challenge. In this work, we report a new kind of p-type FeNb1−xTixSb HH thermoelectric material with a maximum zT of 1.1 at 1100 K, and the thermoelectric properties are optimized by a band engineering approach via the tradeoff between the band effective mass and carrier mobility. In view of abundantly available elements, good stability and high zT, FeNb1−xTixSb HH alloys could be promising materials for high temperature power generation. |
Thermoelectric (TE) materials allow for direct thermal-to-electric energy conversion without hazardous liquids, moving parts, or greenhouse emissions. The demand for new sustainable energy technology, the environmental concern for the use of fossil fuels, and the ubiquitous heat source have consistently driven the pursuit of higher performance TE materials.1 The conversion efficiency of a TE device strongly depends on the materials' dimensionless figure of merit zT, zT = α2σT/(κe + κL), where α, σ, T, κe and κL are respectively the Seebeck coefficient, the electrical conductivity, the absolute temperature, and the electron and lattice components of total thermal conductivity κ.2 Developing bulk materials with high zT is the central theme for the large scale application of TE technology. To date, Bi2Te3-based materials are the most efficient for refrigeration near room temperature,3 PbTe, filled skutterudites and Mg2(Si, Sn) are promising for mid-temperature power generation,4–7 and SiGe and Yb14MnSb11 are known for high-temperature TE application.8,9
Half-Heusler (HH) compounds, with a valence electron count of 8 or 18, have recently been identified as one of the most promising TE materials for high temperature power generation due to their excellent electrical and mechanical properties and high temperature stability.10–14 The n-type (Zr, Hf)NiSn based HH compounds have exhibited the maximum zT as high as ∼1.0 at 1000 K, which exceeds the industry benchmark set by SiGe high temperature alloys (zT ∼ 0.8 for n-type and 0.6 for p-type).10–14 However, the typical p-type HH compounds, (Zr, Hf)CoSb, have the reproducible highest zT of only ∼0.5.10,14 Therefore, developing high performance p-type HH compounds is imperative to achieve high efficiency high temperature TE devices based on HH compounds, because the practical systems require both n- and p-type materials with similar properties.10
FeVSb based HH compounds with abundantly available constituent elements, despite the high power factor α2σ (∼4.5 × 10⁻³ W m−1 K−2 at 300 K), have been paid less attention due to their high lattice thermal conductivity (∼10 W m−1 K−1 at 300 K) and low zT (∼0.3 for n-type).15,16 In our previous study, a significantly reduced thermal conductivity of 5.5 W m−1 K−1 at 300 K was obtained for the FeV0.6Nb0.4Sb solid solutions by the enhanced point defect scattering of phonons.16 Fe(V, Nb)Sb solid solutions can be promising p-type TE materials due to their high band degeneracy and reduced lattice thermal conductivity. However, there are two factors hindering the further improvement of the alloys' TE performance: one is that the optimal carrier concentration cannot be reached due to the limited solubility of the Ti dopant on V/Nb sites; the other is that the low carrier mobility leads to a relatively low power factor (∼3.0 × 10⁻³ W m−1 K−2 at 900 K).15
If acoustic phonon scattering dominates the carrier transport, zT ∝ Nv/m*bκL,17 where Nv is the number of degenerate valleys and m*b is the band effective mass. This suggests that multiple degenerate valleys with low band effective mass and low lattice thermal conductivity are beneficial for high zT.4,5,18,19 In fact, most of the recent studies on enhancing zT have focused on two strategies: one is to reduce the lattice thermal conductivity κL by alloying or nanostructuring to enhance phonon scattering;1,5,20,21 the other is to improve the electrical properties by band engineering, such as band convergence4,22 or resonant states.23
p-type Fe(V, Nb)Sb HH solid solutions have high band degeneracy and relatively low lattice thermal conductivity.15 Therefore, further enhancement of zT may be realized by reducing the band effective mass to improve the mobility. Generally, the heavier band gives a larger band effective mass. Electronic band calculations show that the valence band maxima (VBM) of both FeVSb and FeNbSb locate at the L point with twofold orbital degeneracy,24,25 and the valence band of FeVSb is flatter than that of FeNbSb.24 Therefore, increasing the Nb content in the Fe(V1−yNby)Sb solid solutions may achieve a lower valence band effective mass and consequently higher carrier mobility. Moreover, the decrease in band effective mass can lead to the decrease in optimal carrier concentration,18 which is favorable for p-type Fe(V, Nb)1−xTixSb due to the limited solubility of Ti.15 Furthermore, FeNbSb has a larger band gap Eg (∼0.54 eV) than that of FeVSb (∼0.34 eV),15,25 and increasing the Nb content in Fe(V1−yNby)1−xTixSb will prevent the degradation of the TE performance at high temperatures due to the thermally activated minority carriers.
In this work, we indeed obtain a high zT of 1.1 at 1100 K for FeNb1−xTixSb without V substitution, which is the highest reported value for p-type HH compounds. The decreased band effective mass and the increased band gap with increasing Nb content in Fe(V1−yNby)1−xTixSb lead to the enhanced carrier mobility and diminished bipolar conduction at high temperature, respectively, and a high content of Ti doping not only optimizes the carrier concentration but also guarantees the reduced lattice thermal conductivity in FeNb1−xTixSb (0.04 ≤ x ≤ 0.24), which all contribute to high zT, demonstrating that p-type FeNb1−xTixSb alloys are promising TE materials for high temperature power generation.
Electronic band structures of FeVSb and FeNbSb have been investigated by the first principles calculations (Fig. S1, ESI†) and our results are similar to those previously reported.24,25 The valence band of FeVSb is flatter than that of FeNbSb, indicating that increasing the Nb content in Fe(V1−yNby)1−xTixSb will lead to a lower band effective mass (Table S1, ESI†).
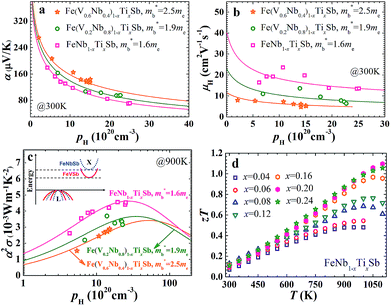
The carrier concentration dependence of the Seebeck coefficient for Fe(V1−yNby)1−xTixSb samples at room temperature is shown in Fig. 1(a), which agrees well with the calculated curves using a single parabolic band (SPB) model.12 A distinct decrease of band effective mass m*b can be found with increasing Nb content y, varying from 2.5me for p-type Fe(V0.6Nb0.4)1−xTixSb to 1.6me for FeNb1−xTixSb. The unchanged band effective mass with increasing Ti content in Fe(V1−yNby)1−xTixSb samples indicates that substituting Ti at V/Nb sites has no effect on the valence band structure. This can be understood from the fact that the valence band structure is dominated by the electronic character of the Fe element (Fig. S1, ESI†), and is also consistent with the previous results by Jodin et al.25
The decrease in m*b is beneficial for the increase of carrier mobility. As shown in Fig. 1(b), the carrier mobility of FeNb1−xTixSb is twice as high as that of Fe(V0.6Nb0.4)1−xTixSb. The room temperature carrier mobility of FeNb1−xTixSb is about 15–25 cm2 V−1 s−1, which is higher than that of other Fe-containing p-type TE materials.26,27 For example, the carrier mobility of p-type FeVSb is about 1–4 cm2 V−1 s−1,26 while p-type Fe-based skutterudites have a carrier mobility of ≤10 cm2 V−1 s−1.27 The low mobility in these Fe-containing p-type TE materials is due to the heavy band mass resulting from the spatially localized nature of transition metal 3d orbitals.28 In addition to the decrease in m*b, the reduced alloy scattering of carriers should also contribute to the increased carrier mobility in p-type FeNb1−xTixSb, compared to Fe(V0.6Nb0.4)1−xTixSb solid solutions.
The decreased m*b leads to the low Seebeck coefficient but contributes more to the enhanced carrier mobility. As a result, the optimal power factor distinctly increases with decreasing m*b (Fig. 1(c)), while the optimal carrier concentration popt decreases with the decreased m*b. For the FeNb1−xTixSb system, the popt is ∼2.6 × 1021 cm−3, lower than that of the Fe(V1−yNby)1−xTixSb solid solutions. In Fe(V0.6Nb0.4)1−xTixSb, the experimentally obtained maximum carrier concentration is only ∼1.5 × 1021 cm−3 due to the limited solubility of Ti, far below the popt of ∼6 × 1021 cm−3.15 Decreasing m*b makes it possible to achieve the optimal power factor at a lower carrier concentration in the FeNb1−xTixSb system. A similar phenomenon is also found in the high performance PbTe system.18
Therefore, the TE properties of p-type Ti doped FeNb1−xTixSb (x = 0.04–0.24) alloys were systematically investigated. Fig. 1(d) indeed shows that the zT of FeNb1−xTixSb samples increases with increasing Ti content and a very high zT of 1.1 is reached at 1100 K for FeNb0.8Ti0.2Sb, which is the highest reported value for p-type HH compounds.
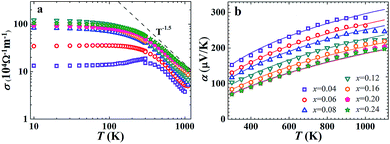
The transport features of FeNb1−xTixSb will be discussed in detail below. The electrical conductivity of FeNb1−xTixSb samples decreases rapidly above room temperature and follows a temperature dependence of T−1.5 (Fig. 2(a)), implying that the acoustic phonon scattering dominated charge transport,29 since the hole concentration is almost independent of temperature before intrinsic excitation for heavily doped semiconductors15 (Fig. S2, ESI†). The calculated Seebeck coefficient α by the SPB model, in Fig. 2(b), agrees well with the experimental data before the intrinsic excitation of charge carriers. All the FeNb1−xTixSb samples have high power factors (PFs) (Fig. S3, ESI†), and the PF of p-type FeNb0.8Ti0.2Sb is about 4.5 × 10⁻³ W m−1 K−2 at 1100 K, comparable with that of the optimized n-type (Hf, Zr)NiSn based HH compounds,11 and about twice as high as that of the most widely used p-type SiGe alloys for high temperature power generation.30
 | ||
| Fig. 2 Temperature dependence of electrical conductivity (a) and Seebeck coefficient (b) for FeNb1−xTixSb samples. The theoretical curves in (b) were calculated using the SPB model. | ||
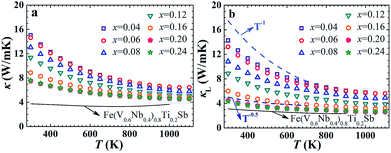
The temperature dependence of thermal conductivity κ and lattice thermal conductivity κL of FeNb1−xTixSb alloys is shown in Fig. 3. The lattice thermal conductivity was obtained by subtracting the electronic component κe from the total thermal conductivity κ. κe was calculated via κe = LσT, where L is the Lorenz number and can be calculated using the SPB model with reasonable approximation.12 The total thermal conductivity at room temperature decreases from 15 W m−1 K−1 at x = 0.04 to 7.5 W m−1 K−1 at x = 0.2, mainly resulting from the significant decrease in the lattice thermal conductivity (Fig. 3(b)). The κL decreases rapidly with increasing Ti content over the measured temperature, indicating that the substitution of Ti at Nb sites is an effective way to reduce the κL of FeNbSb. The lattice thermal conductivity of all FeNb1−xTixSb samples follows a κL ∼ Ts behavior with the exponent −0.5 ≤ s < −1, indicating that strong point defect scattering is present.31
 | ||
| Fig. 3 Thermal conductivity κ (a) and lattice thermal conductivity κL (b) of FeNb1−xTixSb samples. The solid lines in (a) and (b) show the κ and κL of Fe(V0.6Nb0.4)0.8Ti0.2Sb for comparison. | ||
Although p-type FeNb1−xTixSb compounds have the largest power factor among Fe(V1−yNby)1−xTixSb alloys, they have the higher lattice thermal conductivity compared with the V substituted solid solutions due to the stronger point defect scattering of phonons in the latter.16 However, the room temperature κL of FeNb1−xTixSb samples rapidly decreases with increasing Ti content (Fig. S4a, ESI†), and are only ∼30% higher than the Fe(V0.6Nb0.4)1−xTixSb solid solutions at high Ti contents (x ≥ 0.2). At higher temperatures, due to the strong phonon–phonon scattering, the difference in κL between FeNb0.8Ti0.2Sb and Fe(V0.6Nb0.4)0.8Ti0.2Sb is even smaller, only ∼15% at 800 K (Fig. S4b, ESI†). Calculations of the phonon relaxation time using the Callaway model reveal that in FeNb0.8Ti0.2Sb the Umklapp process is dominant at 400 K (Fig. S5, ESI†).32 Although it was previously reported that the low content Ti could improve the electrical conductivity in FeNb0.95Ti0.05Sb,24 our work shows for the first time that high content Ti doping at Nb sites not only optimizes the carrier concentration but also enhances the point defect scattering of phonons to suppress the lattice thermal conductivity.
It is noteworthy that the band gap of FeNb1−xTixSb (∼0.54 eV) is larger than that of Fe(V0.6Nb0.4)1−xTixSb (∼0.42 eV), which is beneficial to inhibit the intrinsic excitation of minority carrier and leads to the maximum Seebeck coefficient at higher temperature (Fig. S6, ESI†). The thermal conductivity of Fe(V0.6Nb0.4)0.8Ti0.2Sb begins to increase above 800 K due to the bipolar conduction, whereas in FeNb1−xTixSb it is above 1100 K (Fig. (3)). Therefore, the increased band gap and suppressed bipolar conduction also contribute to the high zT at high temperature in FeNb1−xTixSb.
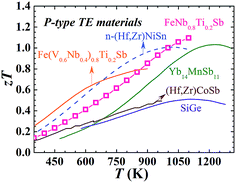
As shown in Fig. 1(d), FeNb1−xTixSb alloys exhibit a maximum zT of 1.1 at x = 0.2. Compared with other good p-type high temperature TE materials (Fig. 4), FeNb0.8Ti0.2Sb is more competitive in high temperature power generation. Especially, the maximum zT of the FeNb0.8Ti0.2Sb half-Heusler alloy is almost twice as high as that of the most widely used p-type SiGe TE materials.30 At high temperatures (>900 K) the p-type FeNb0.8Ti0.2Sb displays superior TE performance to the optimized n-type (Hf, Zr)NiSn compound, which makes it possible to achieve a high efficiency TE device based on half-Heusler alloys. The good experimental repeatability and high temperature stability of FeNb0.8Ti0.2Sb have also been confirmed (Fig. S7 and S8, ESI†).
 | ||
| Fig. 4 zT comparison of typical high temperature p-type TE materials. TE performance of FeNb0.8Ti0.2Sb superior to other advanced high temperature p-type materials (solid line)9,14,15,30 and the optimized n-type (Hf, Zr)NiSn11 based HH compound (dashed line). | ||
In summary, new high performance p-type FeNb1−xTixSb half-Heusler thermoelectric alloys were developed via a band engineering approach through a tradeoff between the band effective mass and carrier mobility. A high zT value of 1.1 at 1100 K was achieved for FeNb0.8Ti0.2Sb. The high content of Ti doping at Nb sites not only optimizes the power factor but also enhances point defect scattering of phonons. The increased band gap of FeNb1−xTixSb, compared to Fe(V0.6Nb0.4)1−xTixSb, leads to the suppressed intrinsic excitation at high temperatures. Considering the competitive cost, good stability and high TE properties, FeNb1−xTixSb alloys exhibit high potential for high temperature TE power generation.
Methods
Synthesis
The ingots (∼20 g) with nominal composition Fe(V1−yNby)1−xTixSb (x = 0–0.24 and y = 0.4–1.0) were prepared by levitation melting of stoichiometric amounts of Fe (piece, 99.97%), V (piece, 99.97%), Nb (foil, 99.98%), Ti (rod, 99.99%) and Sb (block, 99.999%) under an argon atmosphere for 3 minutes. The ingots were remelted three times to ensure homogeneity. The obtained ingots were mechanically milled (Mixer Mill MM200, Retsch) for 4 h under argon protection. The obtained powders were loaded into the graphite die and compacted by spark plasma sintering (SPS-1050, Sumitomo Coal Mining Co.) at 1123 K for 10 min under 65 MPa in a vacuum. The as-sintered samples, of which the relative densities were found to be ∼95%, were annealed at 1023 K for 2 days.Structural characterization
Phase structures of the samples were investigated by X-ray diffraction (XRD) on a RigakuD/MAX-2550PC diffractometer using Cu Kα radiation (λ0 = 1.5406 Å) and the chemical compositions were checked by electron probe microanalysis (EPMA, JEOL, JXA-8100). The XRD patterns of Fe(V1−yNby)1−xTixSb show a single phase that can be indexed to the HH phase with a cubic MgAgAs-type crystal structure (space group, F![[4 with combining macron]](https://www.rsc.org/images/entities/char_0034_0304.gif) 3m),15 and the XRD patterns of FeNb1−xTixSb (x = 0–0.24) samples are shown in Fig. S9a.† The lattice parameters of FeNb1−xTixSb were calculated via Bragg's law using Jade® codes, which decrease almost linearly with the nominal Ti content (Fig. S9b, ESI†) since the covalent radius of Ti is smaller than that of Nb. The fairly good linearity is consistent with Vegard's law. The microstructure and homogeneity of FeNb0.8Ti0.2Sb were investigated by EPMA (Fig. S10, ESI†). The EPMA results (Table S2, ESI†) show that the actual compositions are close to the nominal ones.
3m),15 and the XRD patterns of FeNb1−xTixSb (x = 0–0.24) samples are shown in Fig. S9a.† The lattice parameters of FeNb1−xTixSb were calculated via Bragg's law using Jade® codes, which decrease almost linearly with the nominal Ti content (Fig. S9b, ESI†) since the covalent radius of Ti is smaller than that of Nb. The fairly good linearity is consistent with Vegard's law. The microstructure and homogeneity of FeNb0.8Ti0.2Sb were investigated by EPMA (Fig. S10, ESI†). The EPMA results (Table S2, ESI†) show that the actual compositions are close to the nominal ones.
TE property measurement
The low temperature electrical conductivity and Hall coefficients from 10 K to 300 K were measured using a Mini Cryogen Free Measurement System (Cryogenic Limited, UK). The carrier concentration pH was calculated by pH = 1/eRH, where e is the unit charge and RH is the Hall coefficient. The carrier mobility μH was calculated by μH = σRH. The Seebeck coefficient and electrical conductivity from 300–1100 K were measured on a commercial Linseis LSR-3 system using a differential voltage/temperature technique and a DC four-probe method. The thermal conductivity κ was calculated using κ = DρCp, where ρ is the sample density estimated by the Archimedes method. The thermal diffusivity D and specific heat Cp were measured by a laser flash method on a Netzsch LFA457 instrument with a Pyroceram standard (Fig. S11, ESI†). The accuracy is ±3% and ±5%, respectively.Acknowledgements
This work was supported by the National Basic Research Program of China (2013CB632503), the Nature Science Foundation of China (51171171), the Program for New Century Excellent Talents in University (NCET-12-0495), the Program for Innovative Research Team in the University of Ministry of Education of China (IRT13037), and the Ph.D. program Foundation of Ministry of Education of China (no. 20120101110082).Notes and references
- L. D. Zhao, V. P. Dravid and M. G. Kanatzidis, Energy Environ. Sci., 2014, 7, 251 CAS.
- G. J. Snyder and E. S. Toberer, Nat. Mater., 2008, 7, 105 CrossRef CAS PubMed.
- B. Poudel, Q. Hao, Y. Ma, Y. Lan, A. Minnich, B. Yu, X. Yan, D. Wang, A. Muto, D. Vashaee, X. Chen, J. Liu, M. S. Dresselhaus, G. Chen and Z. Ren, Science, 2008, 320, 634 CrossRef CAS PubMed.
- Y. Z. Pei, X. Y. Shi, A. Lalonde, H. Wang, L. D. Chen and G. J. Snyder, Nature, 2011, 473, 66 CrossRef CAS PubMed.
- K. Biswas, J. He, I. D. Blum, C. I. Wu, T. P. Hogan, D. N. Seidman, V. P. Draid and M. G. Kanatzidis, Nature, 2012, 489, 414 CrossRef CAS PubMed.
- X. Shi, J. Yang, J. R. Salvador, M. Chi, J. Y. Cho, H. Wang, S. Bai, J. H. Yang, W. Q. Zhang and L. D. Chen, J. Am. Chem. Soc., 2011, 133, 7837 CrossRef CAS PubMed.
- G. Y. Jiang, J. He, T. J. Zhu, C. G. Fu, X. H. Liu, L. P. Hu and X. B. Zhao, Adv. Funct. Mater., 2014, 24, 3776 CrossRef CAS.
- C. B. Vining, W. Laskow, J. O. Hanson, R. R. Van der Beck and P. D. Gorsuch, J. Appl. Phys., 1991, 69, 331 CrossRef CAS PubMed.
- S. R. Brown, S. M. Kauzlarich, F. Gascoin and G. J. Snyder, Chem. Mater., 2006, 18, 1873 CrossRef CAS.
- W. Xie, A. Weidenkaff, X. Tang, Q. Zhang, J. Poon and T. M. Tritt, Nanomaterials, 2012, 2, 379 CrossRef CAS PubMed.
- C. Yu, T. J. Zhu, R. Z. Shi, Y. Zhang, X. B. Zhao and J. He, Acta Mater., 2009, 57, 2757 CrossRef CAS PubMed.
- H. H. Xie, H. Wang, Y. Z. Pei, C. G. Fu, X. H. Liu, G. J. Snyder, X. B. Zhao and T. J. Zhu, Adv. Funct. Mater., 2013, 23, 5123 CrossRef CAS.
- M. Schwall and B. Balke, Phys. Chem. Chem. Phys., 2013, 15, 1868 RSC.
- S. R. Culp, J. W. Simonson, S. J. Poon, V. Ponnambalam, J. Edwards and T. M. Tritt, Appl. Phys. Lett., 2008, 93, 022105 CrossRef PubMed.
- C. G. Fu, T. J. Zhu, Y. Z. Pei, H. H. Xie, H. Wang, G. J. Snyder, Y. Liu, Y. T. Liu and X. B. Zhao, Adv. Energy Mater., DOI:10.1002/aenm.201400600.
- C. G. Fu, H. H. Xie, T. J. Zhu, J. Xie and X. B. Zhao, J. Appl. Phys., 2012, 112, 124915 CrossRef PubMed.
- Y. Z. Pei, H. Wang and G. J. Snyder, Adv. Mater., 2012, 24, 6125 CrossRef CAS PubMed.
- Y. Z. Pei, A. D. Lalonde, H. Wang and G. J. Snyder, Energy Environ. Sci., 2012, 5, 7963 CAS.
- M. Zhou, Z. M. Gibbs, H. Wang, Y. Han, C. Xin, L. Li and G. J. Snyder, Phys. Chem. Chem. Phys., 2014, 16, 20741 RSC.
- J. F. Li, W. S. Liu, L. D. Zhao and M. Zhou, NPG Asia Mater., 2010, 2, 152 CrossRef.
- J. Yang, G. P. Meisner and L. Chen, Appl. Phys. Lett., 2004, 85, 1140 CrossRef CAS PubMed.
- L. D. Zhao, H. J. Wu, S. Q. Hao, C. I. Wu, X. Y. Zhao, K. Biswas, J. Q. He, T. P. Hogan, C. Uher, C. Wolverton, V. P. Dravid and M. G. Kanatzidis, Energy Environ. Sci., 2013, 6, 3346 CAS.
- J. P. Heremans, V. Jovovic, E. S. Toberer, A. Saramat, K. Kurosaki, A. Charoenphakdee, S. Yamanaka and G. J. Snyder, Science, 2008, 321, 554 CrossRef CAS PubMed.
- D. P. Young, P. Khalifah, R. J. Cava and A. P. Ramirez, J. Appl. Phys., 2000, 87, 317 CrossRef CAS PubMed.
- L. Jodin, J. Tobola, P. Pecheur, H. Scherrer and S. Kaprzyk, Phys. Rev. B: Condens. Matter Mater. Phys., 2004, 70, 184207 CrossRef.
- M. Zou, J. F. Li and T. Kita, J. Solid State Chem., 2013, 198, 125 CrossRef CAS PubMed.
- P. F. Qiu, J. Yang, R. H. Liu, X. Shi, X. Y. Huang, G. J. Snyder, W. Zhang and L. D. Chen, J. Appl. Phys., 2011, 109, 063713 CrossRef PubMed.
- J. Yang, P. Qiu, R. Liu, L. Xi, S. Zhang, W. Zhang, L. Chen, D. J. Singh and J. H. Yang, Phys. Rev. B: Condens. Matter Mater. Phys., 2011, 84, 235205 CrossRef.
- X. Shi, Y. Z. Pei, G. J. Snyder and L. Chen, Energy Environ. Sci., 2011, 4, 4086 CAS.
- C. B. Vining, W. Laskow, J. O. Hanson, R. R. Van der Beck and P. D. Gorsuch, J. Appl. Phys., 1991, 69, 4333 CrossRef CAS PubMed.
- P. G. Klemens, Phys. Rev., 1960, 119, 507 CrossRef CAS.
- J. Callaway, Phys. Rev., 1959, 113, 1046 CrossRef CAS.
Footnote |
| † Electronic supplementary information (ESI) available: Band structure calculation, electrical and thermal properties, thermogravimetric analysis, reproducibility, XRD patterns, and electron probe microanalysis. See DOI: 10.1039/c4ee03042g |
| This journal is © The Royal Society of Chemistry 2015 |

