 Open Access Article
Creative Commons Attribution 3.0 Unported Licence
Correction: Unexpected optical activity of cerium in Y2O3:Ce3+, Yb3+, Er3+ up and down-conversion system
Riccardo
Marin
a,
Michele
Back
a,
Nicolò
Mazzucco
a,
Francesco
Enrichi
b,
Romana
Frattini
a,
Alvise
Benedetti
a and
Pietro
Riello
*a
aDipartimento di Scienze Molecolari e Nanosistemi, Università Ca’ Foscari di Venezia, Via Torino 155/b, 30170 Mestre, VE, Italy. E-mail: riellop@unive.it; Fax: +39 041 234 6747; Tel: +39 234 6718
bNanoFab – Nanofabrication facility, Parco Scientifico e Tecnologico Vega – Torre Hammon, Via delle Industrie 5, 30175 Marghera, VE, Italy
First published on 19th March 2015
Abstract
Correction for ‘Unexpected optical activity of cerium in Y2O3:Ce3+, Yb3+, Er3+ up and down-conversion system’ by Riccardo Marin et al., Dalton Trans., 2013, 42, 16837–16845.
In the paper, we claim to observe the optical activity of cerium in a triply doped yttrium oxide system displaying both upconverting and downshifting properties. The singly-doped Y2O3:Ce3+ system has already been investigated by many groups, with controversial results, as stated in our paper. Some groups suggested an emission centered on cerium ions, while others proposed a defect-related emission, caused by the introduction of defects during the doping process. We propose optical activity of the trivalent cerium ions embedded in yttria.
We observed that a broadband emission feature in the 300–600 nm range was displayed by samples doped with various cerium contents, which was ascribed to the cerium 5d→4f electronic transition. One piece of evidence supporting this interpretation is the shift of this emission upon increasing the cerium content (i.e. increasing the cell edge), a behavior already observed in yttrium aluminum garnet (YAG) doped with cerium and increasing gadolinium concentrations. Nonetheless, further analyses of the system demonstrated that this broadband feature cannot be unambiguously assigned to the cerium emission. Actually, this spectral region hosts a plethora of defect-related emissions. In particular, we found that the quartz window used during the analyses has an intrinsic emission in this region. So, the real effect of the increasing cerium content could be distorted somehow.
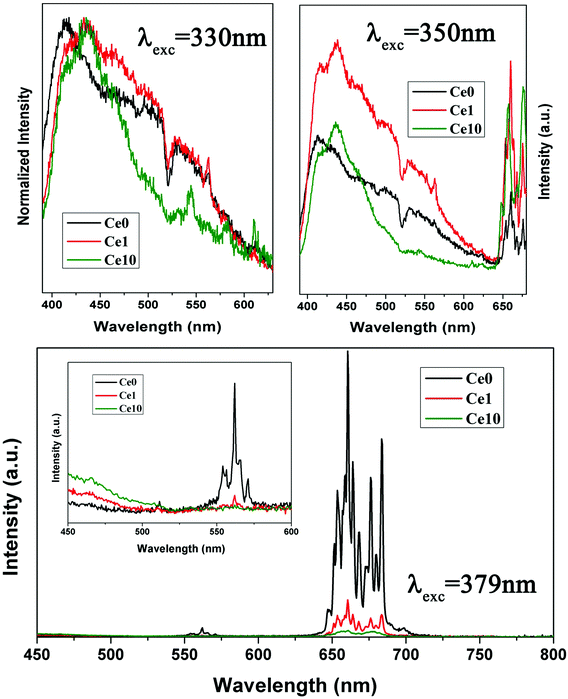
To gain a deeper insight into this issue, we synthesized three more samples with composition Y2O3:Er(2%), Yb(10%), Ce(x%) with x = 0, 1, 10. We recorded the spectra of these samples on excitation at three different wavelengths, all falling within the expected cerium excitation range: 330 nm, 350 nm, and 379 nm. We also changed the piece of quartz used as a transparent window during the analyses, making sure that no emission arises from it upon excitation at the selected wavelengths. The spectra of the samples are shown below.
As can be noted, when the samples with increasing cerium content are excited at 330 nm, a band centered at 436 nm appears at the expense of the band centered at 413 nm. The latter is ascribed to an intrinsic yttria emission due to defect states; the former originates from features introduced by the cerium ions. The same behavior is observed on excitation at 350 nm. We can observe that the emission of erbium is also enhanced when cerium is present: this corroborates our hypothesis of an energy transfer process taking place between cerium and erbium ions. This mechanism is even more evident when the excitation wavelength is shifted to 379 nm. Direct excitation of erbium is expected in this case. We can observe a decrease in the intensity of the emission arising from this lanthanide ion when the cerium content increases. Concomitantly, the tail of the emission supposed to arise from the d→f electronic transition in Ce3+ increases in intensity. This evidence supports our thesis about the energy transfer mechanism, and makes us confident in the interpretation of the data we presented in the article. Admittedly, the shape of the emission profile of these samples is slightly different from that displayed by the samples analyzed in the paper. This difference could be due to an effect caused by the old quartz window, and it does not compromise to any extent the interpretations presented above and in the article.
To conclude, although we noted the contamination of the photoluminescence signals of the samples with a signal from the analysis apparatus, we observed that the conclusions drawn for the presented systems are only slightly affected by this misinterpretation. The upconverting and downshifting properties of the systems are still confirmed, as is the energy transfer between the erbium and cerium-related states. Nonetheless, we could not definitively exclude the possibility of the broadband emission arising from defect states instead of the cerium ions themselves, the latter being the most plausible interpretation at the time the article was written.
| This journal is © The Royal Society of Chemistry 2015 |

