
 Open Access Article
 This Open Access Article is licensed under a
 Creative Commons Attribution 3.0 Unported Licence
Halocuprate(I) zigzag chain structures with N-methylated DABCO cations – bright metal-centered luminescence and thermally activated color shifts†‡
Sebastian
Maderlehner§
a,
Markus J.
Leitl§
b,
Hartmut
Yersin
*b and
Arno
Pfitzner
*a
aInstitute for Inorganic Chemistry, University of Regensburg, Universitätsstraße 31, 93053 Regensburg, Germany. E-mail: arno.pfitzner@ur.de; Fax: +49 941 943814551; Tel: +49 941 943 4551
bInstitute for Physical Chemistry, University of Regensburg, Universitätsstraße 31, 93053 Regensburg, Germany. E-mail: hartmut.yersin@ur.de; Fax: +49 941 9434488; Tel: +49 941 943 4464
First published on 5th October 2015
Abstract
Two compounds 1,4-dimethyl-1,4-diazoniabicyclo[2.2.2]octane catena-tetra-μ-halo-dicuprate(I) with DABCOMe2 Cu2X4 (1: X = Br, 2: X = I) were synthesized by hydrothermal reaction of copper(I) halides with the corresponding 1,4-diazoniabicyclo[2.2.2]octane (DABCO) dihydrohalides in an acetonitrile/methanol mixture. Both compounds crystallize monoclinically, 1 with a = 9.169(4) Å, b = 10.916(6) Å, c = 15.349(6) Å, β = 93.93(2)°, V = 1533(1) Å3, Z = 4, space group P21/n (no. 14) and 2 with a = 15.826(9) Å, b = 9.476(5) Å, c = 22.90(2) Å, β = 90.56(5)°, V = 3434(5) Å3, Z = 8, space group P21 (no. 4), respectively (lattice constants refined from powder diffraction data measured at 293 K). The cations in both compounds are formed by in situ N-methylation of DABCOH22+ cations by methanol in a SN2 reaction. Both compounds contain an anionic copper(I) halide chain structure consisting of trans edge-sharing CuX4 tetrahedra. The chains are strongly kinked at every 2nd junction thus forming a zigzag structure. The shortest halide-halide distances are observed between the halide ions of adjacent tetrahedra which are approaching each other due to the kinking. This structure type shows a specific luminescence behavior. Under optical excitation, the compounds exhibit yellow (1) and green (2) emission with photoluminescence quantum yields of ΦPL = 52 and 4%, respectively, at ambient temperature. According to DFT and TDDFT calculations, the emission is assigned to be a phosphorescence essentially involving a metal centered transition between the HOMO consisting mainly of copper 3d and halide p orbitals and the LUMO consisting mainly of copper 4s and 4p orbitals. The temperature dependence of the emission spectra, decay times, and quantum yields has been investigated in detail, especially for 1. From the resulting trends it can be concluded that the emission for T ≤ 100 K stems from energetically lower lying copper halide segments. Such segments represent the structural motif of the halocuprate(I) chains. With increasing temperature energetically higher lying segments are populated which also emit, but open the pathway for thermally activated energy transfer to quenching defects.
Introduction
Halocuprates(I) are built from a very small number of building blocks which is in contrast to their structural diversity. One of these building blocks is the CuX4-tetrahedron (X = Cl, Br, I). All types of linkage between tetrahedral units are observed including face-sharing with Cu–Cu distances shorter than in metallic copper.1,2 This diversity is one reason for the rich structural chemistry of such materials. In the case of [P(C6H5)4]2[Cu2I4], four different polymorphs are known which contain two different conformers of the [Cu2I4]2− anion3,4 and recently, a solvate of a tetraphenylphosphonium iodocuprate(I) containing acetone as solvent molecules was reported.5 Furthermore, another tetraphenylphosphonium iodocuprate(I) containing a polyanion forming a helix built from CuI4-tetrahedra has been reported.6 A quite common structural motif in catena-cuprates(I) is a chain of trans edge-sharing tetrahedra. Several halocuprates(I) with this anionic structural feature are described in the literature.7–15 Typical cations are alkali metals, ammonium, or even copper(II) which is coordinated by four ammine7 or two bidental ethylenediamine ligands.8–10 The same complex anion containing trans edge-sharing tetrahedra was obtained with twofold protonated diamines such as ethylene diamine or piperazine as cations.11 Bromocuprates(I) with similar structures were obtained with N-allylquinolinium,12N-allylmorpholinium,13 4-aminopyridinium,14 and 2,6-diaminopyridinium15 cations, respectively. All of these compounds can be classified into two groups depending on the arrangement of the tetrahedra within the halocuprate(I) complex anions, i.e. as stretched form, similar to the chains of tetrahedra in silicon disulfide,16,17 and as a kinked chain at every 2nd junction causing a zigzag structure of the chain. An inverted chain structure with an N3− anion in the center of the tetrahedra has been observed in lanthanide nitride halides,18,19 lanthanide nitride tellurides20 and alkali metal lanthanide halide tellurides.21 Stretched anti-SiS2 chains are observed within these compounds as well as kinked ones.In situ N-alkylation of DABCO or other amines by methanol has been observed in high pressure experiments22 and hydrothermal syntheses,23–25 respectively. The use of DABCO and its protonated forms in halocuprate(I) syntheses has yielded a Cu4I62− cluster with an in situ mono-methylated DABCO molecule,25 and a 3D inorganic framework structure.26 The crystal structure of 2 has recently been reported in a very brief form.27 Structural data with higher quality are included in this paper.
The structural variability of halocuprate(I) and copper(I) halide clusters results in a rich diversity also in the luminescence properties, as many compounds emit visible light in different spectral regions upon optical excitation.28–42,72,73 Although many studies have been performed during recent years on the emission behavior of Cu(I) complexes due to their potential for use as low-cost emitter materials for OLEDs,36–45,68–72 only very limited investigations in this regard were carried out on copper-halide chains, such as the ones presented in this contribution.46–48,73,75–77
Herein, the syntheses, crystal structures, and photophysical properties of two new luminescent halocuprate(I) compounds containing chains of trans edge-sharing tetrahedra are presented and discussed. This structure type is connected with the occurrence of specific chain segments which largely determine the emission behavior as is elucidated, in particular, for compound 1. Photophysical characterizations are carried out on the basis of detailed temperature-dependent studies of emission spectra, decay times, and quantum yields. DFT and TDDFT calculations were performed to complement the measurements. It was found that at low temperature the emission originates only from one type of chain segment. With increasing temperature, thermally activated energy transfer along the chain occurs to other chain segments and quenching states.
Experimental
[DABCOMe2][Cu2Br4] (1) and [DABCOMe2][Cu2I4] (2) were synthesized in a hydrothermal reaction. The freshly purified copper(I) halide49 and DABCO dihydrobromide50 or DABCO dihydroiodide monohydrate,51 respectively, were weighed in a silica ampoule in a 1.8![[thin space (1/6-em)]](https://www.rsc.org/images/entities/char_2009.gif) :1 ratio to achieve full conversion of the copper(I) halide. A typical reaction mixture contained 170 mg of the copper(I) halide and 180 mg (1) or 191 mg (2), respectively, of the corresponding DABCO dihydrohalide. Methanol (2.5 equivalents referring to DABCO·2HX (X = Br, I) and 1.5 mL acetonitrile were added as solvents. The ampoules were evacuated and sealed after freezing of the solvent with liquid nitrogen and were then transferred into a micro autoclave containing 5 mL of water to apply counter pressure. The reactions were performed at 150 °C for 5 days (1) or 130 °C for 14 days (2), respectively, yielding a pure product of colorless rod-like crystals in a 90% isolated yield referring to the amount of copper(I) halide. The rest of copper(I) halide remained in solution. Crystals suitable for single crystal X-ray structure determination were mounted on and glued to a glass fiber.
:1 ratio to achieve full conversion of the copper(I) halide. A typical reaction mixture contained 170 mg of the copper(I) halide and 180 mg (1) or 191 mg (2), respectively, of the corresponding DABCO dihydrohalide. Methanol (2.5 equivalents referring to DABCO·2HX (X = Br, I) and 1.5 mL acetonitrile were added as solvents. The ampoules were evacuated and sealed after freezing of the solvent with liquid nitrogen and were then transferred into a micro autoclave containing 5 mL of water to apply counter pressure. The reactions were performed at 150 °C for 5 days (1) or 130 °C for 14 days (2), respectively, yielding a pure product of colorless rod-like crystals in a 90% isolated yield referring to the amount of copper(I) halide. The rest of copper(I) halide remained in solution. Crystals suitable for single crystal X-ray structure determination were mounted on and glued to a glass fiber.
Diffraction data of 1 were collected on a STOE IPDS I (Mo-Kα, λ = 0.71073 Å) at room temperature. Data were corrected for Lorentz and polarization effects and absorption was corrected numerically after a semi-empirical optimization of the crystal shape.52 The structure was solved by direct methods using SIR9253 followed by a full-matrix least-squares refinement with SHELXL97.54 Hydrogen atom positions could be located from difference Fourier calculations and were refined without constraints but fixed Uiso = 0.035 Å2 for methylene group hydrogen and 0.050 Å2 for methyl group hydrogen, respectively.
Diffraction data of 2 were collected on an Xcalibur Ruby Gemini Ultra (Mo-Kα, λ = 0.71073 Å) at 123 K. Data were corrected for Lorentz and polarization effects and a numerical absorption correction was performed after semi-empirical optimization of the crystal shape.55 Solution and refinement of the structure were performed analogously to 1. Hydrogen atoms were attached to the carbon atoms and refined with a riding model (HFIX 23 for methylene groups) and with circular Fourier (HFIX 137 for methyl groups), respectively. An isotropic displacement parameter Uiso(H) of 1.2 Ueq(C) (1.5 Ueq(C) for methyl group hydrogens) was constrained for the hydrogen atoms.54 The single crystal used for data collection turned out to be twinned according to the matrix (−1 0 0, 0 −1 0, 0 0 1), i.e., a twofold axis along c. Both domains showed racemic twinning due to the acentric space group. Proportions of the 4 domains refined to 45.6% for the main domain, 43.5% for the 2nd domain, 5.5% for the racemic twin of the main domain, and 5.4% for the racemic twin of the 2nd domain, respectively. Anisotropic refinement of carbon and nitrogen atoms did not provide any reasonable results. For this reason they were refined only with isotropic displacement parameters. Further crystallographic data and refinement details are displayed in Table 1.
| Compound | 1 | 2 |
|---|---|---|
| a Lattice constants of 1 were refined from powder diffraction data. | ||
| Empirical formula | Br4C8Cu2H18N2 | C8Cu2H18I4N2 |
| Formula weight | 588.96 | 776.92 |
| Crystal system | Monoclinic | Monoclinic |
| Space group | P21/n (no. 14) | P21 (no. 4) |
| Unit cell dimensionsa | a = 9.169(4) Å | a = 15.8121(2) Å |
| b = 10.916(6) Å; β = 93.93(2)° | b = 9.4130(1) Å; β = 90.011(1)° | |
| c = 15.349(6) Å | c = 22.9117(3) Å | |
| Volume, Z | 1533(2) Å3, 4 | 3410.16(7) Å3, 8 |
| Crystal size/mm3 | 0.2 × 0.1 × 0.07 | 0.25 × 0.2 × 0.15 |
| Density ρcalc | 2.552 g cm−3 | 3.027 g cm−3 |
| Absorption coefficient μ(MoKα) | 13.179 mm−1 | 9.717 mm−1 |
| Temperature | 293 K | 123 K |
| F 000 | 1112 | 2800 |
| θ range for data collection | 2.29 to 25.45° | 3.08 to 28.70° |
| Limiting indices | −11 ≤ h ≤ 11, −13 ≤ k ≤ 13, −18 ≤ l ≤ 18 | −21 ≤ h ≤ 21, −12 ≤ k ≤ 11, −30 ≤ l ≤ 27 |
| Reflections collected | 18384 |
21747 |
| Independent reflections | 2821 [Rint = 0.0501] | 14978 [Rint = 0.0273] |
| Data/restraints/parameters | 2821/0/199 | 14978/1/388 |
| Goof S | 1.040 | 1.038 |
| Final R indices [I > 2σ(I)] | R 1 = 0.0326, wR2 = 0.0665 | R 1 = 0.0337, wR2 = 0.0756 |
| R indices (all data) | R 1 = 0.0457, wR2 = 0.0698 | R 1 = 0.0340, wR2 = 0.0759 |
| Weighting coefficients | a = 0.0394, b = 0 | a = 0.0302, b = 0 |
| Δρmin, Δρmax/e Å−3 | 0.629, −0.482 | 1.078, −1.048 |
Powder diffraction patterns of 1 and 2 were collected on a STOE STADI P (Cu-Kα1, λ = 1.540598 Å) to confirm purity of the products, see ESI Fig. S1 and S2.‡ IR spectra of the products and the DABCO dihydrohalides were collected on a Varian Fourier transform Raman Module coupled to a Varian 670 IR-FT-IR spectrometer using ATR technique to approve quantitative twofold N-methylation of the DABCO molecules within 1 and 2, see ESI Fig. S3 and S4.‡ The IR-spectra were processed with the Varian Resolutions Pro software.56
NHC elemental analyses were performed on a Vario micro cube Elementar Analysensysteme GmbH and the calculated values match very well: 1 calculated: N 4.8%, H 3.1%, C 16.3%; found: N 4.8%, H 3.0%, C 16.5%; 2 calculated: N 3.6%, H 2.3%, C 12.4%; found: N 3.5%, H 2.3%, C 12.5%.
Emission and excitation spectra were recorded using a Fluorolog 3-22 (Horiba Jobin Yvon) spectrometer. Emission decay times were measured with a cooled photomultiplier (RCA C7164R) combined with a FAST ComTec multichannel scaler PCI card. For excitation, a pulsed Nd:YAG laser (λexc = 355 nm) was used and the signal was detected at the respective emission maximum. The temperature dependent measurements between 10 and 300 K (emission spectra and decay times) were recorded using a helium cryostat (Cryovac Konti Cryostat IT). For absolute measurements of the photoluminescence quantum yields, a Hamamatsu Photonics (C9920-02) system was used. For this, the excitation wavelength was set to λexc = 350 nm. DFT and TDDFT calculations were performed using the Gaussian09 software package. For all calculations, the basis set LANL2DZ with an effective core potential was applied along with the B3LYP hybrid functional. The calculations were performed using the geometry obtained from X-ray diffraction measurements without further optimization.
Results and discussion
Crystal structures
Compounds 1 and 2 contain the tetra-μ-halo-dicuprate(I) polyanion consisting of exclusively edge-sharing CuX4-tetrahedra (X = Br, I). These chains of tetrahedra are strongly kinked at every 2nd junction in 1 and 2 thus forming zigzag chains. The chains are arranged along [0 1 0] in 1 and along [0 0 1] in 2, respectively, forming a hexagonal rod packing in both compounds. In 1, all chains have the same alignment and are in an almost eclipsed conformation parallel to the chain direction. In contrast in 2, the chains are arranged in an ABAB stacking along [1 0 0] and show a significant staggering parallel to the chain direction, see Fig. 1. The staggering causes a doubling of the translation period of the chains in 2, see Table 1. The crystallographic data given in Table 1 show some clear differences between the compounds under discussion. This holds regardless of the fact that they contain the same cation and very similar polyanions. The lower symmetry of 2 is manifested by the staggering of the polyanions therein. This results in a symmetry reduction of the centrosymmetric space group P21/n of 1 to the acentric space group P21 of 2 in combination with a doubling of the unit cell volume.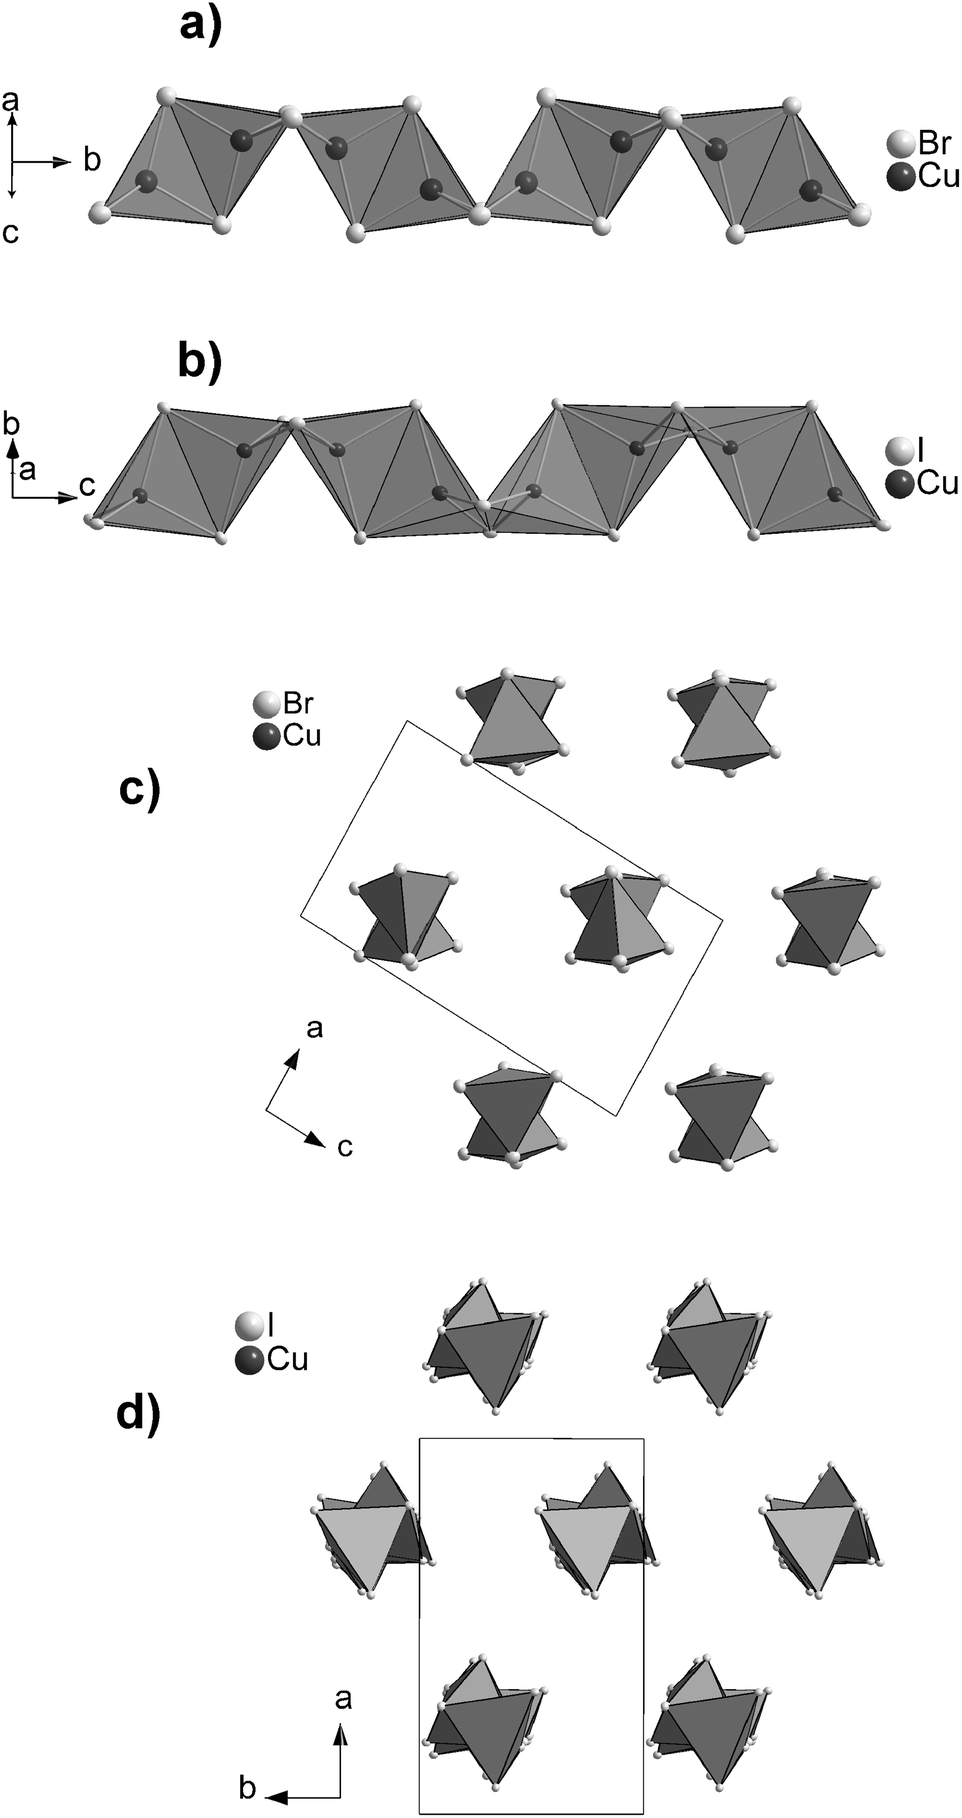 | ||
| Fig. 1 Cu2X4 chains (X = Br, I) in 1 (a) and 2 (b) showing the strong kinking. Projections are displayed for 1 (c) and 2 (d) showing the hexagonal packing of the chains and the AB-stacking of two different orientations in 2. | ||
As mentioned above, a chain of tetrahedra kinked at every 2nd junction has already been reported in the literature.7,12,20,27 This was observed in the N-allylquinolinium bromocuprate(I),12 in the rubidium and ammonium iodocuprate(I) hydrates7 and in the rare earth (RE) nitride tellurides RE4N2Te3 (RE = La–Nd).20 The diammonium and dirubidium bis(di-μ-iodo-cuprate(I)) hydrates7 show a kinking comparable to that in 1 and 2. Within the former, the distances d(I–I) between adjacent CuI4-tetrahedra are shorter than some of the intra-tetrahedral distances d(I–I). The strong kinking results in short distances d(Cu–Cu) in the ammonium and rubidium iodocuprates(I)7 as well as in the title compounds. The shortest distances of d(Cu–Cu) = 2.809(3) Å in [(NH4)2(H2O)][Cu2I4]7 and d(Cu–Cu) = 2.897(3) Å in [Rb2(H2O)][Cu2I4]7 are slightly longer than the sum of the van der Waals radii57 of 2.8 Å, whereas the shortest distances of d(Cu–Cu) = 2.740(2) Å in 1 and d(Cu–Cu) = 2.679(0) Å in 2 are significantly shorter. All these distances are longer than the distance d(Cu–Cu) of 2.556 Å in metallic copper.58 This is not surprising since only those iodocuprates(I)59–61 and bromocuprates(I)62 containing face-sharing CuX4-tetrahedra (X = Br, I) show distances d(Cu–Cu) in the range from 2.45 to 2.50 Å which are shorter than in metallic copper.58 Structural details for the different halocuprates(I) and for La4N2Te3 (as a representative for the RE-nitride tellurides) are given in Table 2.
| Compound/cation | d(Cu–X)/Å | d(Cu–Cu)/Å | ∠(X–Cu–X)/° | ∠(Cu–X–X–Cua)/° | d(X–Xb)/Å | d(X–Xc)/Å |
|---|---|---|---|---|---|---|
| a Dihedral angle at the kinked junction. b Within the CuX4 tetrahedra. c Between neighboring CuX4 tetrahedra (X = Br, I), see Fig. 2. | ||||||
| 1 | 2.492–2.575 | 2.740–2.970 | 102–118 | 119 | 3.99–4.35 | 3.874 |
| 2 | 2.643–2.706 | 2.679–3.352 | 101–120 | 117–121 | 4.099–4.624 | 4.059–4.139 |
| NH4+ (ref. 4) | 2.631–2.697 | 2.809, 3.102 | 106–117 | 132–160 | 4.239–4.496 | 4.424–5.650 |
| Rb+ (ref. 4) | 2.628–2.715 | 2.897, 3.098 | 107–118 | 133–157 | 4.281–4.518 | 4.511–5.730 |
| N-Allyl-quinolinium6 | 2.50–2.623 | 3.305, 3.620 | 91–124 | 155 | 3.649–4.42 | 6.243 |
| La4N2Te311 |
2.337–2.371 | 3.029, 3.106 | 96–118 | 146 | 3.525–4.070 | 4.718 |
The chains in 1 and 2 show the strongest kinking in the series of compounds displayed in Table 2, since the shortest distances d(X–X) are observed between neighboring CuX4-tetrahedra at the kinked junctions. A closer look at the angles ∠(X–Cu–X) and at the intra-tetrahedra distances dedge(X–X) reveals significant distortions from an ideal tetrahedron within all compounds. The strongest distortion is found in the N-allylquinolinium compound due to a stretching of the bromocuprate(I) chain along the chain.12 The dihedral angle between the faces of two undistorted edge-sharing tetrahedra should lie in the range from 66.0 to 70.5° to avoid distances d(X–X) at the kinking shorter than the intra-tetrahedron distances.63 The dihedral angle between the faces is 62.0° in 1 and 62.1–63.3° in 2.
The title compounds contain twofold N-methylated DABCO cations which take a staggered conformation with the dihedral angles ∠(N–C–C–N) of 14.8–16.5° in 1 and 0.8–16.4° in 2, respectively. The cations are embedded between the anionic halocuprate(I) chains with each cation next to an almost planar face of a kinked junction, see Fig. 3. This figure shows that the space required by the cations matches the size of the plain face of the kinked tetrahedra junction quite well. In 1, the cations have only one orientation with a small tilt of the N–N axis apart from the chain direction while in 2 the cations show two different orientations. One of them is similar to the orientation of the cations in 1 with a stronger tilt of the N–N axis. The second orientation is almost parallel to the chain direction, see Fig. 3. The tilted cations in 2 have a stronger staggered conformation with the dihedral angles ∠(N–C–C–N) of 10.0–16.4° than those oriented parallel to the chains with the dihedral angles ∠(N–C–C–N) of 0.8–4.5°.
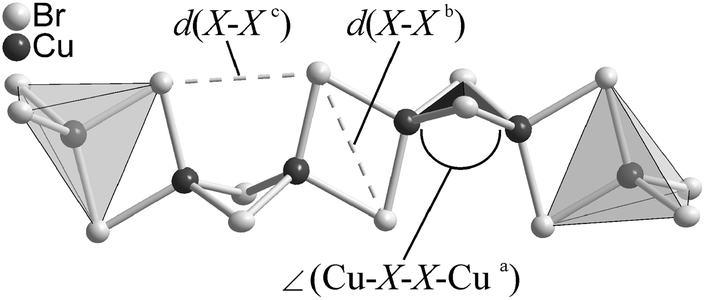 | ||
| Fig. 2 Section of the chain structure in 1. Distances and angles given in Table 2 are labeled. | ||
 | ||
| Fig. 3 Orientation of the cations in 1 (X = Br) (a) and 2 (X = I) (b) relative to the anionic chain structure, showing two alternating orientations in 2. Hydrogen atoms are omitted for clarity. | ||
The cations are formed by an in situ di-methylation of DABCO by methanol which is possible due to the enhanced pressure during the hydrothermal reaction, see Scheme 1.
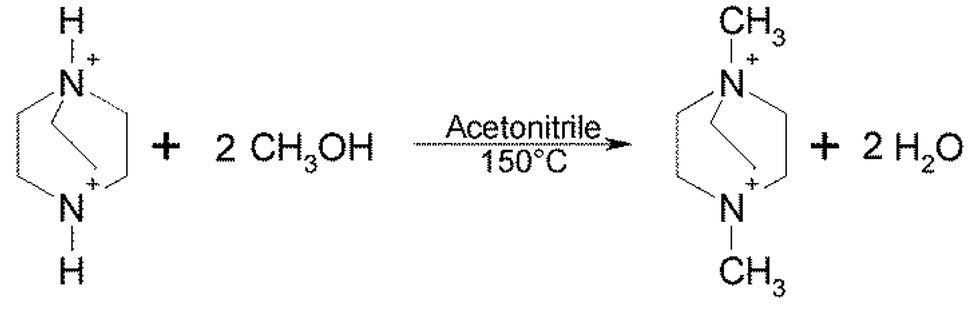 | ||
| Scheme 1 Twofold N-methylation of DABCO by methanol. | ||
It is well known that the size or volume per charge of the cation has a strong influence on the size and shape of the halocuprate(I) complex anion.1,2,64 Sometimes choosing a particular cation allows for the prediction of the anionic structure.65 The DABCOMe22+ cations in 1 and 2 have a quite high charge density. The two positive charges of the molecular cation are located at the nitrogen atoms and are therefore very close to each other with distances d(N–N) of 2.56 Å in 1 and of 2.51 and 2.57 Å in 2, respectively. Halocuprates(I) containing chains of edge-sharing CuX4-tetrahedra have one negative charge per tetrahedral unit. This means that each copper atom in 1 and 2 can be assigned to an adjacent nitrogen atom of the cation providing electroneutrality. The kinking of the junction might be a result of the short distances between the charges of the cations. A stretched Cu2X4-chain would lead to a reduced electrostatic interaction of the complex anion and the assigned cations.66 Thus, the structure of the anion in 1 and 2 is mostly determined by the cations.
Photophysical properties
At ambient temperature, powders of the investigated compounds exhibit yellow (1) and green (2) luminescence, respectively, under optical excitation. The corresponding emission spectra along with the excitation spectra are depicted in Fig. 4. The emission of compound 1 peaks at 550 nm, while it is significantly blue-shifted for compound 2 with a maximum at 510 nm. The emission decay times amount to τ = 86 μs (1) and τ = 2.6 μs (2), respectively. For the emission quantum yields ΦPL values of 52% (1) and 4% (2) were found.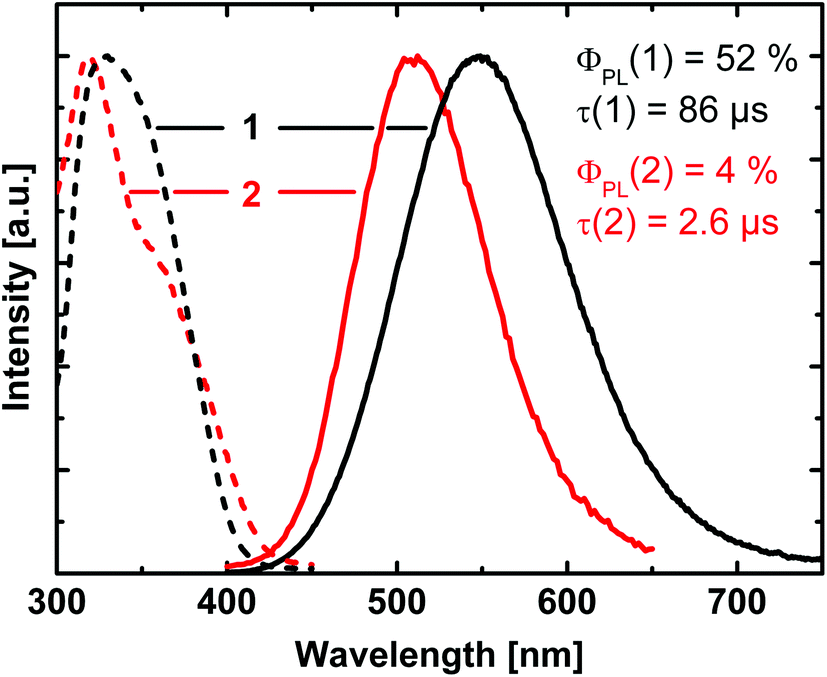 | ||
| Fig. 4 Emission (solid lines) and excitation (dashed lines) spectra of 1 [DABCOMe2][Cu2Br4] (black) and 2 [DABCOMe2][Cu2I4] (red). The spectra were recorded from powders of the substances at ambient temperature (λexc = 350 nm). ΦPL represents the emission quantum yield and τ the emission decay time. | ||
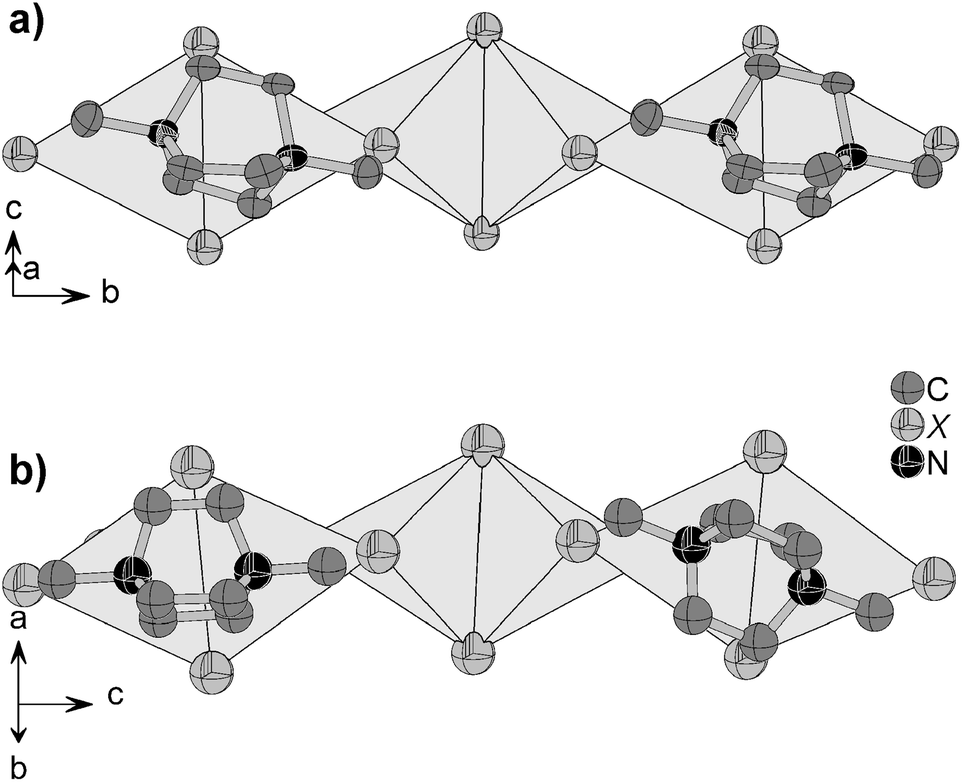
In the following discussion, we will focus on compound 1. DFT and TDDFT calculations were performed to get an insight into the nature of the electronic transition(s) responsible for the luminescence. All calculations were restricted to segments of the copper halide chain which contain 2 copper and 4 bromide atoms. In this rather crude model, the periodicity of the system is neglected. From Fig. 2 (compare also Fig. 6), it can be seen that there are two types of such Cu2Br6 segments. In one type, the two central copper and the two central bromide atoms are arranged in a butterfly like shape (butterfly type, A) whereas in the other segment type these atoms are located in one plane (planar type, B). From the calculations it was found that the HOMOs for both types are located at the copper and bromide atoms, more specifically, the largest contributions to the HOMO stem from Cu 3d orbitals (≈60% (A), ≈70% (B)) and Br 4p orbitals (≈15% (A), ≈20% (B)). The LUMOs are mainly located on the copper atoms with the largest contributions stemming from 4s orbitals (≈55% (A), ≈60% (B)). TDDFT calculations reveal that mainly transitions between the frontier orbitals determine the first excited singlet (S1) and triplet (T1) states for both types of segments. Moreover, as the emission decay time at ambient temperature is of the order of almost 102 μs, the corresponding transition is assigned to be mainly metal-centered phosphorescence (3(MC)) (with distinct halide contributions to the HOMO). The ground state is a singlet. This is in agreement with literature assignments of other, however molecular, halide copper systems.28–35,46,67 Interestingly, the calculations give different transition energies for the T1 states for the two segments differing by about 103 cm−1 (0.12 eV), with segment A being the energetically lower one.
The strong involvement of the Cu 3d orbitals in the HOMO might serve as an explanation for the observed blue shift of about 40 nm of the emission of compound 1 compared to that of 2: the smaller ligand field strength of iodide compared to bromide results in a smaller splitting of the occupied Cu 3d orbitals. As a consequence, the HOMO of 1 is more destabilized than the HOMO of 2. Thus, the emission of 1 appears at lower energy. Indeed, such a destabilization of the HOMO is also confirmed by the DFT calculations. Similar shifts of the emission energies have also been reported for other copper halide systems.36,37,39
For a more detailed understanding of the emission behavior, the samples were cooled to 10 K. With decreasing temperature, a significant unsymmetrical narrowing of the emission spectrum occurs for compound 1. Formally, the emission spectrum is red-shifted from 545 to 575 nm (peak to peak) which is equivalent to about 960 cm−1 (0.12 eV), see Fig. 5. Interestingly, this energy difference is of about the same size as the one estimated from the TDDFT calculations for the transition energies of the two chain segments A and B. Therefore, it is indicated that at low temperature the emission originates from the chain segment which exhibits the lower transition energy. In the case of compound 1, this is segment A. With increasing temperature, a thermal activation of segment B becomes possible, compare Fig. 6. Accordingly, a blue-shift and an unsymmetrical broadening of the emission spectrum are expected to occur upon heating. Indeed, this is observed experimentally. It is mentioned that in a recent report, a similar situation was described for a copper cyanide chain where the occurrence of different emission energies was also attributed to the existence of different chain segments.48
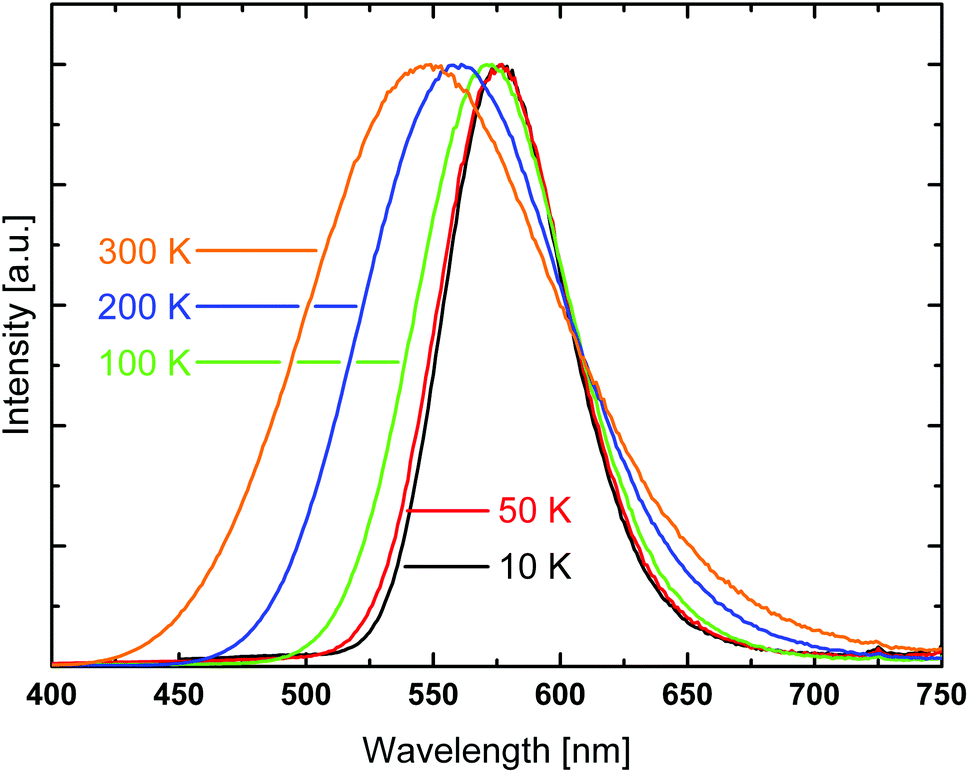 | ||
| Fig. 5 Emission spectra of [DABCOMe2][Cu2Br4] (1) at different temperatures. Excitation wavelength λexc = 350 nm. | ||
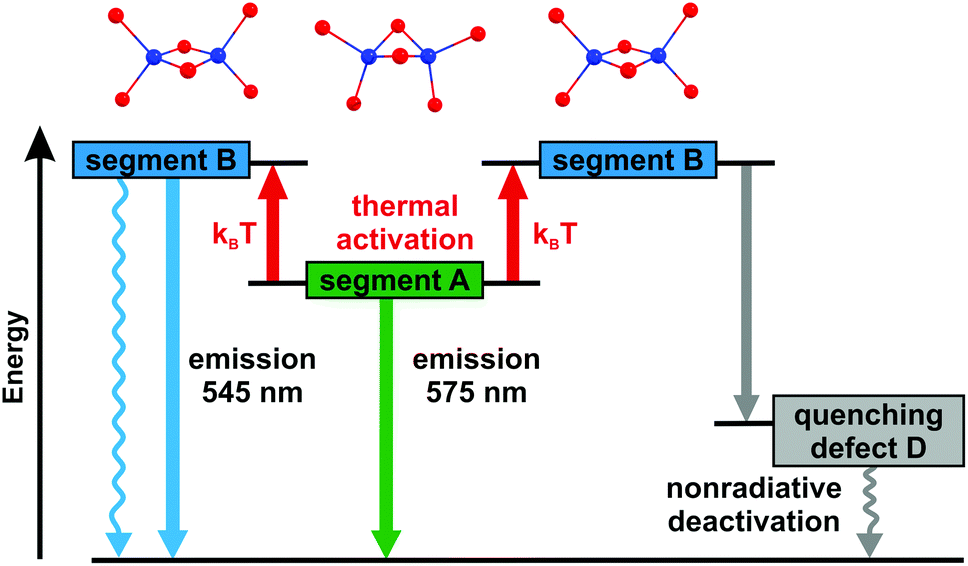 | ||
| Fig. 6 Scheme of a proposed emission and quenching mechanism referring to compound 1. At low temperatures (<50 K), only the energetically lower lying chain segments A emit. With increasing temperature, B segments can be thermally populated and emit at higher energy (≈103 cm−1). However, according to the proposed mechanism, energy can also be transferred along chain segments and thus, reach unavoidable defect sites where the excitation can be deactivated nonradiatively. The structures of the respective chain segment types are displayed above the energy level diagram. Hereby, blue and red spheres represent copper and bromide atoms, respectively. | ||
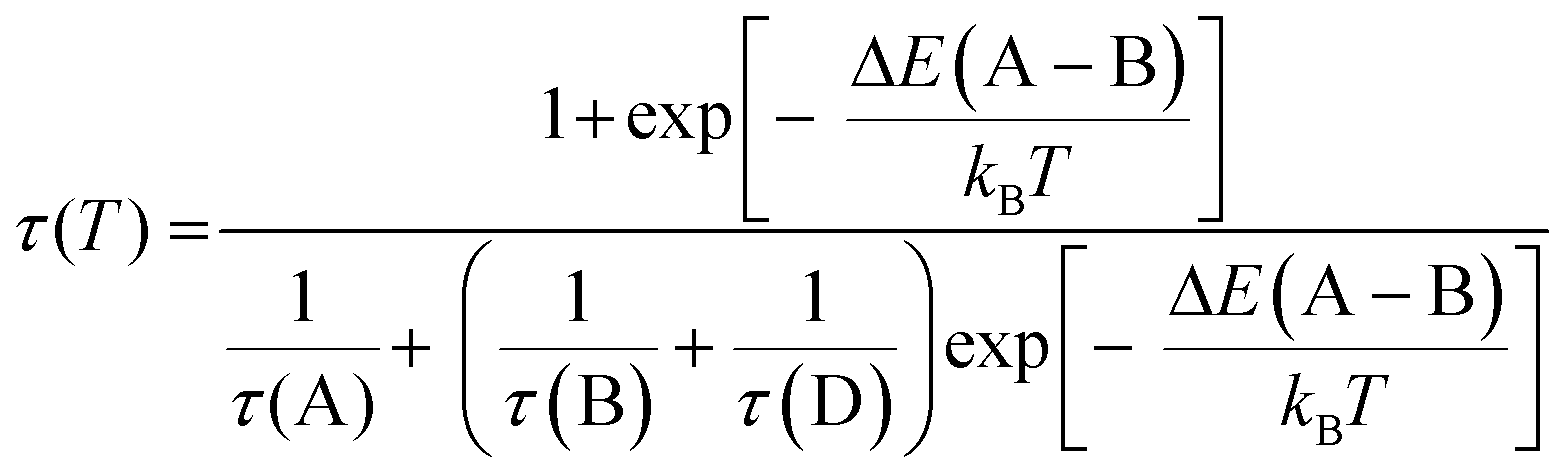
Moreover, the emission decay time of compound 1 was also investigated in dependence of the temperature, see Fig. 7. Between 50 and about 100 K it amounts to about 180 μs. With further increase in temperature, the decay time decreases and reaches 86 μs at 300 K. Additionally, the quantum yields at 77 and 300 K were measured to be ΦPL(77 K) = 85% and ΦPL(300 K) = 52%. This allows us to determine the radiative rates according to kr = ΦPLτ−1. Within experimental error, the radiative rates kr at 77 and 300 K (kr(77 K) = 5 × 10³ s−1, kr(300 K) = 6 × 10³ s−1) are equal. Therefore, the observed decrease of the emission decay time is a consequence of an increase of the nonradiative rate. This behavior can be rationalized by two different quenching mechanisms which are schematically displayed in Fig. 6. If the temperature is high enough, a thermally activated energy transfer between the chain segments can occur, presumably over a larger number of segments.¶ If so, the emission can be quenched by the defects in the chain structure (see Fig. 6, right-hand side).|| Moreover, B-type chain segments themselves can exhibit an additional non-radiative decay channel to the ground state which becomes effective on thermal activation of these chain segments (see Fig. 6, left-hand side). Also, a combination of both effects can occur.
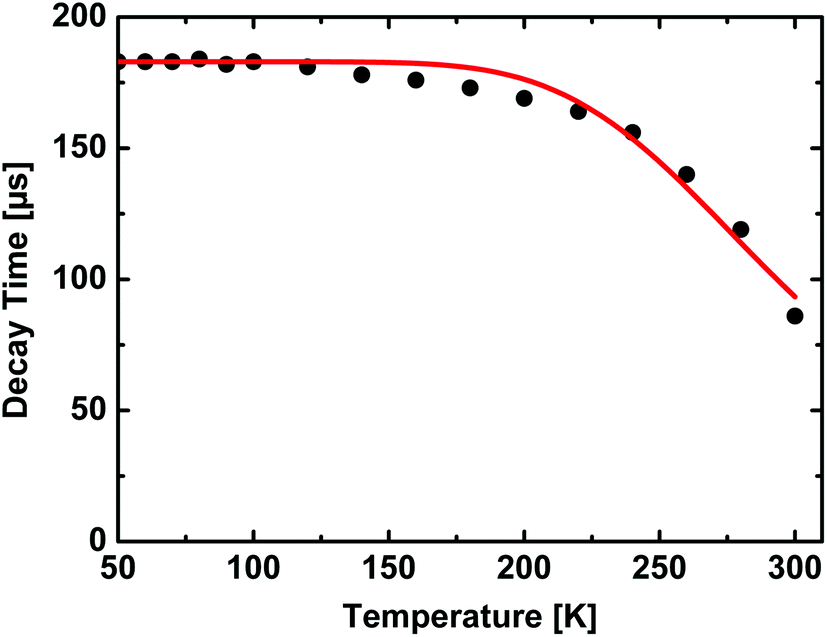 | ||
| Fig. 7 Temperature dependent emission decay time of [DABCOMe2][Cu2Br4] (1). As excitation light source a Nd:YAG laser with a wavelength of 355 nm was used. The red line represents a fit according to eqn (1). | ||
Thermally activated processes can (in the case of fast thermal equilibration) be described by modified Boltzmann functions which are often found in the literature.36,43–45Eqn (1) represents an adaption of such a function to the system investigated in this contribution. Fitting this equation to the experimental data of decay time versus temperature, as shown in Fig. 7, allows us to estimate the activation energy for the quenching processes.
 | (1) |
From fitting the data displayed in Fig. 7 with eqn (1) it is found that the activation energy amounts to about 1300 cm−1 (0.16 eV). This value is in reasonable agreement with the values determined for the energy difference between the two segments by the TDDFT calculations (≈103 cm−1) and the shift of the emission energy with temperature (≈960 cm−1, Fig. 5). Further support for this model is given by the fact that the decrease of the emission decay time is paralleled by the broadening of the emission spectra above T ≈ 100 K. Therefore, it is not unreasonable to assume that both effects are caused by the same activation mechanism.
For completeness, it is mentioned that the observed decrease of the emission decay time with increasing temperature is not in agreement with a thermally activated delayed fluorescence (TADF) which is often found for molecular copper compounds, as the decrease found here is a result of a thermally activated quenching mechanism in contrast to the population of a highly emissive singlet state in the TADF case.36,37,39,43–45,69–71
Conclusions
Two halocuprates(I) 1,4-dimethyl-1,4-diazoniabicyclo[2.2.2]octane catena-tetra-μ-halo-dicuprate(I) with DABCOMe2 Cu2X4 (1: X = Br, 2: X = I) have been synthesized and characterized by single crystal X-ray diffraction and luminescence spectroscopy. The use of methanol as a high pressure methylation agent yields twofold N-methylated DABCO cations formed in an in situ SN2-reaction similar to reactions under extreme conditions reported in the literature.22–25 The influence of the cation size on the structure of the halocuprate(I) anion becomes obvious from their crystal structures: a polyanion built of edge-sharing CuX4-tetrahedra (X = Br, I) is formed due to the high charge density of the DABCOMe22+ cation. This is in perfect agreement with the tendency that highly charged cations yield polymeric halocuprate(I) anions with tetrahedrally coordinated copper atoms.1,2The luminescence properties of both compounds were examined in detail. It was found that the emission results largely from a metal centered phosphorescence with distinct contributions of the halides to the HOMO. An analysis of the temperature dependence of the emission spectra, quantum yields, and of the decay times suggests for compound 1 that at low temperature, the emission originates only from an energetically lower lying segment of the [DABCOMe2][Cu2Br4] chain, while with temperature increase, energy states of an energetically higher lying segment are populated. This opens the pathway for an energy transfer along the chain but also for non-radiative deactivation channels either at the higher energy segments themselves or by energy transfer to defect sites. The activation energy for this process was determined to be in the range of 1000–1300 cm−1 (0.12–0.16 eV).
Acknowledgements
We gratefully acknowledge funding by the German Ministry of Education and Research (BMBF) in the scope of the cyCESH project (FKN 13N12668).References
- C. Hasselgren Arnby, S. Jagner and I. Dance, CrystEngComm, 2006, 46, 257 Search PubMed.
- S. Jagner and G. Helgesson, Adv. Inorg. Chem., 1991, 37, 1 CrossRef CAS.
- H. Hartl, I. Brüdgam and F. Mahdjour-Hassan-Abadi, Z. Naturforsch., B: Anorg. Chem. Org. Chem., 1985, 40, 1032 Search PubMed.
- A. Pfitzner and D. Schmitz, Z. Anorg. Allg. Chem., 1997, 623, 1555 CrossRef CAS PubMed.
- E. Jalilian, R.-Z. Liao, F. Himo, H. Brismar, F. Laurell and S. Lidin, CrystEngComm, 2011, 13, 4729 RSC.
- H. Hartl and F. Mahdjour-Hassan-Abadi, Angew. Chem., 1994, 106, 1929 CrossRef CAS PubMed; H. Hartl and F. Mahdjour-Hassan-Abadi, Angew. Chem., Int. Ed. Engl., 1994, 33, 1841 CrossRef PubMed.
- M. Hoyer and H. Hartl, Z. Anorg. Allg. Chem., 1991, 598/599, 151 CrossRef PubMed.
- R. P. Hammond, D. J. Chesnut and J. A. Zubieta, J. Solid State Chem., 2001, 158, 55 CrossRef CAS.
- B. Freckmann and K. F. Tebbe, Z. Naturforsch., B: Anorg. Chem. Org. Chem., 1980, 35, 1319 Search PubMed.
- O. Simonsen and H. Toftlund, Acta Crystallogr., Sect. C: Cryst. Struct. Commun., 1987, 43, 831 CrossRef.
- E. Redel, M. Fiederle and C. Janiak, Z. Anorg. Allg. Chem., 2009, 635, 1139 CrossRef CAS PubMed.
- A. V. Pavlyuk, V. N. Davydov and M. G. Mys'kiv, Koord. Khim., 2003, 29, 199 CrossRef CAS.
- E. A. Goreshnik and M. G. Mys'kiv, Koord. Khim., 2003, 29, 541 Search PubMed.
- J. Sertucha, A. Luque, F. Lloret and P. Román, Polyhedron, 1998, 17, 3875 CrossRef CAS.
- S.-H. Liu, J.-D. Chen, L.-S. Liou and J.-C. Wang, Inorg. Chem., 2001, 40, 6499 CrossRef CAS.
- E. Zintl and K. Loosen, Z. Phys. Chem., 1935, 174, 301 Search PubMed.
- W. Büssem, H. Fischer and E. Gruner, Naturwissenschaften, 1935, 23, 740 CrossRef.
- S. Uhlandt and G. Meyer, J. Alloys Compd., 1995, 225, 171 CrossRef.
- C. M. Schurz and Th. Schleid, J. Alloys Compd., 2009, 485, 110 CrossRef CAS PubMed.
- F. Lissner and Th. Schleid, Z. Anorg. Allg. Chem., 2005, 631, 1119 CrossRef CAS PubMed.
- C. M. Schurz and Th. Schleid, J. Solid State Chem., 2010, 183, 2253 CrossRef CAS PubMed.
- A. Olejniczak and A. Katrusiak, CrystEngComm, 2010, 12, 2528 RSC.
- Q. Hou, J.-J. Zhao, T.-Q. Zhao, J. Jin, J.-H. Yu and J.-Q. Xu, J. Solid State Chem., 2011, 184, 1756 CrossRef CAS PubMed.
- H. Chan, Y. Chen, M. Dai, C.-N. Lü, H.-F. Wang, Z.-G. Ren, Z.-J. Huang, C.-Y. Ni and J.-P. Lang, CrystEngComm, 2012, 14, 466 RSC.
- Q. Hou, X.-J. Qu, J. Jin, J.-J. Zhao, J.-H. Yu and J.-Q. Xu, J. Cluster Sci., 2011, 22, 715 CrossRef CAS.
- J. Song, Y. Hou, L. Zhang and Y. Fu, CrystEngComm, 2011, 13, 3750 RSC.
- J.-J. Hou, S.-L. Li, C.-R. Li and X.-M. Zhang, Dalton Trans., 2010, 39, 2701–2707 RSC.
- N. P. Rath and E. M. Holt, Inorg. Chem., 1985, 24, 3934 CrossRef CAS.
- M. Vitale, W. E. Palke and P. C. Ford, J. Phys. Chem., 1992, 96, 8329 CrossRef CAS.
- P. C. Ford and A. Vogler, Acc. Chem. Res., 1993, 26, 220 CrossRef CAS.
- P. C. Ford, E. Cariati and J. Bourassa, Chem. Rev., 1999, 99, 3625 CrossRef CAS PubMed.
- M. Vitale and P. C. Ford, Coord. Chem. Rev., 2001, 219–221, 3–16 CrossRef CAS.
- C. K. Ryu, M. Vitale and P. C. Ford, Inorg. Chem., 1993, 32, 869 CrossRef CAS.
- E. Cariati and J. Bourassa, Chem. Commun., 1998, 1623 RSC.
- E. Cariati, X. Bu and P. C. Ford, Chem. Mater., 2000, 12, 3385 CrossRef CAS.
- M. J. Leitl, F.-R. Küchle, H. A. Mayer, L. Wesemann and H. Yersin, J. Phys. Chem. A, 2013, 117, 11823–11836 CrossRef CAS PubMed.
- D. M. Zink, M. Bächle, T. Baumann, M. Nieger, M. Kühn, C. Wang, W. Klopper, U. Monkowius, T. Hofbeck, H. Yersin and S. Bräse, Inorg. Chem., 2013, 52, 2292–2305 CrossRef CAS PubMed.
- Z. Liu, P. I. Djurovich, M. T. Whited and M. E. Thompson, Inorg. Chem., 2012, 51, 230–236 CrossRef CAS PubMed.
- M. Wallesch, D. Volz, D. M. Zink, U. Schepers, M. Nieger, T. Baumann and S. Bräse, Chem. – Eur. J., 2014, 20, 6578 CrossRef CAS PubMed.
- Z. Liu, J. Qiu, F. Wei, J. Wang, X. Liu, M. G. Helander, S. Rodney, Z. Wang, Z. Bian, Z. Lu, M. E. Thompson and C. Huang, Chem. Mater., 2014, 26, 2368 CrossRef CAS.
- K. Tsuge, Chem. Lett., 2013, 42, 204–208 CrossRef CAS.
- P. C. Ford, Coord. Chem. Rev., 2011, 132, 129–140 CrossRef.
- R. Czerwieniec, J. Yu and H. Yersin, Inorg. Chem., 2011, 50, 8293–8301 CrossRef CAS PubMed.
- H. Yersin, A. F. Rauch, R. Czerwieniec, T. Hofbeck and T. Fischer, Coord. Chem. Rev., 2011, 255, 2622–2652 CrossRef CAS PubMed.
- R. Czerwieniec, K. Kowalski and H. Yersin, Dalton Trans., 2013, 42, 9826–9830 RSC.
- X. Liu, G.-C. Guo, A.-Q. Wu, L.-Z. Cai and J.-S. Huang, Inorg. Chem., 2005, 44, 4282–4286 CrossRef CAS PubMed.
- J.-K. Cheng, Y.-G. Yao, J. Zhang, Z.-J. Li, Z.-W. Cai, X.-Y. Zhang, Z.-N. Chen, Y.-B. Chen, Y. Kang, Y.-Y. Qin and Y.-H. Wen, J. Am. Chem. Soc., 2004, 126, 7796–7797 CrossRef CAS PubMed.
- C. Bayse, L. K. Harper, J. L. Ming and R. D. Pike, Dalton Trans., 2014, 43, 11243–11251 RSC.
- A. Pfitzner, Chem. – Eur. J., 2000, 6, 1891 CrossRef CAS.
- M. Andrzejewski, A. Olejniczak and A. Katrusiak, Cryst. Growth Des., 2011, 11, 4892 CAS.
- S. Maderlehner and A. Pfitzner, Z. Kristallogr., 2012, 227, 569 CAS.
- X-RED32, STOE & Cie GmbH, Darmstadt, 2004 Search PubMed; X-SHAPE, STOE & Cie GmbH, Darmstadt, 1999 Search PubMed.
- A. Altomare, G. Cascarano, C. Giacovazzo and A. Gualardi, J. Appl. Crystallogr., 1993, 26, 343 CrossRef.
- G. M. Sheldrick, Acta Crystallogr., Sect. A: Fundam. Crystallogr., 2008, 64, 112 CrossRef CAS PubMed.
- CrysalisPro software, Version 1.171.35.11, Agilent Technologies, 2011 Search PubMed.
- Resolutions Pro software, Version 4.1.0.101, Molecular Spectroscopy Solutions, Varian Inc., 2006 Search PubMed.
- J. K. Nagle, J. Am. Chem. Soc., 1990, 112, 4741 CrossRef CAS; A. Bondi, J. Phys. Chem., 1964, 68, 441–451 CrossRef.
- W. L. Bragg, Philos. Mag., 1914, 28, 255 Search PubMed.
- A. K. Nurtaeva and E. M. Holt, Acta Crystallogr., Sect. C: Cryst. Struct. Commun., 1998, 54, 594 Search PubMed.
- H. Hartl and F. Mahdjour-Hassan-Abadi, Angew. Chem., 1981, 93, 804 ( Angew. Chem., Int. Ed. , 1981 , 20 , 772 ) CrossRef CAS PubMed.
- S. Andersson and S. Jagner, Acta Chem. Scand., Ser. A, 1985, 39, 181 CrossRef.
- W. Wang, L. Zhang, X.-B. Xu and Q. Ye, Inorg. Chem. Commun., 2011, 14, 626–631 CrossRef CAS PubMed.
- U. Müller, Inorganic Structural Chemistry, John Wiley & Sons Ltd, The Atrium, Southern Gate, Chichester, West Sussex PO19 85Q, England, 2nd edn, 2007 Search PubMed.
- E. Jalilian and S. Lidin, CrystEngComm, 2011, 13, 5730 RSC.
- S. Andersson, M. Håkansson and S. Jagner, Inorg. Chim. Acta, 1993, 209, 195 CrossRef CAS.
- S. Lorenzo, C. Horn, D. Craig, M. Scudder and I. Dance, Inorg. Chem., 2000, 39, 401 CrossRef CAS.
- A. Vogler and H. Kunkely, J. Am. Chem. Soc., 1986, 108, 7211–7212 CrossRef CAS.
- M. J. Leitl, V. A. Krylova, P. I. Djurovich, M. E. Thompson and H. Yersin, J. Am. Chem. Soc., 2014, 136, 16032–16038 CrossRef CAS PubMed.
- R. Czerwieniec and H. Yersin, Inorg. Chem., 2015, 54, 4322–4327 CrossRef CAS PubMed.
- C. Linfoot, M. J. Leitl, P. Richardson, A. F. Rausch, O. Chepelin, F. J. White, H. Yersin and N. Robertson, Inorg. Chem., 2014, 53, 10854–10861 CrossRef CAS PubMed.
- T. Hofbeck, U. Monkowius and H. Yersin, J. Am. Chem. Soc., 2015, 137, 399 CrossRef CAS PubMed.
- F. Wu, J. Li, H. Tong, Z. Li, C. Adachi, A. Langlois, P. D. Harvey, L. Liu, W.-Y. Wong, W.-K. Wong and X. Zhu, J. Mater. Chem. C, 2015, 3, 138–146 RSC.
- F. Wu, H. Tong, Z. Li, W. Lei, L. Liu, W.-Y. Wong, W.-K. Wong and X. Zhu, Dalton Trans., 2014, 43, 12463–12466 RSC.
- D. L. Dexter and J. H. Schulman, J. Chem. Phys., 1954, 22, 1063–1070 CrossRef CAS PubMed.
- G. Zeng, S. Xing, X. Han, B. Xin, Y. Yang, X. Wang, G. Li, Z. Shi and S. Feng, R. Soc. Chem. Adv., 2015, 5, 40792–40797 CAS.
- Y. Song, R. Fan, P. Wang, X. Wang, S. Gao, X. Du, Y. Yang and T. Luan, J. Mater. Chem. C, 2015, 3, 6249–6259 RSC.
- M. Knorr, A. Bonnot, A. Lapprand, A. Khatyr, C. Strohmann, M. M. Kubicki, Y. Rousselin and P. D. Harvey, Inorg. Chem., 2015, 54(8), 4076–4093 CrossRef CAS PubMed.
Footnotes |
| † Dedicated to Prof. Dr. Henri Brunner on the occasion of his 80th birthday. |
| ‡ Electronic supplementary information (ESI) available: IR spectra of 1, 2, DABCOH2Br2, and DABCOH2I2H2O; experimental and simulated powder diffraction patterns of 1 and 2. CCDC 1410360 and 1410361. For ESI and crystallographic data in CIF or other electronic format see DOI: 10.1039/c5dt02709h |
| § These authors contributed equally to this work. |
| ¶ Cu(I) complexes often undergo distortions on excitation which leads to a trapping of the excitation energy on one specific emitter molecule and therefore, prohibits an efficient energy transfer to adjacent molecules.36,37,43–45 In the case of the compounds presented in this contribution, it seems that this self-trapping mechanism and therefore the localization of the excitation energy at one chain segment is not effective (at ambient temperature) for two reasons. (i) Distortions in molecular Cu(I) complexes on excitation are related to a pronounced charge-transfer from the copper center to the ligand. This leads to a formal oxidation of the copper center and therefore to a geometry change from a pseudo-tetrahedral towards a more planar geometry. For the copper halide chains presented in this study the transitions are mainly metal-centered and therefore, charge-transfer and geometry distortions do not seem to be significant. (ii) Possible geometry distortions are further reduced as the emitting individual chain segments are embedded into the rigid framework of the entire chain. |
| || Defects might be represented by defects in the chain structure itself, boundary effects, or unavoidable impurities in real systems. Energy transfer along the chain is presumably occurring by a Dexter energy transfer process. A corresponding quenching mechanism was already suggested by Dexter and Schulman.74 |
| ** The degeneracy of the deactivating state(s) is not known and therefore, it is set to 1 in this rough estimate. Such a degeneracy factor has significant influence on the emission decay time but only minor influence on the activation energy. Therefore, only the activation energy is estimated. |
| This journal is © The Royal Society of Chemistry 2015 |