DOI:
10.1039/C4DT03623A
(Paper)
Dalton Trans., 2015,
44, 4246-4258
Complexation of Eu(III) with Cucurbit[n]uril, n = 5 and 7: A Thermodynamic and Structural Study†
Received
26th November 2014
, Accepted 13th January 2015
First published on 15th January 2015
Introduction
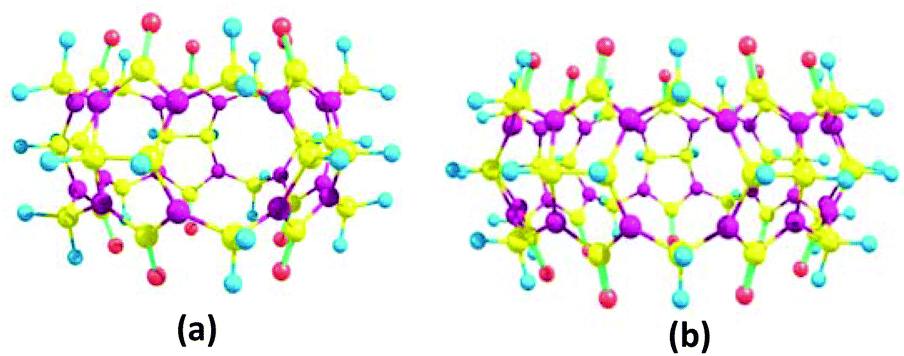
The study on host–guest interactions with macrocyclic ligands like cyclodextrin, calixarenes, and cucurbituril has been an area of great research interest.1–4 The inclusion of guest molecules into complementary host structures has been used to engineer the intrinsic molecular properties of guest molecules for desired applications. These molecules mimic important biological ligands, enhance various photophysical spectroscopic properties, catalyze processes, and alter the reactivity of guest species. These ligands impart a unique stability to the guest moiety through various non-covalent interactions. The molecular organization of these ligands with respect to guest moieties maximizes their interaction and thus provides a unique specificity towards guest species.5 Cucurbit[n]urils (CBn), where n = number of glycolurils, are one of the promising macrocyclic ligands which are formed by the acid catalyzed condensation of glycoluril and formaldehyde and have a high affinity for various organic and inorganic species (Fig. 1).
 |
| | Fig. 1 Structure of (a) CB5 and (b) CB7 (Oxygen atom (red), Hydrogen atom (blue), Nitrogen atom (purple), Carbon atom (yellow)). | |
CBn have a hydrophobic cavity (dia. 4–9 Å) depending on the glycoluril units and a height of 9.1 Å. The presence of the hydrophobic cavity is responsible for their binding with organic guest molecules.6–8 At both the portals of CBn, carbonyl groups are located pointing towards the centre of the portal. These carbonyl groups are responsible for binding to ionic species through ion dipole interactions. The binding of CBn towards guest molecules has been studied by various techniques viz. UV-Vis spectroscopy, 1H-NMR spectroscopy and isothermal calorimetry.6 A binding constant as high as 3 × 10¹⁵ M−1 has been observed for CB7 interaction with a ferrocene derivative.9 In the case of metal–CBn complexes, a large number of crystal structures have been reported with various alkali, alkaline earth, transition metals, lanthanide and actinide ions.10–12 In the solid state, some of the metal ions were found to interact with only a fraction of the carbonyl oxygen atoms of CBn portals. However, transition metal ions do not interact directly but through water molecules coordinated to metal ions.13–15 In recent years, many fascinating crystal structures have been reported by introducing small organic molecules as “structure inducers” in metal CBn complexes.16–19 In most of the cases, complexation of Ln3+ to both the portals of CBn molecules has led to the formation of coordination polymers or two dimensional networks. The binding of metal ions with CBn in solution is less clearly understood due to their low solubility in most of the common solvents. Most of the studies in solution are aimed at understanding the mechanism of binding between alkyl ammonium salts and neutral guest molecules.3,20–22 But complete studies on the thermodynamic and structural parameters for the binding of CBn with metal ions in solution are scarce. Zhang et al. determined the thermodynamic data for the complexation of decamethyl cucurbit[5]uril (MeCB5) with alkali, alkaline earth metals, Pb2+ and Cd2+.23 The authors observed a very high selectivity of MeCB5 for Pb2+. The order of the stability constant for the binding of MeCB5 with alkali and alkaline earth metals was K+ > NH4+ > Rb+ > Li+ > Cs+ and Sr2+ > Ba2+ > Ca2+ > Mg2+ respectively.
So far, a study on the complexation of lanthanide ions with CB5 and CB7 in solution has not been reported in the literature and the studies with CB6 are also limited to the determination of thermodynamic parameters using calorimetry.24 To the best of our knowledge, this is the first report on the structural investigation of CBn (n = 5 and 7) complexes with lanthanides in solution. The molecular structure of complexes in solution provides indepth information about the binding mechanism which in turn helps in designing more efficient host molecules. Time resolved fluorescence spectroscopy (TRFS) and extended X-ray absorption fine structure spectroscopy (EXAFS) are powerful tools for probing the structure of the host–guest complex at the molecular level in solutions. The fluorescence spectra give information about the electronic environment around the metal ion and in some cases (viz. Eu(III)) the number of water molecules in its inner coordination sphere can be determined from the fluorescence lifetime. EXAFS has been extensively used to determine the number and type of atoms present around the probe atom and their distances.25 A systematic study on the complexation of Eu(III) with CB5 and CB7 has been carried out in a formic acid (FAH)–water (50 wt%) medium with the aim to understand the species and structure of the complexes in solution. The stability constant and enthalpy of complexation were determined by UV-Vis spectroscopy and calorimetry and the stoichiometry of complexes obtained from thermodynamic studies was also supported by electron spray ionization–mass spectrometry (ESI-MS) measurements. The coordination of Eu(III) on binding with CBn molecules of different cavity sizes viz. n = 5 and 7 was investigated by EXAFS and TRFS.
Experimental
Reagents and chemicals
Formic acid and nitric acid used in the present work were of A. R. grade and MilliQ water (18 MΩ cm) was used to prepare all solutions. CB5 and CB7 used in the present work were synthesized following the procedure described below.
Experimental procedure for the syntheses of CB5 and CB7
Both CB5 and CB7 were prepared following a reported procedure26: to a suspension of glycoluril (11.4 g, 80.0 mmol) and formaldehyde (37% in water, 14 ml, 172 mmol) at 0–5 °C was added 9 M H2SO4 (40 ml). The solid suspension was heated at 75 °C for 24 h and then further heated at 100 °C for 12 h under stirring. The reaction mixture was cooled to ambient temperature and poured into 400 ml of water. Acetone (2 L) was then added to the mixture to obtain a white precipitate. The mixture was allowed to stand for 15 min, filtered and the residue was washed with a 1![[thin space (1/6-em)]](https://www.rsc.org/images/entities/char_2009.gif) :4 mixture of water–acetone (2 L) twice. The resulting solid was suspended in a 1:1 mixture of water–acetone (400 ml) and stirred for 15 min. The mixture was filtered and the residue was washed with water (200 ml). Acetone (1.5 L) was added to the filtrate to produce a precipitate which was filtered, washed with acetone and dried under vacuum to obtain a colourless solid (a mixture of CB5 and CB7). The solid was further dissolved in water (150 ml) and then methanol was added slowly till precipitation started. The mixture was kept overnight and filtered, washed with methanol and dried under vacuum to yield pure CB7 (0.660 g, 5.0%). To the filtrate acetone was added to precipitate CB5, filtered, washed with acetone and dried to yield pure CB5 (0.300 g, 2.3%). Both CB5 and CB7 were characterized by 1H NMR, 13C NMR and mass spectral (MALDI-TOF) data and matched with those of authentic samples.
:4 mixture of water–acetone (2 L) twice. The resulting solid was suspended in a 1:1 mixture of water–acetone (400 ml) and stirred for 15 min. The mixture was filtered and the residue was washed with water (200 ml). Acetone (1.5 L) was added to the filtrate to produce a precipitate which was filtered, washed with acetone and dried under vacuum to obtain a colourless solid (a mixture of CB5 and CB7). The solid was further dissolved in water (150 ml) and then methanol was added slowly till precipitation started. The mixture was kept overnight and filtered, washed with methanol and dried under vacuum to yield pure CB7 (0.660 g, 5.0%). To the filtrate acetone was added to precipitate CB5, filtered, washed with acetone and dried to yield pure CB5 (0.300 g, 2.3%). Both CB5 and CB7 were characterized by 1H NMR, 13C NMR and mass spectral (MALDI-TOF) data and matched with those of authentic samples.
Preparation of Eu(III) stock solution
Eu2O3 (Merck, purity > 99.99%) was dissolved in nitric acid which was evaporated to dryness and 0.1 M HNO3 was added to the solid residue. The concentration of Eu(III) was standardized by complexometric titration with EDTA using xylenol orange as the indicator. The Eu(III) in nitric acid was evaporated to dryness and an FAH–water mixture (50 wt%) was added to obtain the desired Eu(III) concentration.
Uv-Vis spectroscopy
Uv-Vis spectrophotometric measurements were carried out using a JASCO-630 spectrophotometer. The change in the absorption spectra of CB5 and CB7 in the range 260–330 nm was measured at a scan rate of 200 nm s−1. 2.0 ml of CB5 (9.69 × 10⁻⁴ M) or CB7 (1.28 × 10⁻³ M) in an FAH–water mixture was taken in a cuvette and titrated with Eu(III) in the same medium till the Eu(III) concentration was nearly 3 times excess that of CBn. The absorbance (Ai(λ)) at a particular wavelength (λ) for the ith injection can be related to the free concentrations of different absorbing species (Xij is the concentration of the jth species at the ith injection) using the Lambert Beer's law:where εj(λ) is the molar extinction coefficient of the jth species. The matrix A(N, Λ) for N titration points and Λ spectral points is solved in conjunction with the mass balance equations (3) and (4) for the total metal ion and ligand concentrations respectively to obtain the free concentrations of the species and thereby the equilibrium constant, using Hyperquad 2006.27| | | CTMi = [[M]i + ∑xβxy[M]xi[L]yi] | (3) |
| | | CTLi = [[L]i + ∑yβxy[M]xi[L]yi] | (4) |
where CTMi and CTLi are the total concentrations of metal ions and ligands respectively and [M]i and [L]i are their equilibrium concentrations at the ith injection. Different possible sets of species (x = 1–2 and y = 1–3) were given as the input but the software was converged with a specific set of species to give the lowest χ2.
Calorimetry
Calorimetric experiments were conducted with an isothermal titration calorimeter system (Nanocalorimeter TAM-III, Thermometric AB, Sweden). It is a twin thermopile heat conduction type calorimeter and the differential power signal measured is dynamically corrected for the thermal inertia of the system. Details of the instrument are given elsewhere.28,29 Before each experiment the instrument was calibrated electrically and the performance of the instrument was tested by measuring logK and ΔH for the reaction between BaCl2 and 18C6 in water. The measured heat Qi(ex) at each injection was corrected for the heat of dilution of the titrant Qi(dil) to obtain the net heat of the reaction Qri.| | | Qri = Qi(ex) − Qi(dil) | (5) |
In all calorimetric experiments, 2.7 ml of the ligand solution (4.9 mM CB5/4.5 mM CB7) was taken in a cup and 5 μl of 0.039 M Eu(III) solution in the same medium was injected into the reaction vessel. The heat Qri measured at each injection is related to the concentration of complexes formed and their enthalpy of formation (ΔHn).29
| | | Qri = −(Vi∑βnΔHn[M]i[L]in − Vi−1∑βnΔHn[M]i−1[L]i−1n) | (6) |
where
Vi is the volume of the total solution. Nonlinear least square fitting of the
Qri data was carried out using
eqn (6), in conjunction with
eqn (3) and (4), to obtain the
βn and Δ
Hn values. The first data point (
Qr1) is ignored due to the diffusion of the solution from the capillary to the reaction vessel even before the first injection.
ESI-MS measurements
ESI-MS studies of Eu(III) complexation with CB5 and CB7 in an FAH–water mixture were carried out using a Varian (USA) make instrument (model no. 410) Prostar Binary LC with IT PDA Detectors. Direct infusion masses were collected with a soft ionization technique like ESI (electron spray ionization) in the positive mode using an ion trap.
TRFS measurements
The main aim of TRFS measurements was to obtain information about the primary coordination sphere of the Eu(III) in Eu–CBn complexes which, in turn, provides information about the number of ligand atoms bound to the central metal ion. For this purpose, a TRFS instrument from Jovin Yuon (Sweden) was used. The excitation source is a xenon flash lamp having a frequency of 10 Hz. The excitation wavelength was selected as 396 nm, while the emission spectra were recorded in the wavelength range of 560–640 nm. A monochromatic light from the source falls on the 1 cm thick quartz cell and the fluorescence light emitted at 90° is monitored by an array of diode detectors cooled to −26 °C by the Peltier cooling method. The fluorescence decay spectra were collected in a 2048 channel analyser with a time calibration of 1 μs per channel. The fluorescence decay spectra were fitted into a multi-exponential function to obtain the lifetime of the excited state 5D0 of Eu(III).
EXAFS measurements
Eu(III) complexes with CB5 and CB7 have been studied with Eu L3 edge EXAFS to gain some insight into the structure of the complexes. The Eu(III) ion exists in a nine coordinated environment with a regular square antiprismatic geometry.30 EXAFS measurements have been done on three samples of the following Eu(III) ([Eu]) and CBn ([CBn]) concentrations: (i) [Eu] = 9.0 mM and [CB5] = 16.0 mM, L/M = 1.8, (ii) [Eu] = 9 mM and [CB7] = 34.2 mM, L/M = 3.8 and (iii) [Eu] = 49.4 mM and [CB7] = 18.8 mM, L/M = 0.38. The EXAFS measurements of these samples at the Eu L3 edge were carried out in the fluorescence mode at the Scanning EXAFS Beamline (BL-9) at the INDUS-2 Synchrotron Source (2.5 GeV, 100 mA) at the Raja Ramanna Centre for Advanced Technology (RRCAT), Indore, India.31 The beamline uses a double crystal monochromator (DCM) which works in the photon energy range of 4–25 keV with a resolution of (E/ΔE) × 104 at 10 keV. A 1.5 m horizontal pre-mirror with a meridonial cylindrical curvature is used prior to the DCM for the collimation of the beam and a higher harmonic rejection. The second crystal of the DCM is a sagittal cylinder with a radius of curvature in the range 1.28–12.91 meters which provides a horizontal focusing to the beam. For measurements in the fluorescence mode, the sample is placed at 45° to the incident X-ray beam and the fluorescence signal (If) is detected using a Si drift detector placed at 90° to the incident X-ray beam. An ionization chamber detector is used prior to the sample to measure the incident X ray flux (I0) and a normalized fluorescence of the sample (μ = If/I0) is obtained as a function of energy by scanning the monochromator over the specified energy range. The EXAFS spectra of the samples at the Eu L3 edge were recorded in the energy range 6930–7560 eV.
Computational study
Gas phase geometries of CB5, CB7 and their Eu(III) complexes with different coordination geometries are optimized at the GGA level of density functional theory (DFT) by using Becke's exchange functional32 in conjunction with Perdew's correlation functional33 (BP86) with generalized gradient approximation (GGA) where 28 electron core pseudopotentials (ECPs) along with the corresponding def-SV(P) basis sets were selected for the Eu(III) ion and all other lighter atoms were treated at the all electron (AE) level.
Results and discussion
UV-Vis spectroscopy
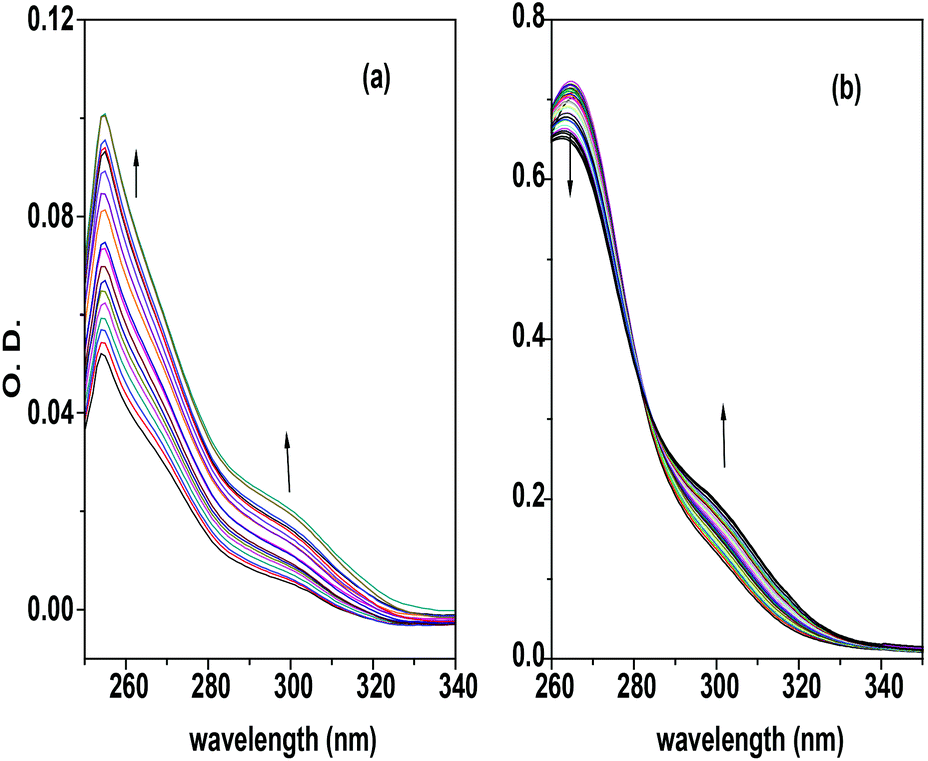
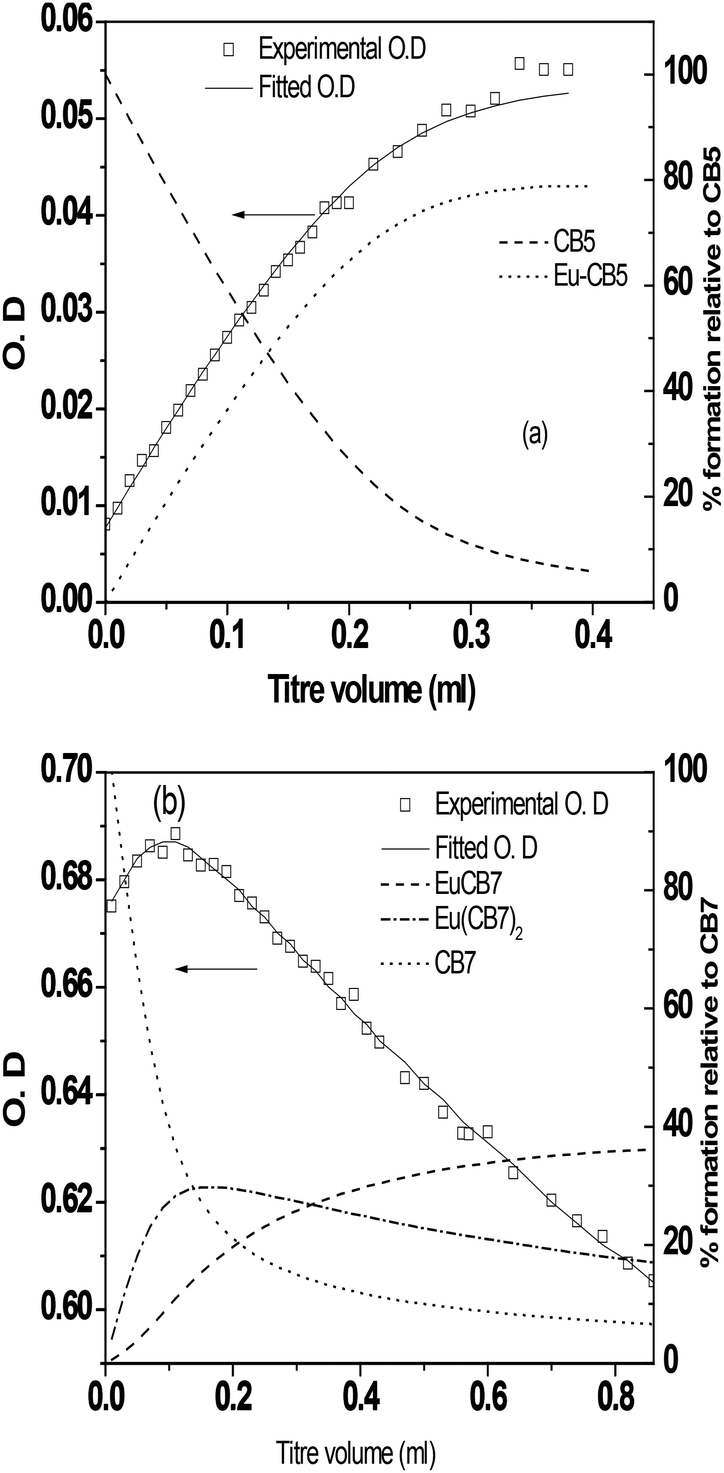
The stability constants (logβ) of Eu(III) with CBn were determined by UV-Vis absorption spectroscopy at 25 °C in FAH–water (50 wt%). Fig. 2 gives the spectrophotometric data for CB5 and CB7 titration with Eu(III) in the range λ = 260–340 nm. The experimental and fitted absorbance for CB5 and CB7 titration at λ = 271 and 269 nm, respectively, along with the speciation diagram are given in Fig. 3. The stability constants for Eu–CBn complexes obtained by analyzing spectrophotometric titration data by Hyperquad 2006 are given in Table 1. The UV-Vis spectrophotometric experiments revealed the formation of a 1:1 complex for Eu–CB5 whereas both 1:1 and 1:2 complexes were observed for the Eu–CB7 system.
 |
| | Fig. 2 Spectrophotometric titration of (a) CB5 (1.28 × 10⁻³ M) and (b) CB7 (9.69 × 10⁻⁴) with Eu(III) in an FA–water mixed solvent at 25 °C. | |
 |
| | Fig. 3 Plot of absorbance vs. titre volume for Eu(III) complexation with (a) CB5 (λ = 271 nm) and (b) CB7 (λ = 269 nm) along with their speciation diagrams. | |
Table 1 Stability constant for Eu(III) complexes with CB5 and CB7 in an FA–water mixture (50 wt%) at 25 °C
| Reaction |
Logβ |
ΔG |
ΔH |
TΔS |
| Eu3+ + CB5 = Eu(CB5)3+ |
5.08 ± 0.1 (Calorimetry) |
−28.99 |
12.1 ± 0.1 |
41.1 |
| 4.78 ± 0.03 (UV-vis) |
| Eu3+ + CB7 = Eu(CB7)3+ |
3.45 ± 0.05 (UV-vis) |
−19.68 |
−4.7 ± 0.6 |
15.0 |
| Eu3+ + 2CB7 = Eu(CB7)23+ |
7.0 ± 0.05 (UV-vis) |
−39.94 |
8.4 ± 0.4 |
48.3 |
|
aEu3+ + CB6 = Eu(CB6)3+ |
2.61 ± 0.04 (Calorimetry) |
−14.8 |
−1.7 ± 0.1 |
13.1 |
The studies reported on stability constants are carried out either by solubility measurements in an aqueous solution or by calorimetry in an FAH–water mixture.23,24,34–37 Zhang et al. have shown the formation of a 1:1 complex of alkali and alkaline earth metals with CBs viz. MeCB5 and CB6 in an FAH–water mixture.23 The calorimetric studies of CB6 complexation with all the lanthanide ions also reported the formation of a 1:1 complex.37 Despite the presence of two carbonyl portals in CBn, studies on the metal–CBn complexation in solution have shown the binding of a metal ion to only one portal of CBn, except for Pb2+ and Sr2+.
The basic nature of CB5 is evident from the pKa value of 9.5623 while CB6 is weakly acidic (pKa = 3.02)38 and in the presence of 50% FAH, the carbonyl portal of CBn is expected to be protonated. Zhang et al. attributed the competing protonation of CB6 and MeCB5 portals to the binding of the metal ion to only one portal. Only in the case of Pb2+, which has a strong affinity for MeCB5 (logK1 > 9), the metal ion could also replace a strongly bound proton thus forming a 2:1 complex even in an FAH–water mixture.23 This effect of protonation has also been observed in the Sr–MeCB5 complex (logK = 3.4). Sr–MeCB5 forms a 2:1 complex in water whereas a 1:1 complex is formed in an FAH–water mixture. Except for Sr2+, the studies on CBn complexation with alkali and alkaline earth metals in aqueous solution also reported the formation of only a 1:1 complex in the presence as well as the absence of an acid.34,36 The decrease in charge density in the second portal due to charge polarization, after the binding of Eu(III) in one portal could also be a possible reason for the binding of Eu(III) through only one portal. Contrary to the results in solution, lanthanide ions have been found to form crystalline coordinate polymers where Ln3+ binds through both the portals of a CB5 molecule.10–15,39,40
The stability constant of Eu(III) with CBn of different cavity sizes in solution follows the order CB5 > CB7 > CB6 (Table 1). The charge density on carbonyl oxygen atoms of different CBn was found to be nearly the same (described in computational studies). Therefore, the order of stability constant can be explained by the number of carbonyl oxygens interacting with Eu(III). In the case of CB5, the smaller size of the cavity enables Eu(III) to interact with more number of carbonyl oxygen atoms thereby maximizing its interaction with CB5. On the other hand, Eu(III) can bind with only a few of the carbonyl oxygens in the case of CB7 and CB6. The order of stability constant with the cavity sizes reported for MeCB5 and CB6 complexes of alkali and alkaline earth metal ions depends on the ionic size of the metal ion.36 The stability constant is higher for MeCB5 only in cases where the ionic radii of the metal ions are comparable to the cavity size (K+ and Sr2+). For cations smaller or bigger than the cavity size (Li+, Na+, Rb+ and Ca2+), CB6 with a larger number of carbonyl oxygen atoms has a higher stability constant than MeCB5.36 The same trend was also observed in the present work where Eu3+ having a radius comparable to the cavity radii of MeCB5 has the highest stability constant. In the absence of a size match between Eu3+ and CBn (CB6 or CB7), CB7 with a larger cavity size has a higher stability constant than CB6.
The molar absorbance data obtained from Hyperquad 2006, for all the species involved in the titration of CB5 and CB7 with Eu(III) are plotted in Fig. 4. The higher molar absorbance of CB7 compared to CB5 could be the consequence of the presence of more glycoluril groups in CB7. However, the change in the molar absorbance of CB7 on forming a 1:1 complex was much less than that for Eu–CB5 (Fig. 4). This larger change in the molar absorbance of the 1:1 Eu–CB5 complex compared to the 1:1 complex of Eu–CB7 suggests a stronger interaction between Eu(III) and CB5 than with CB7, which is also reflected in the higher stability constant of Eu–CB5.
 |
| | Fig. 4 Molar absorbance spectra of the (a) Eu–CB5 and (b) Eu–CB7 system. | |
Calorimetric studies
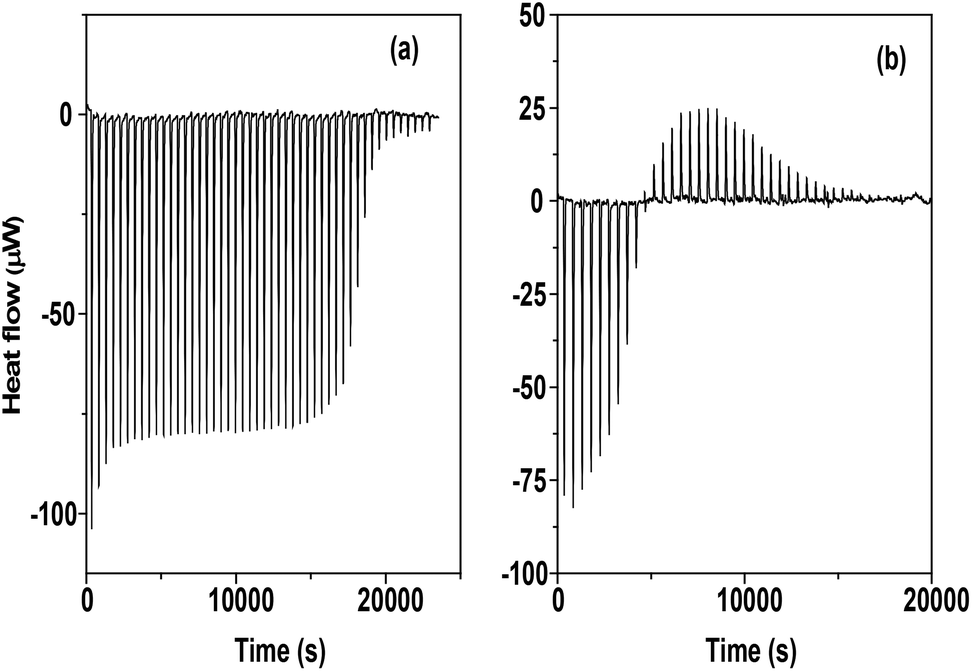
Fig. 5a and b give the raw calorimetric data (heat flow vs. time) for the titration of CB5 and CB7 respectively with Eu(III) in a FAH–water mixture.
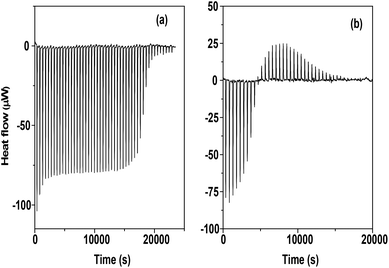 |
| | Fig. 5 a and b. Raw calorimetric data (heat flow vs. time) for CB5 and CB7 complexation with Eu(III) in an FAH–water mixture at 25 °C. | |
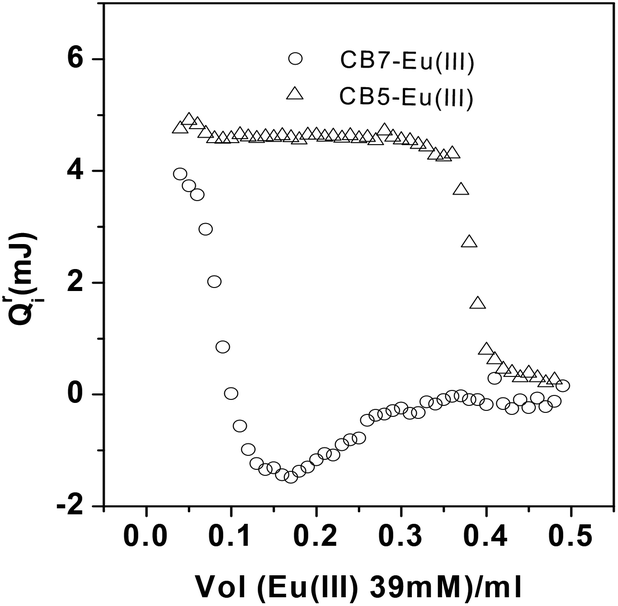
The endothermic peaks of complexation and the sharp inflection point at L/M = 1 for Eu–CB5 indicate the formation of a 1:1 complex. However, in the case of Eu–CB7, the heat values were endothermic at a low metal concentration (high L/M) and become exothermic at a higher metal concentration (low L/M) which points towards the formation of different species at different L/M ratios (Fig. 6).
 |
| | Fig. 6 Plot of heat values at each injection (Qri) on the addition of 10 μl of Eu(III) solution (39 mM). | |
In the case of a 1:1 complex, the stability constant and ΔH can be calculated by fitting the calorimetric data into eqn (6). However, only calorimetric data cannot give precise ΔH and logβ values if more than one species are present. Both logβ and ΔH for Eu–CB5 were obtained from the calorimetric data while for Eu–CB7, the stability constant data obtained from spectrophotometric titrations were used to calculate ΔH1 and ΔH2 using eqn (6). The thermodynamic data for Eu(III) complexation with CB5 and CB7 are given in Table 1. The stability constant obtained for Eu–CB5 from calorimetry was in good agreement with that obtained from the UV-Vis spectroscopic data. The ΔH of complexation is a result of the enthalpy of bond formation between Eu(III) and carbonyl oxygen, the solvation of the Eu–CBn complex and the enthalpy of desolvation of the metal ion and the CBn molecule. The positive enthalpy of complexation in CB5 suggests that the energy required in desolvation is more than that required in bond formation. This is characteristic of the electrostatic interaction between a hard acid (Eu(III)) and a hard base (CBn) where the metal ion and ligand are strongly hydrated and a large amount of energy is required in desolvation. The entropy of complexation consists of contributions mainly from solvation entropy and conformational entropy. As CBn molecules are rigid and do not undergo significant conformational changes during complexation, ΔS is determined mainly by desolvation of the metal ion and the CBn molecule. Thus, positive ΔS of Eu(III) complexes with CB5 and CB7 indicates an inner sphere complexation wherein solvated water molecules oriented around the metal ion and ligand are released into the bulk solvent and increase the randomness of the system. In spite of more number of carbonyl groups in CB7 compared to CB5, the lower ΔH and ΔS of the 1:1 complexation with Eu(III) indicate the participation of a lesser number of carbonyl groups in the binding of CB7. The comparable value of ΔS for 1:1 Eu–CB5 and 1:2 Eu–CB7 suggests a similar dehydration of Eu(III) in both the cases.
The enthalpy and entropy compensation effect holds for the complexation of cations with a large number of macrocyclic ligands viz., glymes, podands, crown ether, cryptands and macrocyclic antibiotics in various media.41 However, no such relationship has been reported in the literature for CBn which also belongs to a class of macrocyclic ligands with a unique structure. Thus, it is interesting to find such a correlation for metal CBn complexes. The plot of TΔS vs. ΔH for CBn (including present data) is given in Fig. 7.
 |
| | Fig. 7 Enthalpy and entropy compensation plot for cucurbiturils. | |
The data used in the plot are taken from ref. 36. The linear relationship between ΔH and TΔS suggests that the change in TΔS is compensated by a proportional increase in ΔH and vice versa.
where
α, the slope of
TΔ
S vs. Δ
H, is the measure of the cancellation effect and only a (1 −
α) fraction of change in Δ
H contributes to a change in Δ
G.
TΔ
S0 is the entropy gain even when Δ
H is zero. Though a linear relationship was observed for all macrocyclic ligands,
α and
TΔ
S0 are reported to be dependent on the type of macrocyclic ligands. The
α and
TΔ
So for different macrocyclic ligands are given in
Table 2.
Table 2 Enthalpy–entropy compensation for macrocyclic ligands
| Ligand |
α
|
TΔS0 |
Ref. |
| Glyme |
0.86 |
9.6 |
41
|
| Crown ether |
0.76 |
10.032 |
41
|
| Cryptand |
0.51 |
16.72 |
41
|
| Antibiotic |
0.95 |
23.408 |
41
|
| CBn |
1.1 ± 0.06 |
17.3 ± 0.7 |
Present work |
The authors have explained enthalpy and entropy compensation by relating the decrease in ΔH to an increased metal ligand interaction, which is compensated by a decrease in ΔS owing to a simultaneous increase in the rigidity of the ligand structure on complexation.41
The α value decreases with an increase in ligand rigidity, that is, glyme/podant > crown ether > cryptand. An increase in the rigidity of the ligand restricts the TΔS compensation with ΔH on complexation, thereby decreasing the α value. The same explanation cannot be extended to the rigid macromolecules like antibiotics and CBn which, in spite of their rigid structure have a high α value. In such cases, the enthalpy and entropy compensation can be explained by relating the change in ΔH and ΔS to the dehydration of the metal ion and ligand. Thus, an increase in ΔH due to higher dehydration is compensated by a proportional increase in ΔS due to dehydration entropy. This further supports our assumption of relating ΔS mainly to dehydration entropy. In the case of CBn, the α value and TΔS0 were also found to be independent of the cavity size of CBn as can be seen from Fig. 7 which includes data of CB5, CB6 and CB7.
Time resolved fluorescence spectroscopy
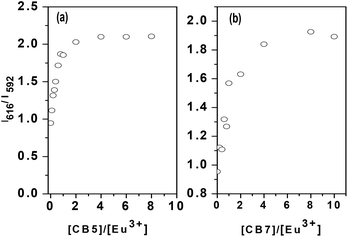
The complexation of Eu(III) by CB5 and CB7 was studied by TRFS. The fluorescence spectra and lifetimes were measured as a function of the L/M ratio. Fig. 8 shows the fluorescence spectra normalized with respect to the 592 nm peak at a different L/M ratio. The two prominent fluorescence emission peaks of the Eu(III) ion at 592 nm and 616 nm correspond to transitions 5D0–7F1 and 5D0–7F2 respectively. 5D0–7F2 is a hypersensitive transition due to its electric dipole nature and the intensity ratio of 616 nm and 592 nm (IR) is a measure of the asymmetry of the molecule.42 The IR was found to increase with L/M due to an increase in the concentration of complexed Eu(III) which is more asymmetric than Eu(H2O)9 (Fig. 9a and b). The sharp increase in IR in the case of CB5 compared to CB7 reflects the stronger binding in the case of CB5–Eu than Eu–CB7. Fig. 10 shows the fluorescence decay profile for Eu–CB5 at L/M = 0 and 8. At all L/M ratio values, the fluorescence was found to follow a monoexponential decay.
 |
| | Fig. 8 Fluorescence spectra (normalized with respect to 592 nm) of Eu–CB5 and Eu–CB7 at varying ligand to metal ratios. | |
 |
| | Fig. 9 Plot of intensity ratio vs. ligand to metal ratio of CB7 and CB5. | |
 |
| | Fig. 10 Fluorescence decay profile of Eu(III) in the presence of CB5 at a ligand to metal (L/M) ratio 0 and 8.0. | |
A single lifetime can be explained in terms of the fast exchange of metal ions between the free and complexed form which is characteristic of the electrostatic binding and is also observed in Eu(III) complexes with hard donor atoms like in Eu(III) carboxylates.43 The fluorescence decay lifetime of the excited 5D0 state to the 7Fi states is quenched by the O–H phonons of water molecules in a non-radiative deexcitation mode. The number of water molecules coordinated to Eu(III) is related to the fluorescence lifetime by the following empirical relationship given by Kimura and Choppin.44
| | | nH2O = (1.07/τ) − 0.62 | (9) |
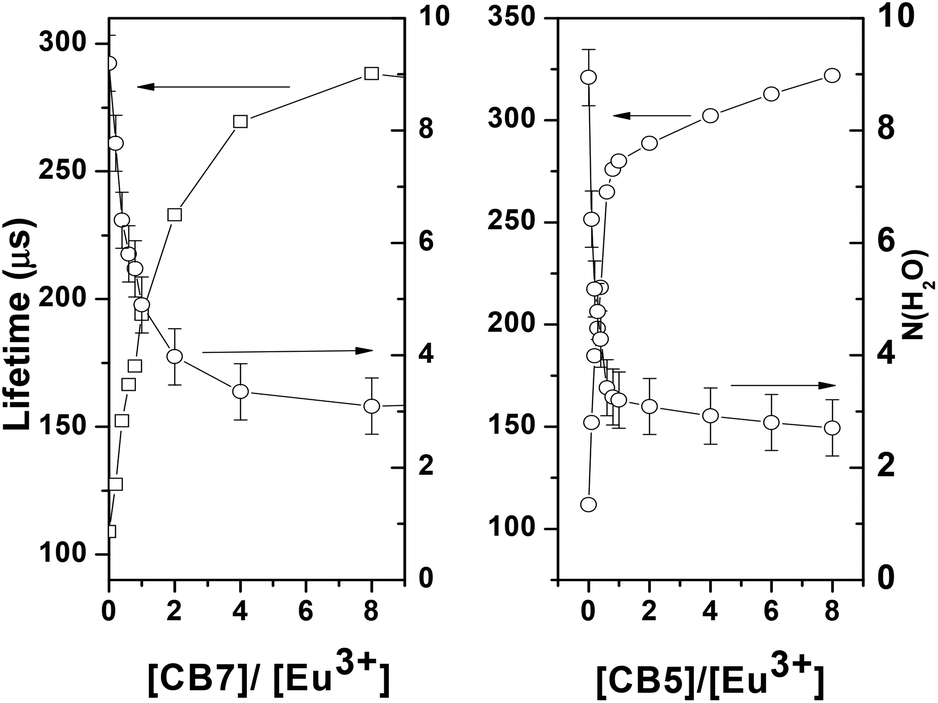
In a FAH–water mixture (50 wt%) the Eu(III) lifetime (109 ± 0.5 μs) was found to be the same as that in an aqueous solution (110 μs) which indicates that even in the presence of 50% FAH, FAH molecules are not present in the inner coordination sphere of Eu(III). Fig. 11 gives the τ values with varying L/M ratios for Eu–CB5 and Eu–CB7 and the number of water molecules are calculated using eqn (9) for the corresponding τ values. τ was found to increase with the L/M ratio and saturated at a higher L/M. The increase in τ is due to the removal of water molecules from the inner coordination sphere of Eu(III) during complexation with CBn molecules. The decrease in the number of water molecules further confirms the formation of inner sphere complexes.
 |
| | Fig. 11 Plot of fluorescence decay lifetime (τ) and the number of water molecules in the inner coordination sphere of Eu(III). | |
According to stability constants, the species present at L/M > 3 (where τ gets saturated) for Eu–CB5 and Eu–CB7 systems are the 1:1 and 1:2 complexes respectively. The lifetime data suggest the presence of three water molecules in the inner coordination sphere of the 1:1 Eu–CB5 complex and 1:2 Eu–CB7. The similar entropy values for the formation of 1:1 Eu–CB5 and 1:2 Eu–CB7 are in agreement with the removal of the same number of water molecules during complexation.
ESI–MS
The ESI-MS measurements were carried out for the Eu–CB5 and Eu–CB7 systems at different ligand to metal ratios. Table 3 gives the details of species identified in the ESI-MS measurements (ESI 1–3†). The most intense peaks in all the spectra correspond to different species of ligands. CB5 was associated with FAH and water molecules to give peaks like (CB5)(H)3(FAH)10(H2O)3+, (CB5)(H)3(FAH)6(H2O)113+, and CB5(FAH)9(H2O)3(H)33+. Only the 1:1 complex of Eu(III) with CB5 was observed as Eu(CB5)(FAH)10(H2O)113+ at m/z 546.8, while in the case of the Eu–CB7 spectra at L/M = 5, peaks corresponding to 1:1 at m/z 578.7 (Eu(CB7)(FAH)8(H2O)33+) and 561.3 (Eu(CB7)(FAH)83+) as well as 1:2 complexes at m/z 1526.9 (Eu(CB7)2(FA)(FAH)10(H2O)42+) were observed. In the ESI-MS spectra at L/M = 1, the peak corresponding to the 1:2 complex was absent whereas that due to the 1:1 complex at 578.8 (153Eu(CB7)(FAH)8(H2O)33+) was present. The observation in ESI-MS supports the speciation obtained from spectrophotometric as well as calorimetric data. All the species (complexed and uncomplexed) were found to be associated with many FAH and water molecules. Other than the coordinated water molecules of Eu(III), FAH and water molecules solvate the complexed and uncomplexed CBn molecules through hydrogen bonding. A similar solvation of the CB5 complex has been observed in the 2D network of the uranyl-CB5 complex where an environment of nitrate is formed by hydrogen bonding to the carbon bound hydrogen of each CB5 molecule.12
Table 3 Species identified from ESI-MS spectra of the Eu(III) complexes of CB5 and CB7 at different ligand to metal ratios
| Eu–CB5 (L/M = 5) |
Eu–CB7 (L/M = 5) |
Eu–CB7 (L/M = 1) |
|
m/z |
Species |
m/z |
Species |
m/z |
Species |
| Free ligands |
Free ligands |
Free ligands |
| 433.0 |
CB5(FAH)9(H2O)3(H+)33+ |
560.4 |
CB7(FAH)10(H2O)3(H)33+ |
301.0 |
CB7(H)4(H2O)24+ |
| 435.5 |
(CB5)(H)3(FAH)6(H2O)113+ |
571.4 |
CB7(FAH)10(H2O)5(H)33+ |
Complex peak |
| 437.9 |
(CB5)(H)3(FAH)10(H2O)3+ |
Complex peak |
578.8 |
153Eu(CB7)(FAH)8(H2O)3+ |
| Complex peaks |
578.7 |
Eu(CB7)(FAH)8(H2O)33+ |
| 546.8 |
Eu(CB5)(FAH)10(H2O)113+ |
561.3 |
Eu(CB7)(FAH)83+ |
| 1526.9 |
Eu(CB7)2(FA)(FAH)10(H2O)42+ |
EXAFS
Fig. 12 shows the experimental EXAFS (μ(E) versus E) spectra of the Eu complexes with CBn. In order to take care of the oscillations in the absorption spectra, the energy dependent absorption coefficient μ(E) has been converted into the absorption function χ(E) defined as follows:45| |  | (10) |
where E0 is the absorption edge energy, μ0(E) is the bare atom background and Δμ0(E0) is the step in the μ(E) value at the absorption edge. After converting the energy scale to the photoelectron wave number scale (k) as defined by,| |  | (11) |
the energy dependent absorption coefficient χ(E) has been converted to the wave number dependent absorption coefficient χ(k), where m is the electron mass. Finally, χ(k) is weighted by k2 to amplify the oscillation at a high k and the functions χ(k)·k2 are Fourier transformed in the r space to generate the χ(r) versus r (or FT-EXAFS) spectra in terms of the real distances from the center of the absorbing atom. The Fourier transformed range in the k space is 2–8 Å−1. It should be mentioned here that a set of EXAFS data analysis programs available within the IFEFFIT software package46 have been used for the reduction and fitting of the experimental EXAFS data. This includes data reduction and Fourier transformation to derive the χ(r) versus r spectra from the absorption spectra, the generation of the theoretical EXAFS spectra starting from an assumed crystallographic structure and finally fitting of the experimental data with the theoretical spectra using the FEFF 6.0 code. The bond distances, co-ordination numbers (including scattering amplitudes) and disorder (Debye–Waller) factors (σ2), which give the mean-square fluctuations in the distances, have been used as fitting parameters. The EXAFS measurements for Eu–CB5 were carried out at L/M = 1.8 (labeled as CB5 Eu1.8) where 100% Eu(III) is present as a 1:1 complex. In order to deduce the structures of both 1:1 and 1:2 complexes of Eu–CB7, the EXAFS measurement for CB7 was carried out at two L/M ratios viz. 3.8 and 0.38 labeled as CB7 Eu3.8 and CB7 Eu0.38 respectively. According to the speciation diagram obtained from the stability constant, only a 1:2 complex of Eu–CB7 is present at L/M = 3.8 and at L/M = 0.38, 35% of Eu is present as a 1:1 complex of Eu–CB7 and 65% as free Eu(III).
 |
| | Fig. 12 Plot of absorption coefficient μ(E) vs. energy. | |
Fig. 13 shows the experimental plots along with their best fit theoretical plots and the corresponding best fit results for all the samples have been summarized in Table 4. The experimental χ(r) versus r spectra of the CB5 Eu1.8 sample have been fitted from 1.4 to 3.5 Å with two Eu–O shells at 2.22 Å (n = 3.0) (Eu–O1) and 2.98 Å (n = 6.5) (Eu–O2) and an Eu–C shell at 3.56 Å (n = 6.6). The presence of an Eu–C shell is an indicator of the binding of Eu(III) through the carbonyl oxygen of CB5 or formate and the same number of oxygen should correspond to carbonyl oxygen or formate oxygen (Eu–O2). The Eu–O1 shell therefore can be assigned to the oxygen atoms of the coordinated water molecule. The higher N (6.5 ± 0.7) of Eu–O2 shell cannot be explained by binding through CB5 as it can donate a maximum of five oxygen atoms. The binding of formate encapsulated inside the cavity to Eu(III) could possibly be the reason for a higher number of Eu–O2 and Eu–C bonds. Though no evidence for anion encapsulation has been furnished in the present work, the encapsulation of anions viz., nitrate and chloride, in a CB5 solution has been shown by fluorescence studies.39 The higher affinity of the nitrate ion for CB5 compared to the chloride ion has been attributed to its more diffused negative charge. Thus, a diffused negative charge on formate and a high concentration of formic acid (11.11 m) in the medium collectively support the possibility of formate encapsulation. The encapsulation of chloride and nitrate has also been observed in crystal studies.39,40 In a 1:1 Eu–CB5 complex, Eu(III) is symmetrically bound to CB5, covering one of the two portals. A number of literature reports on the crystal structure of lanthanide–CB5 have shown the binding of lanthanide ions in different coordination modes depending on the crystallization conditions or cation size. Studies by K. Chen on crystalline Eu–CB5 have shown the binding of Eu(III) to one CB5 molecule in two different modes.47 One Eu(III) fully capped the portal by binding symmetrically to all the carbonyl oxygen while the second Eu(III) bound partially to another portal of the same CBn molecule. The Eu–O distance reported for the fully capped portal is in the range 2.806–2.959 Å and for the partially capped is 2.900–3.290 Å which is close to that obtained in the present work for 1:1 Eu–CB5. The CB7 Eu0.38 spectrum for the 1:1 Eu–CB7 species has been fitted with two Eu–O shells at 2.35 Å (n = 6.0) and 3.03 Å (n = 2.9). The EXAFS results on CB7 Eu0.38 indicate the binding of Eu(III) to only three oxygen atoms from the carbonyl oxygen atoms of CB7 and formate oxygen and the remaining coordination is satisfied by six water molecules. This asymmetric binding of CB7 can be attributed to the small size of Eu(III).
 |
| | Fig. 13 Plot of χ(r) vs. r. | |
Table 4 Fitting Results of Eu L3 edge EXAFS spectra Eu–CBn complexes
| |
CB5 Eu1.8 |
CB7 Eu3.8 |
CB7 Eu0.38 |
| |
r (Å) |
N
|
σ
2
|
r (Å) |
N
|
σ
2
|
r (Å) |
N
|
σ
2
|
| Eu–O1 |
2.22 ± 0.01 |
3.0 ± 0.4 |
0.0015 ± 0.002 |
2.51 ± 0.01 |
8.9 ± 1.1 |
0.017 ± 0.003 |
2.35 ± 0.04 |
6.0 ± 0.2 |
0.011 ± 0.001 |
| Eu–O2 |
2.98 ± 0.01 |
6.5 ± 0.7 |
0.001 ± 0.001 |
— |
— |
— |
3.03 ± 0.09 |
2.9 ± 0.6 |
0.011 ± 0.006 |
| Eu–C |
3.56 ± 0.02 |
6.6 ± 0.8 |
0.001 ± 0.004 |
3.44 ± 0.03 |
5.8 ± 2.1 |
0.001 ± 0.004 |
— |
— |
— |
The symmetric binding of Eu(III) by CB5 is also evident from a higher logβ of Eu–CB5 compared to Eu–CB7 which is mainly due to a higher ΔS in Eu–CB5. The higher ΔS of Eu–CB5 can be explained by the removal of six coordinated water molecules of Eu(III) compared to that in Eu–CB7 where only three water molecules are removed. The loss of more number of hydrated water molecules by Eu(III) upon complexation with CB5 is also reflected in its higher ΔH in contrast to exothermic ΔH for 1:1 Eu–CB7. The ΔH reported for CB6 (−1.7 ± 0.1 kJ mol−1)37 is also similar to that obtained for Eu–CB7 (−4.7 ± 0.6 kJ mol−1). The higher dehydration of Eu(III) therefore can be attributed to its interaction with more number of carbonyl oxygens.
Eu(III) in CB5 is encapsulated through one portal and has only three residual water molecules and their removal by one more CB5 molecule could be geometrically more unfavorable. Unlike in Eu–CB5, Eu(III) in the 1:1 Eu–CB7 complex has six water molecules, therefore, the three residual water molecules can be easily replaced by another CB7 molecule, thus forming a 1:2 complex. The EXAFS data of CB7 Eu3.8, where the presence of only 1:2 Eu–CB7 is expected, have been fitted with an Eu–O shell at 2.51 Å (n = 9.0) and an Eu–C shell at 3.44 Å (n = 5.8). The presence of nearly six carbon atoms at 3.44 Å suggests that nearly six oxygen atoms at a distance of 2.51 Å are from the carbonyl group of the two CB7 molecules and the rest three are from the coordinated water molecules. The binding of one metal ion to two CB7 molecules to give one dimensional polymer is very common in crystal studies.17 For a simple hard acid and hard base reaction, where electrostatic interactions play a dominant role, the affinity of the metal ion for successive ligands decreases due to the neutralization of the charge on the metal ion and the stability constant follows the order logK1 > logK2. But, in the case of Eu–CB7, logK2 (3.55 ± 0.05) was found to be nearly the same as logK1 (3.45 ± 0.05). The extra stability of the 1:2 Eu–CB7 complex can be attributed to the closer approach of Eu(III) to the two CB7 molecules which can be seen from the shorter Eu(III) and carbonyl oxygen distances in EXAFS results for CB7 Eu3.8 than those in 1:1 Eu–CB7 (Table 4). Kitano et al. have empirically related the ΔS of complexation to the number of released water molecules.48 A similar ΔS for 1:1 Eu–CB5 and 1:2 Eu–CB7 complexes indicates the removal of nearly the same number of water molecules from the inner coordination sphere of Eu(III). In both complexes, 1:1 Eu–CB5 and 1:2 Eu–CB7, the inner coordination sphere of Eu(III) is associated with three water molecules at a distance 2.98 ± 0.01 Å and 2.51 ± 0.01 Å respectively, which is in line with the fluorescence lifetime studies and similar ΔS values for the formation of Eu–CB5 and Eu(CB7)2. Eu(III) in all the three species 1:1 Eu–CB5, 1:1 Eu–CB7 and 1:2 Eu–CB7, is found to bind in different mode. The results of all the three EXAFS measurements have shown a shorter Eu–O (H2O) compared to Eu–O(>C![[double bond, length as m-dash]](https://www.rsc.org/images/entities/char_e001.gif) O) as also reported in some of the crystal studies.47 The rigid structure of CBn molecules restricts the oxygen atoms to come close to Eu(III) whereas water molecules can easily approach closer to Eu(III).
O) as also reported in some of the crystal studies.47 The rigid structure of CBn molecules restricts the oxygen atoms to come close to Eu(III) whereas water molecules can easily approach closer to Eu(III).
Computational studies
CB5 vs. CB7.
The optimized structure of CB5 and CB7 is given in Fig. 1. The radius of the incircle (Ri) of the pentagon formed by joining five portal oxygens of CB5, calculated from the average bond distance between carbonyl oxygens in optimized geometry, was found to be 2.31 Å (described in ESI 4†). Similarly, Ri calculated for CB7 was found to be 3.95 Å. The natural charges on carbonyl oxygens of CB5 (0.577e−) were found to be nearly the same as those on CB7 (0.585e−). Therefore, the stability of a complex should depend on the number of carbonyl oxygen atoms interacting with Eu(III) and their distance.
Eu–CB5.
DFT calculations of CB5 and its complexes with Eu(III) were carried out to determine their most stable geometries and the natural charges on binding atoms. The optimized structure of CB5 and Eu–CB5 along with the natural charge on oxygen and Eu are given in Fig. 14. Eu(III) was found to bind symmetrically with all the five carbonyl oxygen atoms at an average distance of 2.47 Å and the complexation of Eu(III) led to the constriction of the CB5 portal (bound to Eu(III)), that is, Ri of the portal decreased from 2.31 to 1.92 Å. Interestingly, the Ri of the nonbonding portal also decreased to 2.18 Å. The crystal structural studies on Eu(III) complexes with CB5 showed an enlargement of the other portal which leads to an asymmetric binding of the second Eu(III) to give one dimensional polymers. The symmetric binding of Eu(III) with all the carbonyl oxygens supports the Eu(III) coordination observed in the present work. The binding energy of Eu(III) with CB5 in the gas phase was found to be (ΔE = EEu−CB5 − ECB5 − EEu3+, Ex is energy of species ‘X’) − 26.04 eV. The natural charge on Eu(III) decreased from +3e− to +1.847e− and the charges on carbonyl oxygens bound to Eu(III) increased from −0.577e− (in free CB5) to −0.734e−. The increase in the charge on carbonyl oxygen atoms (bound to Eu(III)) on binding with Eu(III) is due to the charge polarization from the non bonding carbonyl oxygen atoms of another portal. Charge polarization can also be observed from a decrease in the natural charges on oxygen atoms of the non-bonding portal (Fig. 14). The reduction in Ri at the non-bonding portal is due to the reduced electrostatic repulsion on oxygen atoms. The charge polarization in CB5 on binding with Eu(III) reduces the affinity of the second portal for Eu(III), and could be one of the reasons that a 2:1 complex is not formed.
 |
| | Fig. 14 Optimized structure of CB5 and Eu–CB5 and natural charges on Eu(III) and carbonyl oxygen atoms, obtained from DFT calculations (europium atom (green), Oxygen atom (red), Hydrogen atom (blue), Nitrogen atom (purple) and Carbon atom (yellow)). | |
In order to understand the role of hydrated water molecules in complexes and their geometry, the structures of Eu–CB5 were also optimized with three water molecules coordinated to Eu(III) in two different geometries (i) one water molecule coordinated from inside the cavity and two water molecules from outside (Eu–CB5 A); (ii) all the three water molecules are coordinated from outside (Eu–CB5 B) (ESI 5†). Interestingly, in the Eu–CB5 B geometry, Eu(III) was found to bind only four oxygen atoms directly and the fifth oxygen was bound through coordinated water molecules. On the other hand, in the Eu–CB5 A geometry, all the carbonyl oxygens were bound directly to Eu(III). The interaction of Eu(III) with the five carbonyl oxygen atoms in Eu–CB5 A leads to a higher charge neutralization of Eu(III) (+3 to 1.612e−) compared to that in Eu–CB5 B (+3 to +1.655e−) (ESI 5†) whereas ΔE was found to be comparable for both the geometries.
The studies described in the above sections point towards the binding of Eu(III) with all the five carbonyl oxygen atoms of CB5, a formate and three water molecules. In order to find the possibility of the formation of the proposed species with formate encapsulation, Eu–CB5(H2O)3(FA), where FA is encapsulated inside the cavity, the geometry for the same was optimized to get a minimum energy structure (Fig. 15). The energy for the formation of Eu–CB5(H2O)3(FA) (ΔE = EEu–CB5(H2O)3(FA) − EEu3+ − ECB5 − EFA − EH2O) was found to be −40.294 eV. ΔE for the formation of Eu–CB5(H2O)3(FA) was most negative compared to all the possible species studied in the present work (Table 5). The high stabilization of the structure on the encapsulation of formate in the CB5 cavity suggests the important role of anion encapsulation in determining the stability of the complex. Eu(III) in the optimized geometry was found to interact directly with all the carbonyl oxygens but a small asymmetry was introduced by the presence of formate in the cavity. The Eu–O (>CO) bond distance of the bound portal varied in the range 2.49 to 2.64 Å and the charges on the oxygen atoms also varied in the range −0.672 to −0.701e−. The average Eu–O bond distance in the presence of an encapsulated formate increased from 2.51 (in Eu–CB5 A) to 2.58 Å which can be attributed to the decrease in the charge density on the Eu atom and an increased coordination number. The reduction of the natural charge on Eu(III) from +3 to +1.497e− is expected to reduce its affinity for another CB5 molecule and thereby reduces the possibility of the formation of a 1:2 complex.
 |
| | Fig. 15 Optimised structure of Eu(CB5)(FA)(H2O)3 (europium atom (green), Oxygen atom (red), Hydrogen atom (blue), Nitrogen atom (purple) and Carbon atom (yellow)). | |
Table 5 Theoretically calculated binding energies of complexes
| Species |
ΔE (eV) |
Natural Charge on ‘Eu’ |
| Eu CB5 |
−26.041 |
+1.847 |
| Eu(CB5)(H2O)3, Eu–CB5 B Eu-CB5 B |
−29.974 |
+1.655 |
| Eu(CB5)(H2O)3, Eu–CB5 A Eu-CB5 A |
−29.828 |
+1.612 |
| Eu(CB5)(H2O)3(FA) |
−40.294 |
+1.497 |
| Eu CB7 |
−25.544 |
+1.791 |
Eu–CB7.
In the optimized structure of the Eu–CB7 complex (in the absence of water and formate), Eu(III) was found to interact with only three carbonyl oxygens with an interaction energy of −25.544 eV. Similar to Eu–CB5, a charge polarization was also observed in the Eu–CB7 complex. The charges on oxygen atoms of CB7 that are bound to Eu(III) increased from −0.585e− to nearly 0.8e− whereas the charges on non-bonding oxygen atoms on the same portal decreased slightly (from −0.585e− to nearly −0.533e−). The unsymmetrical binding of Eu(III) with three carbonyl oxygen atoms supports the thermodynamic and spectroscopic results. The smaller ΔE and lesser charge neutralization of Eu(III) on complexation with CB7 compared to CB5 (Table 5) is in line with the lower stability constant of Eu–CB7 (Table 1). The spectroscopic studies on the 1:1 Eu–CB7 complex point towards the presence of six Eu–O bonds from water molecules and three Eu–O bonds from the carbonyl oxygen of CB7 and formate. The geometry of the 1:1 Eu–CB7 complex was optimized with Eu(III) bound to six water molecules and one CB7 molecule (Eu(CB7)(H2O)6). However, the minimum energy geometry obtained for the species Eu(CB7)(H2O)6 showed the binding of Eu(III) to the portal of the CB7 molecule by hydrogen bonding through coordinated water molecules around Eu(III) (Fig. 16). Such outer sphere complexes have been reported in the literature for Yb(H2O)83+ and CB7.49 Though there are many reports on the presence of outer sphere complexes of metal ions with CBn,13,14 the optimized geometries obtained were in contrast to experimental observations where Eu(III) forms an inner sphere complex with CB7. The geometry for 1:1 Eu–CB7 with encapsulated formate and water molecules (Eu(FA)CB7(H2O)6) could not be converged in the same level of calculation.
 |
| | Fig. 16 Optimised structure of Eu(CB7)(H2O)6 (europium atom (green), Oxygen atom (red), Hydrogen atom (blue), Nitrogen atom (purple) and Carbon atom (yellow)). | |
Conclusions
The present study has shown the role of the cavity size of CBn on the stoichiometry, stability constant and structure of Eu(III) complexes with CB5 and CB7. Thermodynamic studies on Eu–CBn complexation revealed the formation of a 1:1 complex with CB5 while 1:1 and 1:2 complexes were observed with CB7 which has also been corroborated by ESI-MS studies. The complexation reactions have been found to be driven by entropy which is attributed to the dehydration of Eu(III) and CBn during complexation. Both EXAFS and TRFS have shown the presence of three water molecules in the inner coordination sphere of Eu(III) in the 1:1 Eu–CB5 and 1:2 Eu–CB7 complexes which are in line with their ΔS values. Thermodynamic, TRFS and EXAFS studies have shown the symmetric binding of Eu(III) with all the five carbonyl oxygens in the 1:1 Eu–CB5 complex whereas only a few of the CB7 carbonyl oxygens were present in the first coordination shell of Eu(III) in the 1:1 complex of Eu–CB7. In the case of 1:2 complex of Eu–CB7, six carbonyl oxygens are present which illustrates that Eu(III) is sandwiched between two CB7 molecules each coordinating through three carbonyl oxygens. These observations have also been supported by DFT calculations on Eu–CBn complexes.
Acknowledgements
The authors would like to thank Sophisticated Analytical Instrument Facility (SAIF), Indian Institute of Technology (IIT) – Bombay, Mumbai for ESI-MS measurements. The authors also thank Dr M. Mohapatra for help in fluorescence studies. Thanks are due to Dr Alok Ray (Laser and Plasma Technology Division, BARC) for his support in the synthesis of ligands.
Notes and references
- E. Masson, X. Ling, R. Joseph, L. Keyeremeh-Mensah and X. Lu, RSC Adv., 2012, 2, 1213 RSC.
- Y. Chen and Y. Liu, Chem. Soc. Rev., 2010, 39, 495 RSC; R. Ludwig and N. T. Kim Dzung, Sensors, 2002, 2, 397 CrossRef CAS PubMed.
- C. Márquez, R. R. Hudgins and M. N. Werner, J. Am. Chem. Soc., 2004, 126, 5806 CrossRef PubMed.
- M. R. Craig, M. G. Hutchings, T. D. W. Claridge and H. L. Anderson, Angew. Chem., Int. Ed., 2001, 40, 1071 CrossRef CAS.
-
J. W. Steed and J. L. Atwood, Supramolecular Chemistry, Wiley Publication, 2nd edn, 2009 Search PubMed.
- K. Moon and A. E. Kaifer, Org. Lett., 2004, 6, 185 CrossRef CAS PubMed.
- W. L. Mock and N. –Y. Shih, J. Org. Chem., 1986, 51, 4440 CrossRef CAS.
- H.–J. Buschmann, A. Wego, A. Zielesny and E. Schollmeyer, J. Inclusion Phenom. Macrocyclic Chem., 2006, 54, 241 CrossRef CAS PubMed.
- M. V. Rekharsky, T. Mori, C. Yang, Y. H. Ko, N. Selvapalam, H. Kim, D. Sobransingh, S. Kaifer Lui, L. Isaacs, W. Chen, S. Moghaddam, M. K. Gilson, K. Kim and Y. Inoue, Proc. Natl. Acad. Sci. U. S. A., 2007, 104, 20737 CrossRef CAS PubMed.
- S. Khushwaha, S. Rao, A. Padamraja and P. Sudhakar, Inorg. Chem., 2012, 51, 267 CrossRef PubMed.
- Y.-M. Jeon, J. Kim, D. Whang and K. Kim, J. Am. Chem. Soc., 1996, 118I, 9790 CrossRef.
- J. Heo, J. Kim, D. Whang and K. Kim, Inorg. Chim. Acta, 2000, 297, 307 CrossRef CAS.
- X. Feng, X.-J. Lu, S.-F. Xue, Y.-Q. Zhang, Z. Tao and Q.-J. Zhu, Inorg. Chem. Commun., 2009, 12, 849 CrossRef CAS PubMed.
- D. G. Samsonenko, M. N. Sokolov, A. V. Virovets, N. V. Pervukhina and V. P. Fedin, Eur. J. Inorg. Chem., 2001, 167 CrossRef CAS.
- E. A. Mainicheva, O. A. Gerasko, L. A. Sheludyakova, D. Yu. Naumov, M. I. Naumova and V. P. Fedin, Russ. Chem. Bull., 2006, 55, 267 CrossRef CAS PubMed.
- P. Thuèry, Inorg. Chem., 2010, 49, 9078 CrossRef PubMed.
- P. Thuèry and B. Masci, Cryst. Growth Des., 2010, 10, 716 Search PubMed.
- P. Thuèry, Cryst. Growth Des., 2011, 11, 2606 Search PubMed.
- P. Thuèry, Inorg. Chem., 2011, 50, 10558 CrossRef PubMed.
- W. A. Freeman, W. L. Mock and N. Y. Shih, J. Am. Chem. Soc., 1981, 103, 7367 CrossRef CAS.
- W. L. Mock and N. Y. Shih, J. Org. Chem., 1986, 51, 4440 CrossRef CAS.
- W. L. Mock and N. Y. Shih, J. Am. Chem. Soc., 1989, 111, 2697 CrossRef CAS.
- X. X. Zhang, K. E. Krakowiak, X. Xue Guoping, J. S. Bradshaw and R. M. Izatt, Ind. Eng. Chem. Res., 2000, 39, 3516 CrossRef CAS.
- H.-J. Buschmann, K. Jansen and E. Schollmeyer, Inorg. Chem. Commun., 2003, 6, 531 CrossRef CAS.
- R. Ruhela, B. S. Tomar, A. K. Singh, R. C. Hubli and A. K. Suri, Dalton Trans., 2013, 42, 7085 RSC.
- J. Kim, I.-S. Jung, S. –Y. Kim, E. Lee, J. -K. Kang, S. Sakamoto, Y. Kentaro and K. Kim, J. Am. Chem. Soc., 2000, 122, 540 CrossRef CAS.
- P. Gans, A. Sabatini and A. Vacca, Talanta, 1996, 43, 1739 CrossRef CAS.
- P. Johansson and I. Wadso, Thermochim. Acta, 1999, 342, 19 CrossRef CAS.
- N. Rawat, R. B. Gujar, M. S. Murali, B. S. Tomar and V. K. Manchanda, Thermochim. Acta, 2009, 488, 21 CrossRef CAS PubMed.
- L. Helm, F. Foglia, T. Kowall and A. E. Merbach, J. Phys.: Condens. Matter, 1994, 6 A, 137 CrossRef.
- S. Basu, C. Nayak, A. K. Yadav, A. Agrawal, A. K. Poswal, D. Bhattacharyya, S. N. Jha and N. K. Sahoo, J. Phys.: Conf. Ser., 2014, 493, 12032 CrossRef PubMed.
- A. D. Becke, Phys. Rev. A, 1988, 38, 3098 CrossRef CAS.
- J. P. Perdew, Phys. Rev. B: Condens. Matter, 1986, 33, 8822 CrossRef.
- H. J. Buschmann, E. Cleve, L. Mutihac and E. Schollmeyer, J. Inclusion Phenom. Macrocyclic Chem., 2009, 65, 293 CrossRef CAS.
- X. X. Zhang, K. E. Krakowiak, G. Xue, J. S. Bradshaw and R. M. Izatt, Ind. Eng. Chem. Res., 2000, 39, 3516 CrossRef CAS.
- H. J. Buschmann, K. Jansen, C. Meschke and E. Schollmeyer, J. Solution Chem., 1998, 27(2), 135 CrossRef CAS.
- H. –J. Buschmann, K. Jansen and E. Schollmeyer, Inorg. Chem. Commun., 2003, 6, 531 CrossRef CAS.
- H. –J. Buschmann, E. Cleve and E. Schollmeyer, Inorg. Chim. Acta, 1992, 93, 193 Search PubMed.
- J. –X. Liu, L.- S. Long, R. B. Huang and L. S. Zhen, Inorg. Chem., 2007, 46, 10168 CrossRef CAS PubMed.
- J. –X. Liu, L.- S. Long, R. B. Huang and L. S. Zhen, Cryst. Growth Des., 2006, 6, 2611 CAS.
- Y. Inoue and T. Hakushi, J. Chem. Soc., Perkin Trans. 2, 1985, 935 RSC.
-
G. Blasse and B. C. Grabmaier, Luminescent Material , Springer Verlag, 1994 Search PubMed.
- N. Rawat, A. Bhattacharyya, B. S. Tomar, T. K. Ghanty and V. K. Manchanda, Thermochim. Acta, 2011, 518, 111 CrossRef CAS PubMed.
- T. Kimura and G. R. Choppin, J. Alloys Compd., 1994, 231/214, 313 CrossRef.
-
D. C. Konigsberger and R. Prince, X-Ray Absorption: Principles, Applications, Techniques of EXAFS, SEXAFS and XANES, Wiley, New York, 1988 Search PubMed.
- M. Newville, B. Ravel, D. Haskel, J. J. Rehr, E. A. Stern and Y. Yacoby, Physica B, 1995, 208/209, 154 CrossRef.
- K. Chen, L. L. Liang, H. J. Liu, Y. Q. Zhang, S. F. Xue, Z. Tao, X. Xiao, Q. J. Zhu, L. F. Lindoy and G. Wei, CrystEng Comm, 2012, 14, 7994 RSC.
- H. Kitano, Y. Onishi, A. Kirishima, N. Sato and O. Tochiyama, Radiochim. Acta, 2006, 94, 541 CrossRef CAS PubMed.
- P. Thuèry, Inorg. Chem., 2009, 48, 4497 CrossRef PubMed.
Footnote |
| † Electronic supplementary information (ESI) available: ESI-MS spectra, optimised geometries free CB5, CB7 and their Eu(III) complexes. See DOI: 10.1039/c4dt03623a |
|
| This journal is © The Royal Society of Chemistry 2015 |
Click here to see how this site uses Cookies. View our privacy policy here. 
 Open Access Article
 This Open Access Article is licensed under a