
 Open Access Article
 This Open Access Article is licensed under a Creative Commons Attribution-Non Commercial 3.0 Unported Licence
A highly effective and stable CuZn0.3MgxAlOy catalyst for the manufacture of chiral L-phenylalaninol: the role of Mg and its hydrotalcite-like precursor†
Zhangping
Shi
a,
Shuangshuang
Zhang
a,
Xiuzhen
Xiao
a,
Dongsen
Mao
a and
Guanzhong
Lu
*ab
aResearch Institute of Applied Catalysis, School of Chemical and Environmental Engineering, Shanghai Institute of Technology, Shanghai 201418, China
bKey Laboratory for Advanced Materials and Research Institute of Industrial Catalysis, East China University of Science and Technology, Shanghai 200237, China. E-mail: gzhlu@ecust.edu.cn; Fax: +86 21 64252923
First published on 3rd December 2015
Abstract
Highly effective CuZn0.3MgxAlOy (x = 0–0.2) catalysts for the synthesis of chiral L-phenylalaninol derived from Cu-rich hydrotalcite-like precursors were prepared by a co-precipitation method with Na2CO3 as the precipitant, and their physicochemical and catalytic properties were characterized. The results show that the presence of Mg2+ ions can promote the formation of hydrotalcite-like (htl) precursors, and the Mg2+ content would affect the phase purity of the prepared htl precursors. The BET surface area, exposed copper surface area and amount of acid sites of the samples decreased with the increase in the molar ratio of Mg2+/Al3+. Also, the dense layered htl precursors are beneficial to the atomically uniform distribution of the corresponding metal oxides in the prepared catalysts, promoting the stronger interaction between Cu0 and Al2O3 after the catalysts were reduced (SMSI effect). The activity of the CuZn0.3MgxAlOy catalysts is greatly dependent on not only the metallic copper surface area, but also the SMSI effect and the acidity of the catalysts. When Mg2+/Al3+ = 0.1 (mol), a phase-pure htl precursor could be obtained, and after calcination, the prepared CZA-0.1 catalyst exhibited very excellent catalytic performance for the hydrogenation of L-phenylalanine methyl ester to chiral L-phenylalaninol. After 5 h of reaction at 110 °C and 4 MPa H2, 100% conversion of L-phenylalanine methyl ester and 91.1% yield of L-phenylalaninol with an ee value of ~100% were achieved. After recycling 13 times, the L-phenylalaninol selectivity of the CZA-0.1 catalyst only decreased by 7.2%.
1. Introduction
Chiral amino alcohols, especially L-phenylalaninol, are an important kind of small chiral molecules and are widely used in pharmaceutical and materials chemistry, resolution of racemic mixtures, asymmetric organic synthesis, etc.1–8 Hence, the manufacture of chiral amino alcohols is a subject of considerable interest. Like most chiral amino alcohols, L-phenylalaninol can be prepared by reducing the corresponding acids or esters with metal hydrides as the reducing agents, which are reactive at low temperature, thereby guaranteeing the integrity of the stereogenic center.9–12 However, most of these metal hydrides are only used in the laboratory to produce chiral amino alcohols on a 100–150 g scale, and the high cost and large amount of waste make this methodology less attractive for commercial applications. Undoubtedly, seeking a new synthetic route with the absence of these drawbacks seems increasingly attractive and imperative. Recently, we have developed a new and environmentally friendly approach to synthesize L-phenylalaninol by the catalytic hydrogenation of L-phenylalanine methyl ester over a Cu/ZnO/Al2O3 catalyst, and 83.1% yield of L-phenylalaninol without racemization was achieved under relatively mild reaction conditions,13,14 which has – to the best of our knowledge – never been reported. However, the L-phenylalaninol selectivity and stability can still be further improved for industrial application, and the structure–activity relationship of the catalyst for this title reaction is also ambiguous.Nowadays, Cu/ZnO/Al2O3 catalysts have been popularly studied and used in many hydrogenation reactions.15–17 Many reports are related to empirical optimizations for the catalyst preparation based on the given reaction, such as the aging time, preparation methods and parameters, calcination and reduction conditions, etc. However, general and comprehensive regulation has not been established for the preparation of Cu/ZnO/Al2O3 catalysts because various factors have a complex influence on the structural characteristics and physicochemical properties of the obtained catalysts, and finally affect their catalytic performance. Recently, investigations on the structure of precipitated intermediates, namely the precursors of composite metallic oxides, have revealed that some specific precursor phases play important roles in the catalytic performance of Cu-based catalysts. For the Cu/ZnO/Al2O3 catalysts, various individual precursor phases were reported, such as zincian malachite,18,19 aurichalcite,20 rosasite,21 hydrotalcite-like (htl),22–24etc. This contribution focused on the preparation of Cu/ZnO/Al2O3 by the help of the hydrotalcite-like precursor.
It is well known that the CuZnAl htl compound is a typical kind of layered double hydroxides (LDHs) with the general formula [M2+1−xM3+x (OH)2]x−(An−)x/n·mH2O, where M2+ and M3+ are the divalent and trivalent cations and An− represents the anion.24,25 In the layered structure, all the three metal species share octahedrally coordinated sites. After calcination, the formed homogeneous micro- and nano-structure crystallites can highly disperse in the composite oxide catalysts and promote the interaction between the corresponding metal oxides. Unfortunately, the CuM2+M3+ htl precursor materials can be only obtained when the ratio of Cu/M2+ is ≤1.26–28 This can be attributed to the higher Jahn–Teller distortions of MO6 octahedra in the htl crystal structure as the Zn2+ ions (d10, no Jahn–Teller distortion) are gradually substituted by Cu2+ ions (d9, Jahn–Teller distorted coordination), which can destabilize the htl structure. To the best of our knowledge, in the Cu/ZnO/Al2O3 catalyst prepared by a co-precipitation method with sodium carbonate as a precipitant, the optimal and typical ratio of Cu/Zn was 2–3 with 10–20% Al.19,29 Hence, the synthesis of phase-pure Cu-rich htl materials should be a difficult challenge.
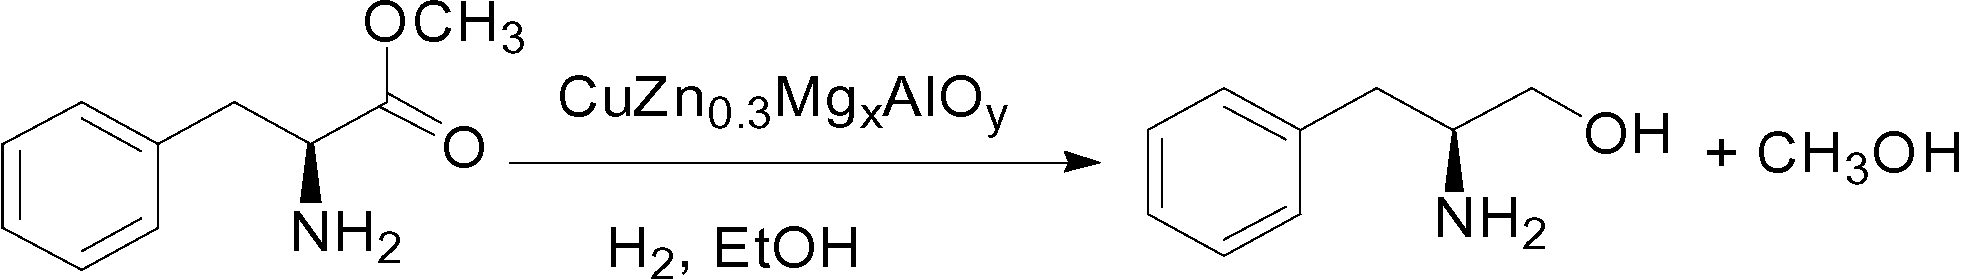
Mg/Al hydrotalcite is a typical LDH compound and can be synthesized easily in a wide range of compositions by the co-precipitation method with Na2CO3 as the precipitant.30 In addition, the Mg2+ ions can be substituted by Cu2+ and Zn2+ ions in the htl compounds because they have similar ionic radii. Herein, we tried to use the Mg2+ ions as “ion inducers” to introduce Cu2+ and Zn2+ into the layered structure and prepare phase-pure Cu-rich CuZn0.3MgxAl htl precursors, and after calcination, highly effective CuZn0.3MgxAlOy (x = 0–0.2) catalysts for the hydrogenation of L-phenylalanine methyl ester to L-phenylalaninol (eqn (1)) were prepared. The effect of the amount of added Mg on the structural characteristics and physicochemical properties of the CuZn0.3AlOy catalyst was studied, which showed that its catalytic performance and usage stability were affected. Based on these research results, the role of Mg and its hydrotalcite-like precursor in improving the catalytic performance was discussed in detail.
 | (1) |
2. Experimental section
2.1. Catalyst preparation
The CuZn0.3MgxAlOy (x = 0, 0.05, 0.1 and 0.2) catalysts were prepared by the co-precipitation method with Cu(NO3)2·3H2O, Zn(NO3)2·6H2O, Al(NO3)3·9H2O, Mg(NO3)2·6H2O and Na2CO3 (A.R., Sinopharm Chemical Reagent Co., Ltd.), and the preparation procedures are described as follows. 1.0 M Cu(NO3)2, 1.0 M Zn(NO3)2, 1.0 M Al(NO3)3, 1.0 M Mg(NO3)2 and 0.5 M Na2CO3 aqueous solutions were prepared, respectively. The mixed aqueous solution of Cu2+ and Zn2+ nitrates and 0.5 M Na2CO3 solution were co-precipitated at 70 °C under stirring. During the precipitation process, the flow rates of the two solutions were adjusted to keep a constant pH value of 7.5. Also, the mixed aqueous solution of Mg2+ and Al3+ nitrates and 0.5 M Na2CO3 solution were co-precipitated under the same conditions described above. Then, the two mixed solutions obtained above were mixed under the same conditions; this synthesis solution was aged under stirring for 2 h and cooled statically for 1 h. After filtration and washing with de-ionized water until the filtrate was neutral, the synthesized precursor material was dried at room temperature for 12 h, then dried at 120 °C for 24 h, and heated to 450 °C at 5 °C min−1 and calcined at 450 °C for 4 h. The calcined sample was pressed and crushed into small-sized particles of 0.45–0.85 mm (20–40 mesh). The catalyst was marked as CZA-Mgx (Mgx = 0, 0.05, 0.1 and 0.2), and the corresponding MgO content was 0, 2.1, 4.2 and 7.7 mol%.2.2. Catalyst characterization
The powder X-ray diffraction (XRD) patterns of the catalysts were recorded on a PANalytical X'Pert Pro MRD X-ray diffractometer (Netherlands) with CuKα radiation (λ = 0.154056 nm) operated at 40 kV and 40 mA. The surface areas (SBET) of the catalysts were measured by N2 adsorption at −196 °C on a Micromeritics ASAP 2020 apparatus and calculated by the Brunauer–Emmett–Teller (BET) method. Before testing, the samples were degassed at 200 °C for 10 h. The transmission electron microscopy (TEM) images of the samples were obtained on a JEOL 2100 microscope operated at 100 kV. The samples were suspended in ethanol and supported onto a holey carbon film on a Cu grid. The scanning electron microscopy (SEM) images of the samples were taken on a Nova NanoSEM 450 scanning electron microscope operated at 5 kV. Thermogravimetric/differential scanning calorimetry (TG/DSC) analyses of the samples were performed on a TGA Q5000 IR thermogravimetric analyzer at a heating rate of 10 °C min−1 from 30 to 800 °C in N2 or air flow (30 mL min−1).H2 temperature-programmed reduction (H2-TPR) was performed on a continuous-flow apparatus equipped with a thermal conductivity detector (TCD). 30 mg of the catalyst was used and pretreated at 350 °C for 1 h under a N2 flow of 30 mL min−1. After being cooled to 50 °C under N2, the catalyst was flushed with 10% H2/N2 at 30 mL min−1 instead of pure N2, and TPR of the sample was run from 50 to 550 °C at 5 °C min−1.
Temperature-programmed desorption of NH3 adsorbed on the catalyst (NH3-TPD) was carried out in a conventional flow system equipped with a thermal conductivity detector (TCD). 100 mg of the sample was used and pretreated in N2 at 450 °C for 1 h. After it was cooled to 100 °C under a N2 flow, the sample adsorbed NH3 at 100 °C for 1 h under 10% NH3/N2 (30 mL min−1), and N2 was purged into the sample for 2 h to remove physically adsorbed NH3. After that, NH3-TPD experiments were carried out at 100–800 °C in a flow of N2 (30 mL min−1). The rate of heating was 5 °C min−1.
The metallic copper surface area (SCu) of the catalysts was determined by using a nitrous oxide chemisorption method called the reactive frontal chromatography (RFC) technique.31 For example, 200 mg of the sample was reduced in 5% H2/He stream at a heating rate of 5 °C min−1 to 300 °C and maintained for 1 h. After that, the reactor was purged with pure He stream and cooled down to 60 °C, and then N2O titration was carried out. The surface copper atom density of 1.46 × 10¹⁹ copper atoms per m2 (Cu/N2O = 2/1) was used for the calculation of the copper surface area. Additionally, the dispersion of metallic copper (DCu) was defined as the amount of exposed copper in relation to the total amount of copper atoms in the catalyst.
2.3. Raw material preparation
The raw material, L-phenylalanine methyl ester, was obtained from L-phenylalaninate by the reaction shown in eqn (2). L-Phenylalaninate was dissolved in de-ionized water, and then the pH was adjusted to ~8 by adding sodium carbonate solution. After extraction with ethyl acetate, the extract was dried using anhydrous magnesium sulfate for 30 min. After filtration, L-phenylalanine methyl ester was obtained by rotary evaporation.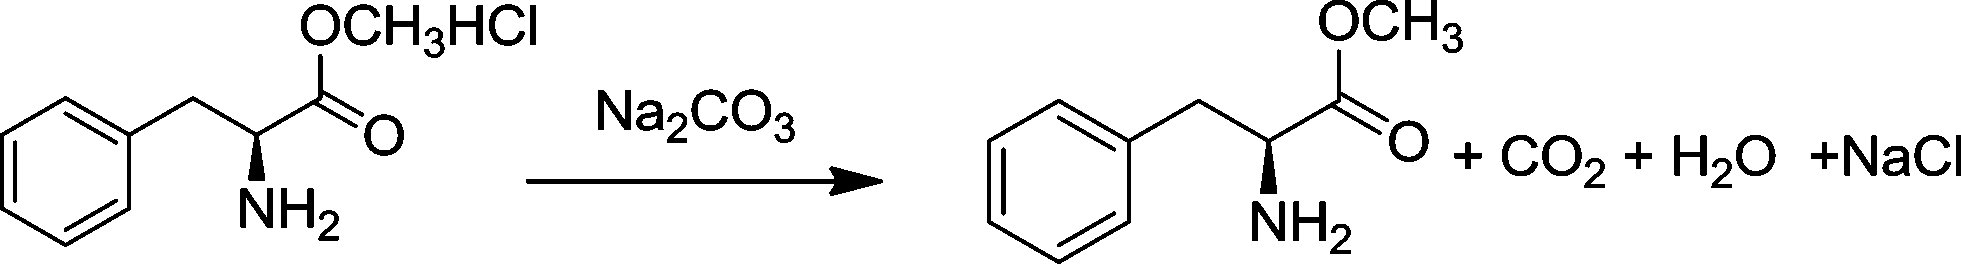 | (2) |
2.4. Catalytic activity testing
The catalytic activity of the catalyst for L-phenylalanine methyl ester (L-p) hydrogenation was tested in a 500 mL stainless steel autoclave under stirring at a speed of 500 rpm. After 1.0 g of the catalyst (20–40 mesh) was placed into the reactor, the reactor was flushed 4 times with 4 MPa H2 to expel air and the catalyst was reduced in 1 MPa H2 at 250 °C for 4 h, then the reactor was cooled to room temperature. 1.5 g of L-p diluted in 150 mL of ethanol was introduced, that is, L-p/Cat. = 1.5 (mass ratio). The typical reaction conditions were 4 MPa H2 and 110 °C. After the reaction was over, the reactor was cooled to room temperature, and then pressure was released. The catalyst was separated by centrifugation, and the products were analyzed by HPLC and 1H NMR (Bruker, AVANCE III 500 MHz).HPLC (High Performance Liquid Chromatography) analysis was carried out on an Agilent 1260 Infinity equipped with an ultraviolet detector and a column (Poroshell 120 EC-C18, 50 × 4.6 mm, 2.7 μm particle size). The operating conditions of HPLC were as follows: the mobile phase was 0.05 mol L−1 ammonium acetate aqueous solution (pH = 5.0) containing 5 vol% methanol, the flow rate was 0.6 mL min−1, the detection wavelength was 254 nm and the column temperature was 35 °C. Experimental errors for the conversion and selectivity were within ±2%. The conversion of L-phenylalanine methyl ester (X), yield (Y) and chemoselectivity (S) to L-phenylalaninol (L-p-ol) were calculated as follows:
| X(%) = (the mass of L-phenylalanine methyl ester converted/total mass of L-phenylalanine methyl ester in the feed) × 100% |
| Y(%) = (the mass of L-phenylalaninol formed actually/the mass of L-phenylalaninol formed theoretically) × 100% |
| S(%) = (Y/X) × 100% |
The ee value of the product was determined by HPLC with a chiral column (CHIRALPAK ID-3, 150 × 4.6 mm, 5 μm particle size) under the following operation conditions: the mobile phase was a mixture solution (water/methanol = 70![[thin space (1/6-em)]](https://www.rsc.org/images/entities/char_2009.gif) :30 (v/v), 0.6 mL min−1) containing 3% triethylamine, the detection wavelength was 258 nm and the column temperature was 40 °C.
:30 (v/v), 0.6 mL min−1) containing 3% triethylamine, the detection wavelength was 258 nm and the column temperature was 40 °C.
2.5. The structure and ee value of the product
The 1H NMR spectrum of the product L-phenylalaninol was obtained on a Bruker AVANCE III 500. 1H NMR (CDCl3): 7.21–7.35 (5H, m, Ph-H), 3.42–3.68 (2H, m, –CH2–O–), 3.15 (1H, s, –CH–N–), 2.53–2.84 (2H, m, CH2–Ph), 1.83 (2H, b, –NH2). In the product solution, only L-phenylalaninol could be detected by the HPLC with a chiral column, which indicates that the ee value is ~100% and the chirality of the reactant can be well maintained after the reaction.3. Results and discussion
3.1. Textural and structural properties of catalysts
The XRD patterns of the as-synthesized catalysts are shown in Fig. 1. When the Mg2+/Al3+ molar ratio was 0.1, a pure-phase hydrotalcite-like (htl) was successfully synthesized, which corresponds to the typical XRD pattern of the hydrotalcite-like structure. The samples with Mg2+/Al3+ ratios of 0.05 and 0.2 exhibited the htl structure along with another phase showing four diffraction peaks at 2θ = 14.5, 17.5, 31.8 and 32.7°, which are ascribed to zincian malachite.26,32 For the CZA-0 sample without Mg2+ ions, the malachite phase with low crystallinity could be observed. Additionally, it can be seen that the diffraction peaks of the htl phase became stronger and sharper with increasing Mg2+ amount, indicating an increase in the crystallinity of the htl phase.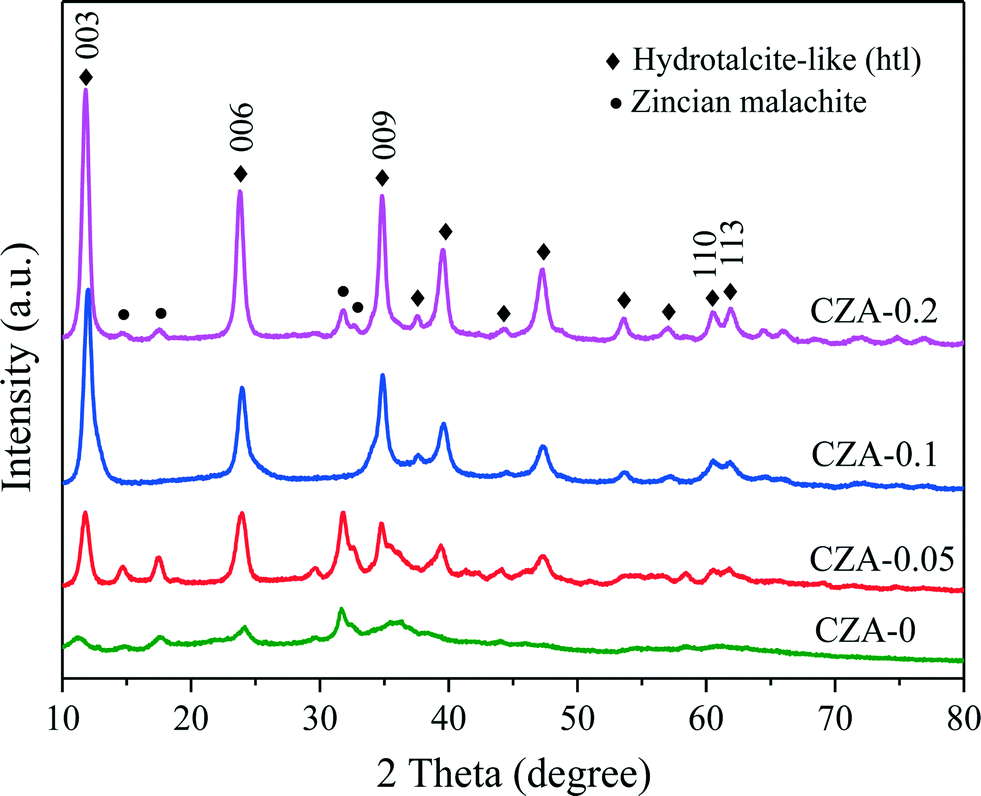 | ||
| Fig. 1 XRD patterns of as-synthesized CZA-Mgx catalysts with different Mg2+ contents. | ||
To investigate the decomposition of the precursor materials during calcination, TG and DSC techniques were used, and the results are shown in Fig. 2. In the TG curve of the CZA-0.1 sample with hydrotalcite-like phases, there are three major weight losses: the first weight loss at 100–200 °C can be attributed to the elimination of physically adsorbed and interlayer water, the second weight loss at 200–350 °C is smaller and can be ascribed to dehydroxylation in the hydrotalcite-like layers as well as the removal of CO2 from the interlayer carbonate via decomposition,25,33 resulting in the collapse of the htl crystal structure, and the third weight loss at 600–700 °C can be assigned to decomposition of Cu oxocarbonates formed.25,34 In the DSC curve of the CZA-0.1 sample, there is a sharp endothermic peak at ~150 °C, which involved the elimination of interlayer crystal water.35,36 The curves of the CZA-0 sample, which is presented as the malachite phase with low crystallinity, are different from those of the other three samples. In its TG curve, the first weight loss at 100–400 °C should be attributed to the loss of physically adsorbed water and the decomposition of amorphous Cu-containing hydroxyl carbonates. In addition, the second weight loss at 450–550 °C should be ascribed to the decomposition of Cu/Zn hydroxocarbonates, which is similar to the third weight loss of CZA-0.1. For the CZA-0.05 sample, it contained the mixed phases of hydrotalcite-like (htl) and zincian malachite, and its DTG and DSC curves were composed of the curves of CZA-0 and CZA-0.1, but its top-temperatures have been changed. For the CZA-0.2 sample, its dominant phase is the CZA phase with minor zincian malachite crystallites, hence its TG, DSC and DTG curves are similar to those of the CZA-0.1 sample, which are ascribed to the decomposition of Cu/Zn hydroxocarbonates.
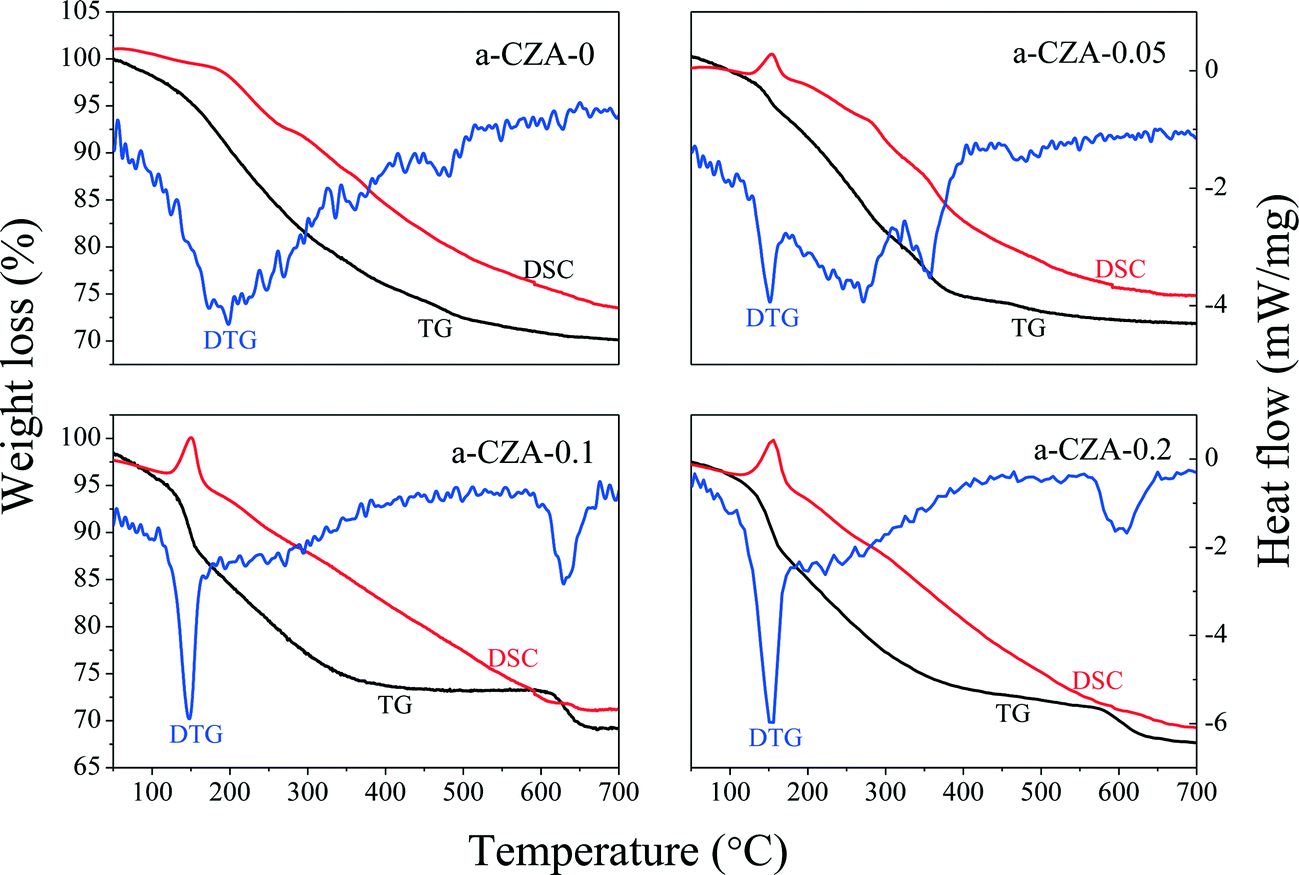 | ||
| Fig. 2 TG-DTG-DSC curves of as-synthesized CZA-Mgx samples with different Mg2+ contents. | ||
As shown in the XRD patterns in Fig. 3A, after the as-prepared samples were calcined at 450 °C, similar crystal structures were obtained for all the samples, in which CuO was the dominant phase and no diffraction peaks of ZnO, MgO and Al2O3 could be detected, that is to say, these oxides in the calcined catalysts are highly dispersed. Evidently, the diffraction peaks of hydrotalcite-like (htl) phases have disappeared in the calcined catalysts, which means that heat treatment would destroy the htl structure. Also, with the increase in the Mg2+/Al3+ molar ratio, the CuO reflection peaks of all the samples became weaker and broader, which indicates a decrease in CuO crystal size and degree of crystallinity. Correlating the intensities of the CuO diffraction peaks with the thickness of the layered htl platelets obtained through the SEM images (Fig. 4), it can be found that the larger the thickness of the htl layered precursor materials, the lower the degree of crystallinity of the copper oxide produced. After these four catalysts were in situ reduced at 1 MPa H2 and 250 °C for 4 h, the characteristic diffraction peaks of spinel structure ZnAl2O4 (ICDD 5-669) and Cu0 phases could be observed in their XRD patterns (Fig. 3B), while the CuO reflection peaks disappeared, which shows that CuO is completely reduced to metallic copper and a ZnAl2O4 phase can be formed after reduction. Obviously, the Cu0 reflection peaks become weaker and broader with the increase in the Mg2+/Al3+ molar ratio, that is, a decrease in Cu0 crystal size and degree of crystallinity. These results suggest that doping of Mg2+ can decrease the crystal size and increase the dispersion of the Cu0 species with the aid of the formation of the hydrotalcite-like (htl) precursor.
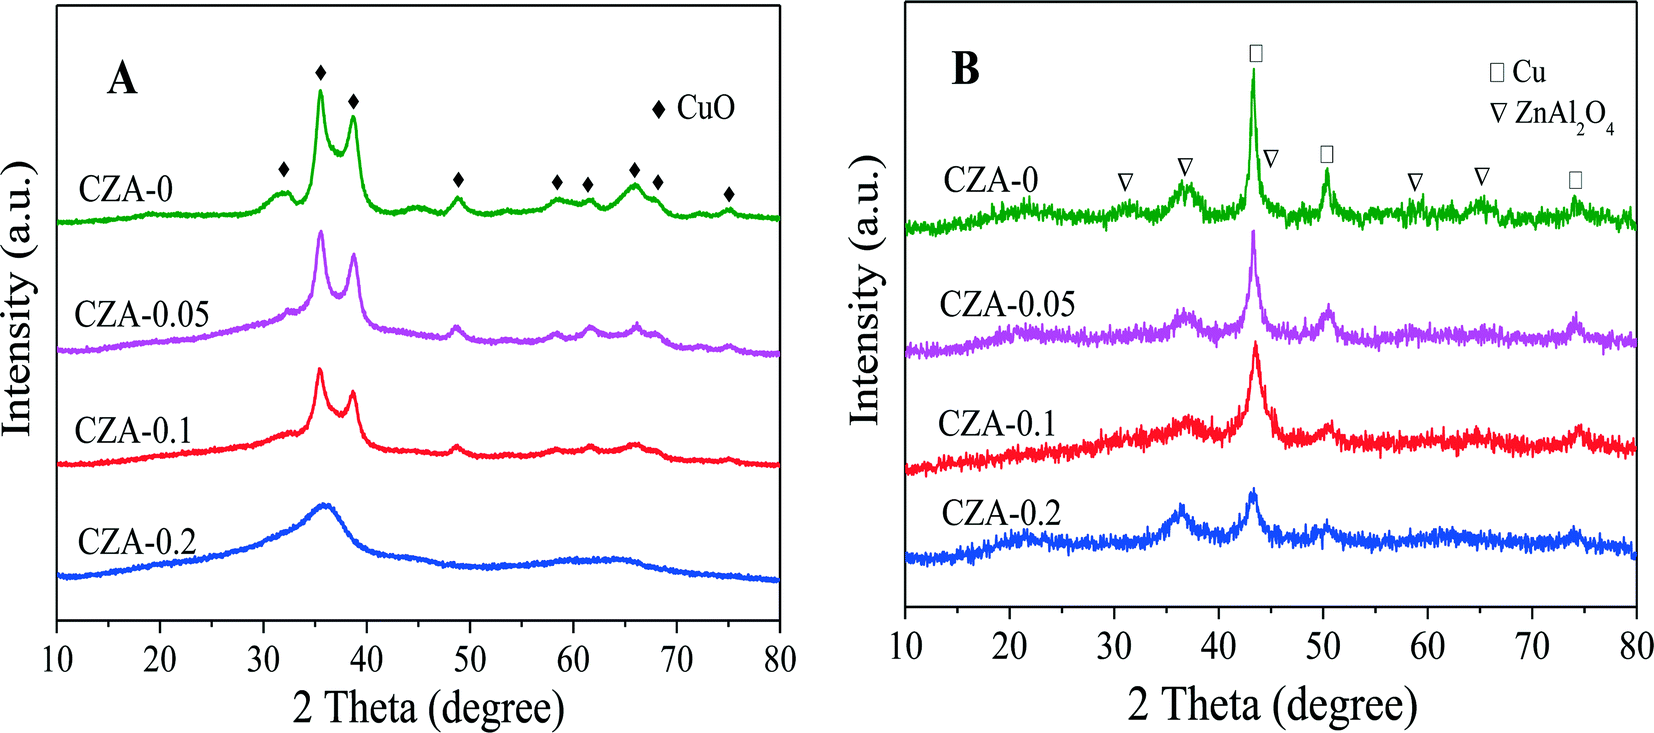 | ||
| Fig. 3 XRD patterns of the CZA-Mgx catalysts (A) calcined at 450 °C and (B) after in situ reduction. | ||
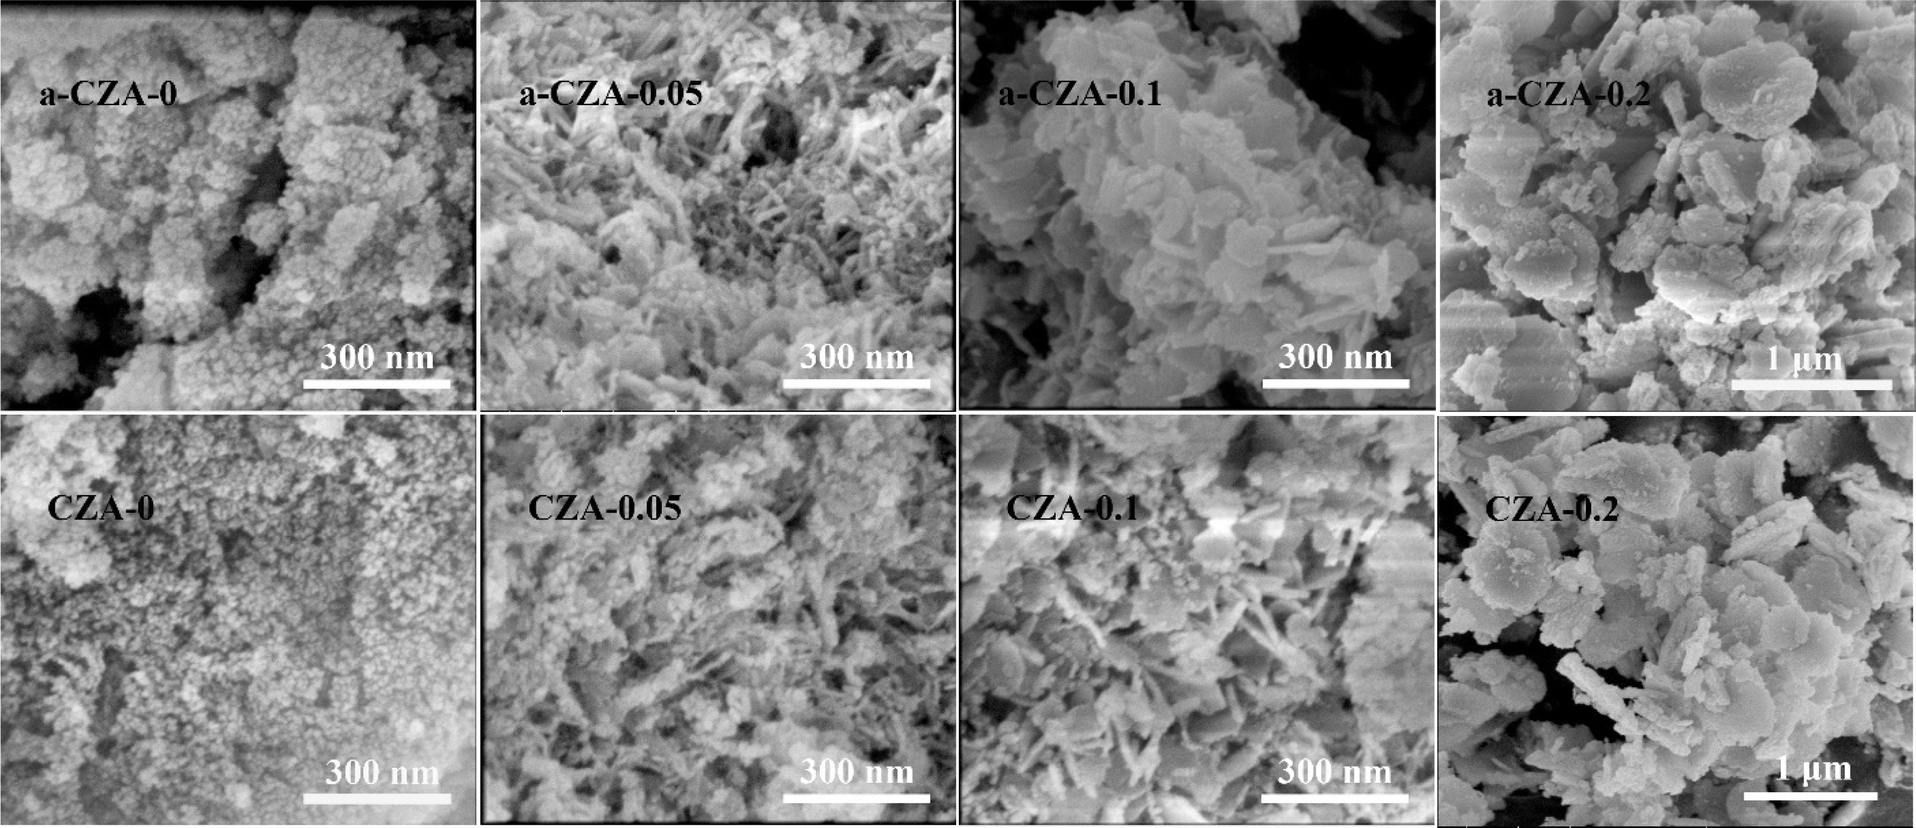 | ||
| Fig. 4 SEM images of as-prepared (a-) and calcined CZA-Mgx catalysts. | ||
The SEM images of the as-prepared and calcined CZA-Mgx catalysts are given in Fig. 4. It can be seen that the structure of the CZA-0 precursor is in the form of irregular particles. After doping Mg2+ ions, the morphology of the CZA precursor varied. The CZA-0.05 precursor exhibited two different types of microstructure: its major part comprised needle-like crystallites and the minor portion was composed of platelet-like crystallites. According to the research results of Behrens et al., the needle-like crystallites can be ascribed to the zincian malachite phases in the precursor materials.18,19 Moreover, the appearance of platelet-like crystals indicates the formation of layered htl phases.24–26 With the increase in the molar ratio of Mg2+/Al3+, the needle-like crystallites disappeared, and only well-developed and thin platelet-like crystallites with a size of 100–200 nm were present in the CZA-0.1 precursor, which were homogeneous and densely stacked. When more Mg2+ ions were introduced into the sample (as in CZA-0.2), some fragments formed, and the size and thickness of the platelets increased markedly. It was reported that the smaller crystal size of the htl platelets favors face-to-face and edge-to-edge interactions between individual platelets because of the higher surface energies.37
After the CZA-Mgx precursors were calcined at 450 °C, the CZA-0.1 and CZA-0.2 samples roughly maintained the morphologies of the precursor materials, though some crystallites have been destroyed during thermal treatment, indicating that the layered structure has good thermal stability and particle aggregation would not occur after the thermal treatment.
The TEM images of the catalysts with different ratios of Mg2+/Al3+ are shown in Fig. 5. The CZA-0 and CZA-0.05 samples exhibit similar morphologies (approximately granular pattern) with the crystallite size of 10–20 nm. For the CZA-0.1 sample, unlike the former two samples, some lamellar platelets with a size of 50–80 nm can be observed, and a small amount of isolated and agglomerated particles are located on the destroyed platelets. Similarly, for the CZA-0.2 sample, only thick platelet-like particles can be observed, and their thickness and size are much larger than those for the CZA-0.1 sample, which are consistent with the SEM images presented in Fig. 4.
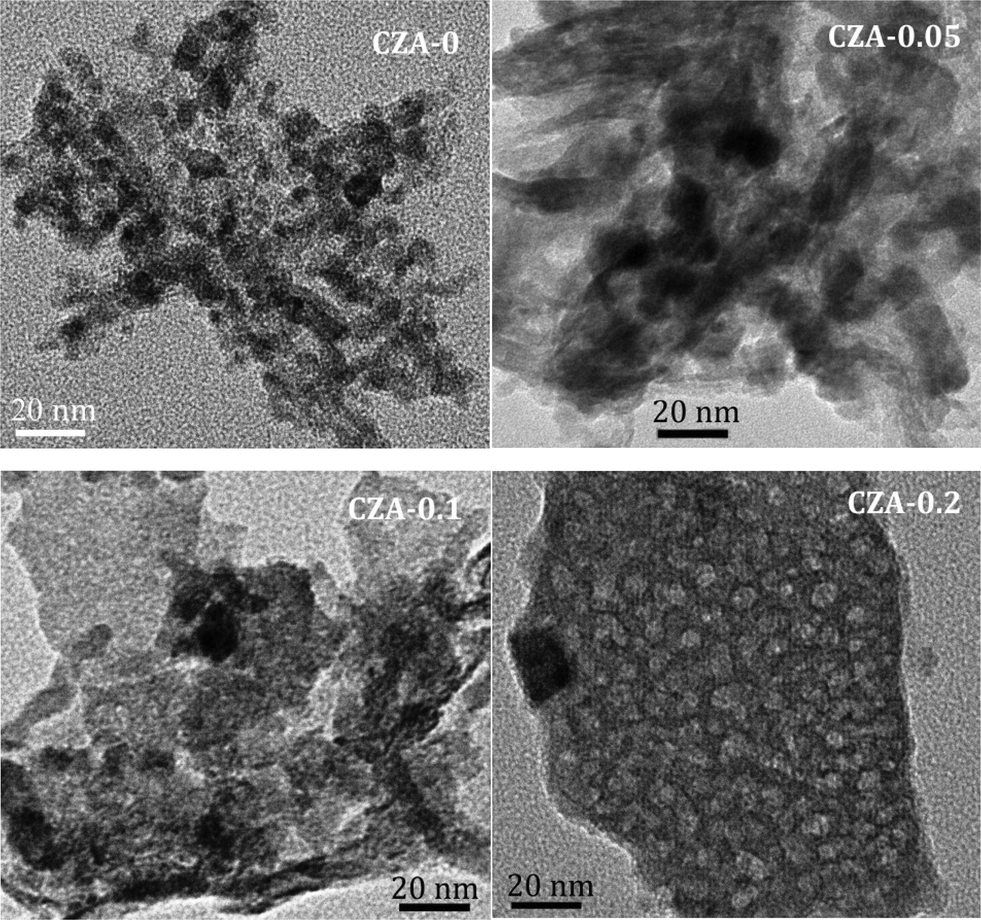 | ||
| Fig. 5 TEM images of the CZA-Mgx calcined at 450 °C. | ||
3.2. The reducibility of catalysts
To assess the reduction behavior of the calcined catalysts, the H2-TPR technique was used and the results are shown in Fig. 6. The reduction peaks of all samples are located at 150–300 °C, which can be deconvoluted into two (α and β) peaks. The peak positions and the relative contribution of the α peak to the TPR pattern are summarized in Table 1. Since ZnO, MgO and Al2O3 cannot be reduced in this temperature region,26,31,38,39 these reduction peaks are only ascribed to the reduction of CuO species.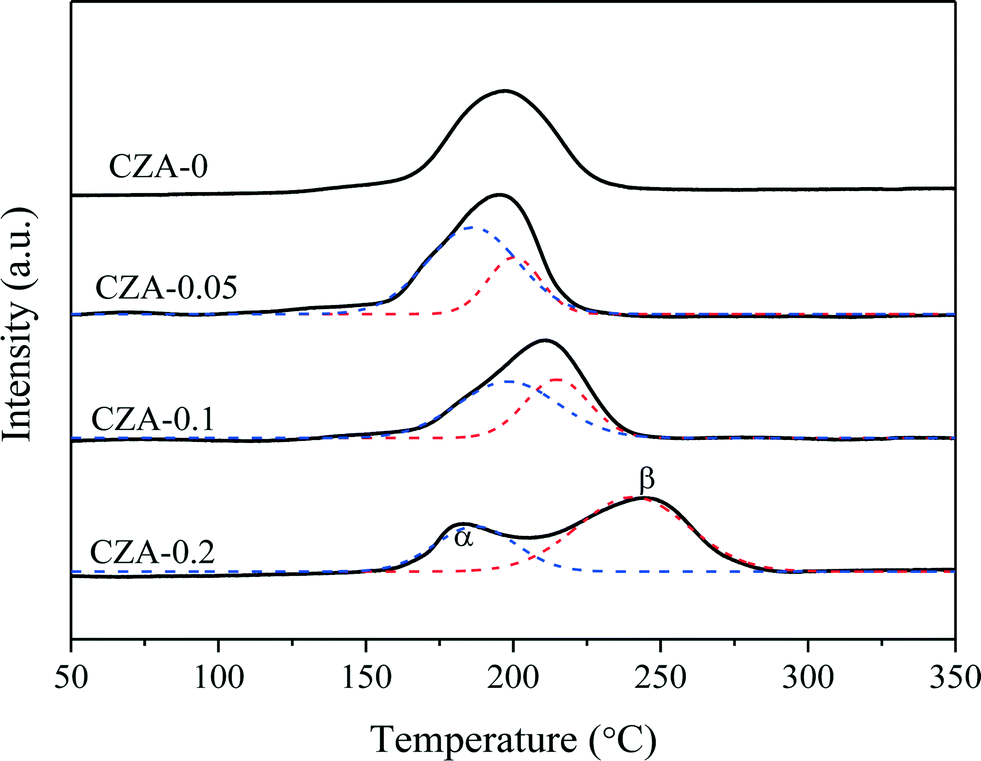 | ||
| Fig. 6 H2-TPR profiles of CZA-Mgx calcined at 450 °C. | ||
In the TPR curve of the CZA-0 sample, only one reduction peak existed at ~196 °C, suggesting that uniform particles of CuO species are present. After doping Mg2+ ions, the reduction peak of the calcined catalysts split into α and β peaks. The low-temperature reduction peaks (α peaks) of the three samples have similar top temperatures and should be the reduction peaks of nanosized CuO clusters exposed on the surface of platelets26 or the surface CuO.40–43 Tan et al.44 reported that the strong interaction between CuO and Al2O3 could cause the H2 reduction temperature of copper oxide to be much higher than that of supported CuO. Li et al.45 reported that the intergrowth mixed oxides of CuO and γ-Al2O3 have strong mutual interaction, which can cause the H2 reduction temperature to be higher than that of the mechanically mixed oxide.
Herein, the doping of Mg2+ ions can promote the formation of hydrotalcite-like (htl) phases in precursor materials, which are beneficial to the distribution of the corresponding metal oxides at an atomic level. The highly dispersed nano-Cu2+ species could incorporate into the Zn–Al–O matrix after being calcined,46 resulting in the segregation of reducible Cu2+ before reduction from irreducible Zn2+ and Al3+ species. Hence, the higher temperature reduction peak (β peak) should be attributed to the well-dispersed Cu2+ cations,46 which increased with the increase in the crystallinity of the htl phases accompanied by a decrease in the fraction of the α peak (Table 1). Although this strong incorporating effect results in the decline in reducibility of the Cu2+ species, it can help to increase and stabilize the Cu0 dispersion by the introduced strong metal–support interaction (SMSI) effect between Cu0 and Al2O3 after catalyst reduction, increasing the catalytic performance and stability of this catalyst. For the CZA-0 sample without Mg doping, the growth of metallic copper crystallites during the reaction (TEM images, Fig. S3†) is responsible for the deactivation behavior of the CZA-0 sample.
The BET surface areas (SBET) of the calcined catalysts are listed in Table 2. Some decrease in SBET can be observed after adding Mg to CZA, and when Mg2+/Al3+ = 0.2 (CZA-0.2), its surface area obviously decreased from 92 m2 g−1 to 58.1 m2 g−1. The layered structure causes the metallic oxides to be in intimate contact with each other, which will reduce the volume of the piled pores. Also, the thicker the layered structure thickness, the more obvious this effect should be.
The accessible metallic copper surface area (SCu) of the calcined catalysts was determined by N2O titration after reduction. The effect of the Mg2+/Al3+ ratio on SCu is similar to that on SBET. As shown in Table 2, the SCu of CZA-0.2 was only 3.2 m2 g−1, and was 5.5% of its BET surface area of 58.1 m2 g−1. With the decrease of the Mg amount in CZA-Mgx, the SCu (or SCu/SBET) was enhanced, for example, the SCu of CZA-0 was maximum (16.9 m2 g−1) and reached 18.4% of its SBET. For the CZA-0.1 catalyst, its SCu was 7.5 m2 g−1 which was 18.4% of its SBET (88.8 m2 g−1). This is because the dense layered structure of the calcined catalysts obtained from the htl precursor materials would make the Cu particles embed in a compact oxide matrix to a large extent; hence, the accessible Cu surface areas of these calcined samples are much lower than that of the CuZn0.3AlOx catalyst.
3.3. The surface acidities of CuZn0.3MgxAlOy catalysts
The acidities of the CuZn0.3MgxAlOy catalysts were determined by NH3-TPD, and the results are shown in Fig. 7. As shown in Fig. 7, the four TPD profiles have similar broad peaks that can be deconvoluted into two (α and β) peaks; the former was located at ~200 °C and the latter was located at 270–280 °C, which can be ascribed to the weaker and medium-strong acidic sites, respectively. These acid sites are related to the contribution of different metal oxides, such as Al2O3, ZnO and CuO, in which the contribution of Al2O3 probably prevails. With an increase in the amount of MgO, the intensities of the α and β peaks gradually decreased, which indicates the reduction of the weaker and medium-strong acid site amounts. Thus, MgO can act as an effective dopant to adjust the amount of acidic sites over the Cu/ZnO/Al2O3 catalyst.47,48 To quantify these changes, the TPD profiles were integrated, and the results are listed in Table 3. The following characteristics can be obtained: (1) the amounts of medium-strong and weaker acid sites are continuously decreased with the Mg2+/Al3+ ratio increasing from 0 to 0.2; (2) the strength of the weaker acid sites is hardly affected by the ratio of Mg2+/Al3+ because of the unchanged α-peak temperature; (3) the strength of the medium-strong acid sites is reduced a little with increasing Mg2+ amount; (4) the fraction of weaker or medium-strong acid sites to total acid sites is hardly affected by the ratio of Mg2+/Al3+; (5) the density of the total acid sites of the CZA-0.1 sample is the smallest.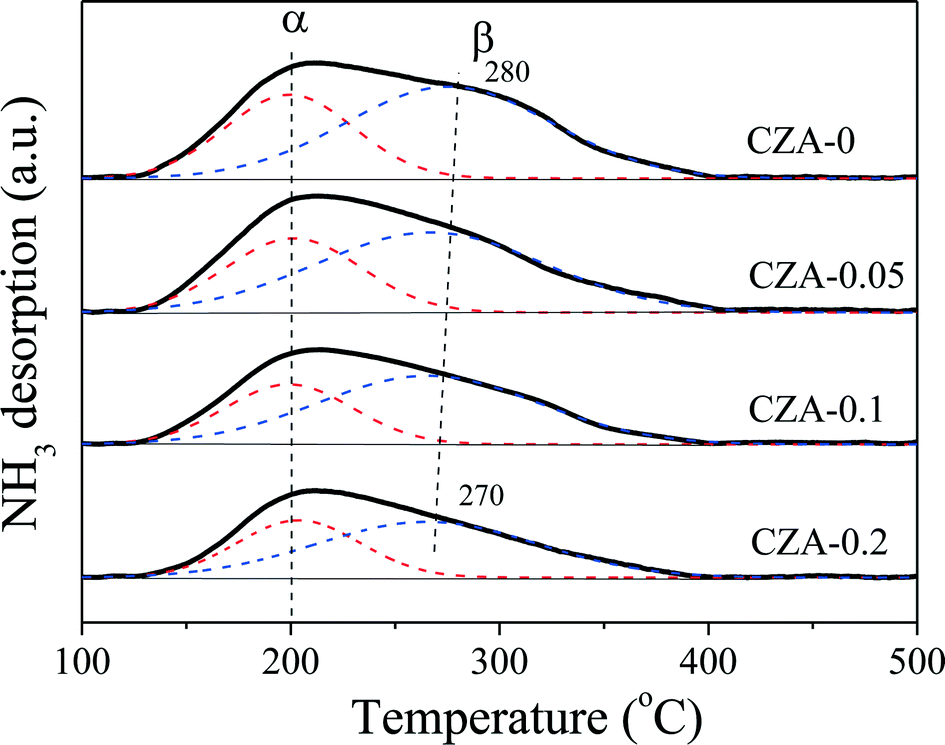 | ||
| Fig. 7 NH3-TPD profiles of CZA-Mgx calcined at 450 °C. | ||
| Sample | T α/Tβ (°C) | Total acid sites | |||
|---|---|---|---|---|---|
| (μmol g−1) | (μmol m−2) | α (μmol g−1) | β (μmol g−1) | ||
| a The value in the parenthesis is a fraction of this portion of the acid sites to the total acid sites. | |||||
| CZA-0 | 200/280 | 13.3 | 0.145 | 4.7a (35.2%) | 8.6 (64.8%) |
| CZA-0.05 | 200/276 | 12.0 | 0.138 | 4.4 (34.6%) | 8.2 (65.4%) |
| CZA-0.1 | 200/273 | 10.3 | 0.116 | 3.5 (34.0%) | 6.8 (66.0%) |
| CZA-0.2 | 200/270 | 8.7 | 0.150 | 3.2 (36.7%) | 5.5 (63.3%) |
3.4. Catalytic performance
We have found that L-phenylalaninol (L-p-ol) selectivity is independent of L-phenylalanine methyl ester (L-p) conversion over this CZA catalyst, and the formed L-p-ol does not undergo further reactions under the conditions applied.14 Hence, the L-p-ol selectivity (or yield) at 100% conversion of L-p is used to describe the catalytic performances of the CZA-Mgx catalysts. The effect of the amount of Mg2+ in the catalyst on its L-p-ol selectivity is presented in Fig. 8, in which a volcanic shape of the L-p-ol selectivity versus the Mg2+/Al3+ molar ratio in the catalyst could be observed and the highest L-p-ol selectivity reached 91.2% over the CZA-0.1 catalyst.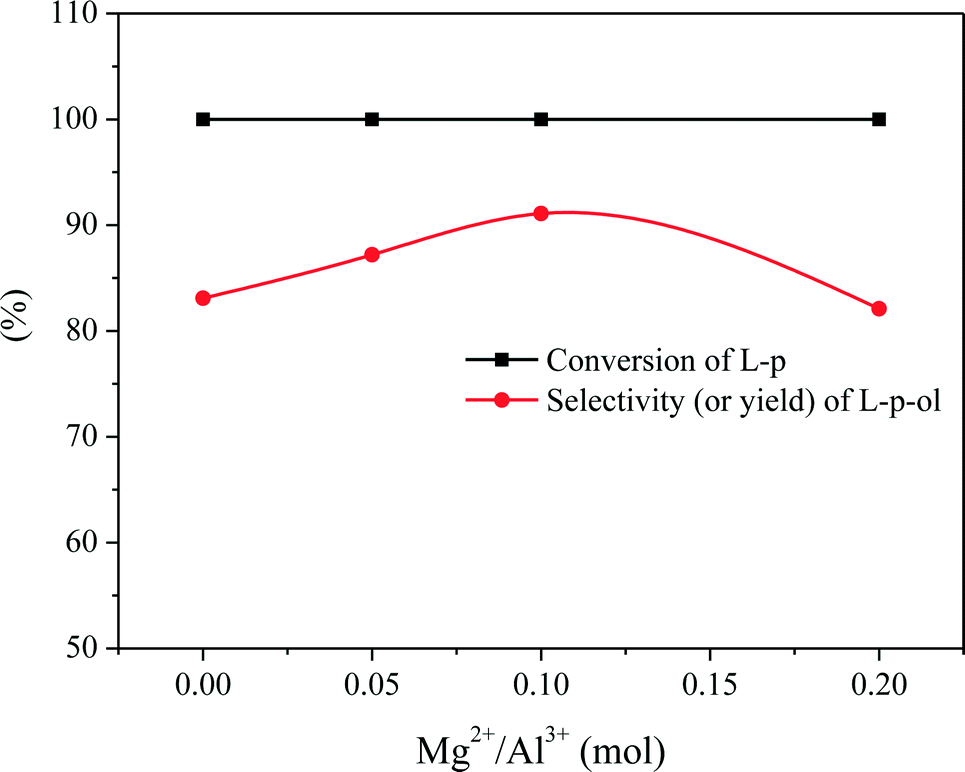 | ||
| Fig. 8 The effect of Mg2+ content on the performance of the CuZn0.3MgxAlOy catalysts at 110 °C and 4 MPa H2 for 5 h (L-p/Cat. = 1.5, wt). Experimental errors of the conversion and yield are within ±2%. | ||
Then, the CZA-0.1 catalyst was used as the model catalyst to test its stability or properties for recycling usage, which was performed by repeating the batch operation under the optimum reaction conditions,13 and the results are shown in Fig. 9. The results show that the catalytic activity of the CZA-0 catalyst dramatically decreased after 7 runs, the conversion of L-phenylalanine methyl ester was 83.7% and the yield of L-phenylalaninol decreased to 50.7%; the presence of Mg resulted in a great improvement of the stability of the CZA-0.1 catalyst and after recycling 13 times, the L-phenylalaninol selectivity of the CZA-0.1 catalyst only decreased by 7.2%.
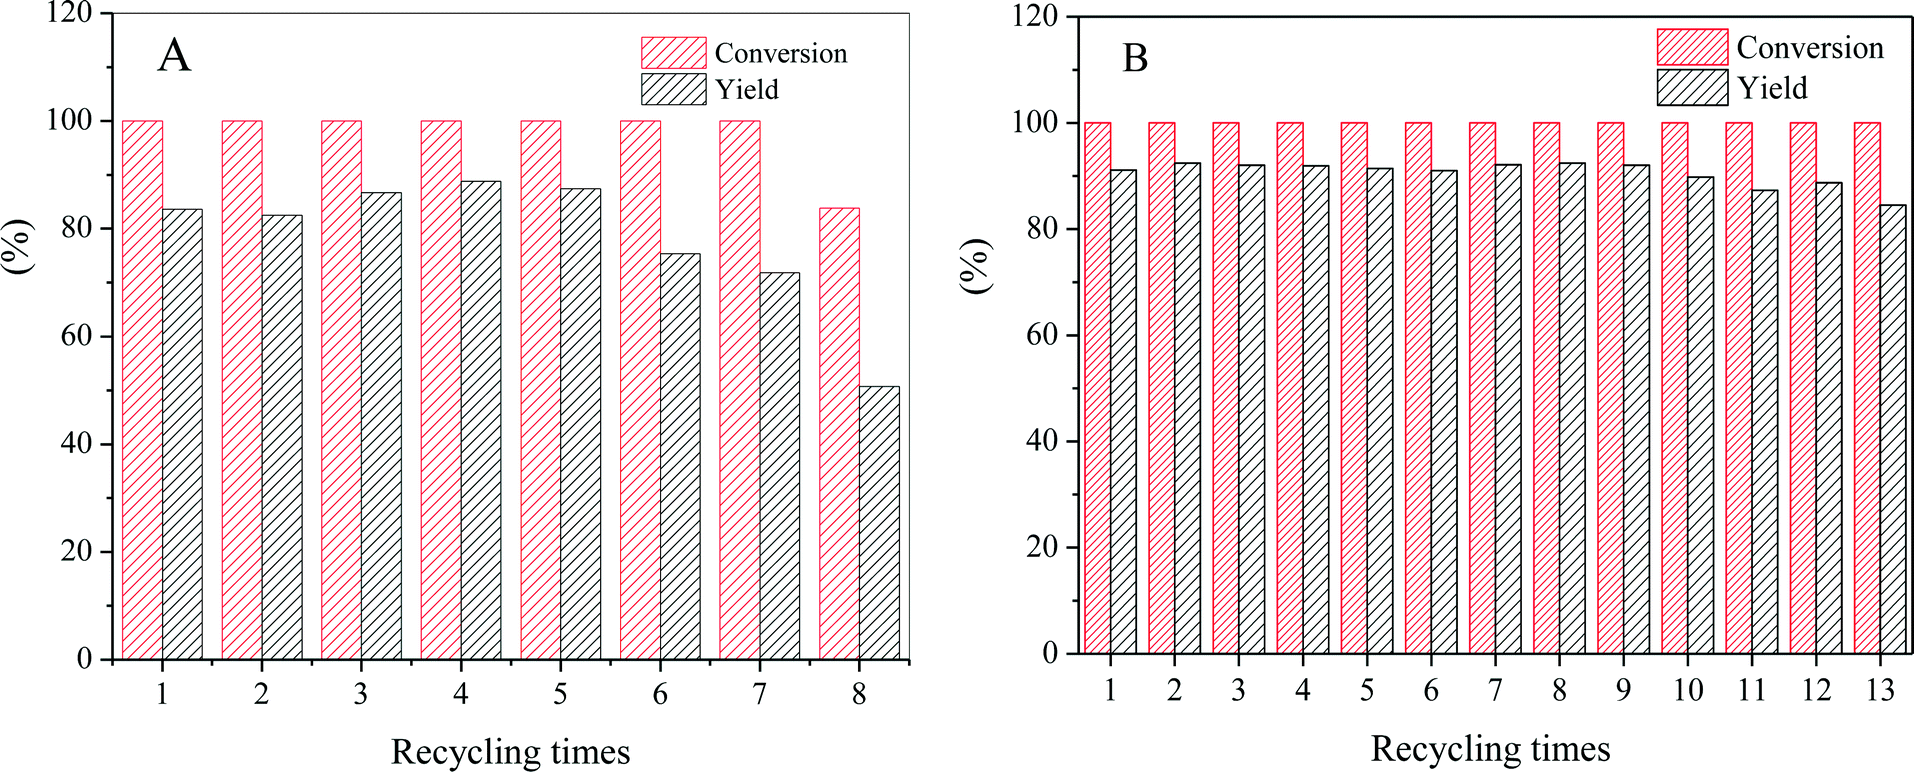 | ||
| Fig. 9 The effect of recycling times on the catalytic activity of (A) CZA-0 and (B) CZA-0.1 catalysts for the hydrogenation of L-phenylalanine methyl ester at 110 °C and 4 MPa H2 for 5 h (L-p/Cat. =1.5, wt). Experimental errors of the conversion and yield are within ±2%. | ||
3.5. Discussion about the active sites on the catalyst
For a copper-based catalyst to be considered highly effective, a large metallic copper surface area (SCu) is generally thought to be a prerequisite and the major goal in the catalyst preparation.31,49–51 Recently, many research studies have demonstrated that SCu is not the conclusive factor for the high catalytic activity. For instance, Spencer et al.52 reported that the WGS reaction over the Cu/ZnO/Al2O3 catalyst was sensitive to some parameters of the catalyst other than its Cu surface area. Tan et al.44 reported that the copper surface area and particle size of Cu and ZnO are not the decisive factors for the catalytic activity of the Cu/ZnO-based catalyst for glycerol hydrogenolysis. Behrens et al.53 investigated the role of the oxide component in copper composite catalysts for methanol synthesis and found that the methanol synthesis rate is not only a function of the exposed Cu surface area alone in the hydrogenation of CO2. Herein, to better disclose the relationship between the catalytic activity and SCu, a plot of the L-p-ol selectivity versus SCu is presented in Fig. 10A. It can be seen that no direct linear correlation between the L-p-ol selectivity and SCu can be observed for this title reaction, which shows that the activity of the CuZn0.3MgxAlOy catalysts is related not only to SCu but also to other factors. However, it also has to be mentioned that SCu is still an important parameter for the catalytic activity, considering the fact that the CZA-0.2 sample has the smallest SCu and exhibits the lowest selectivity to L-p-ol. | ||
| Fig. 10 The relationship between the L-p-ol selectivity and (A) the Cu surface area, and (B) the density of the total acid sites. | ||
Nowadays, it is widely accepted that Cu0 is the active site for the hydrogenation reaction, but the nature of these active sites is still under debate. A lot of discussions about the influence of other intrinsic factors on the catalytic activity were reported, such as the widely studied Cu–ZnO synergy,53–55 the SMSI effect between Cu0 and other oxides,18,56–59 the defects and steps of the Cu nanoparticles,56,60,61 the acidity and basicity of the catalysts,24,48,50etc.
We have found that there are some insoluble polyamides (by-product) on the surface and inside the channels of the CuZn0.3AlOx (CZA-0) catalyst after being used, which is an important reason for the decline of catalytic activity, as shown in Fig. S1 and S5 as well as Tables S1 and S2.† Furthermore, this insoluble polyamide can be formed catalytically on the acid sites, resulting in the inaccessibility of the active catalytic sites to the reactants. The NH3-TPD results show that the presence of MgO would reduce the amount of acid sites of the catalyst to inhibit the formation of alkaline polyamide. Herein, the plot of the L-p-ol selectivity versus the density of the total acid sites was also taken and is given in Fig. 10B. Obviously, the L-p-ol selectivity decreases linearly with the increase in the density of the total acid sites. Hence, it can be concluded that these weaker acid sites are another importantly contributing factor for the increase in the catalytic activity and stability.
We also found that the deactivated CuZn0.3AlOx (CZA-0) catalyst has a larger size of metallic copper crystallites (Fig. S2 and S3†), resulting in the decline of the catalytic activity. In this CuZn0.3MgxAlOy catalyst, the doping of Mg2+ ions can promote the formation of hydrotalcite-like phases in the precursor materials, which are beneficial to the atomically uniform distribution of metallic oxides in the hydrotalcite-like phases. The higher dispersion and smaller particle size of CuO species can be obtained after the hydrotalcite-like precursor materials were calcined. In these prepared platelet-like particles, the nanosized CuO species are, to a large extent, highly dispersed and embedded in the compact oxide matrix (Zn0.3MgxAlOy), which would decrease the accessible Cu surface area. Moreover, this dense microstructure is beneficial to the SMSI effect between Cu0 and the other oxides after catalyst reduction, resulting in the decline of the reducibility of CuO species. On the one hand, this SMSI effect can efficiently increase and stabilize the Cu0 dispersion, which can prevent the agglomeration of Cu0 particles during the reaction, to increase the catalytic activity and stability. On the other hand, intimate interfacial contact of both catalyst components would enhance the SMSI effect between Cu0 and ZnO, resulting in the migration of zinc atoms into the copper nanoparticle surfaces to further enhance the catalytic activity.53,56,60
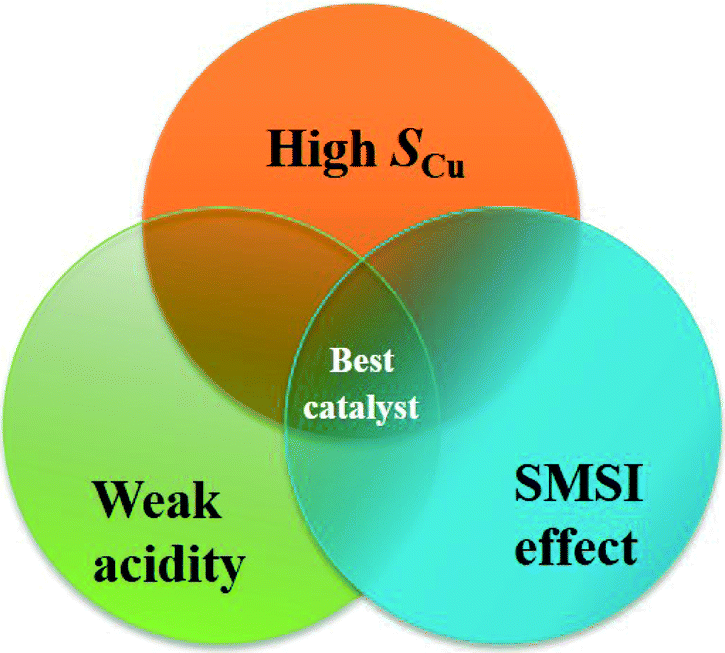
The results mentioned above show that the high efficiency of the CuZn0.3MgxAlOy catalyst for L-p-ol synthesis is mainly related to three essential factors, namely high SCu, appropriate SMSI effect and weaker acidity, and their relationship can be described as shown in Fig. 11. The catalyst should possess a high SCu to expose a large number of active sites; by the help of the appropriate SMSI effect, the Cu0 dispersion and the active sites would increase and stabilize; the catalyst's acidity should be weaker, which is beneficial for inhibiting the formation of the insoluble polyamide and its desorption from the surface. Only if all three factors take effect together on this catalyst would the highly effective active sites be formed for the hydrogenation of L-phenylalanine methyl ester to L-phenylalaninol.
 | ||
| Fig. 11 Relationship of the essential factors for a highly effective L-p-ol synthesis catalyst. | ||
4. Conclusions
In summary, a series of CuZn0.3MgxAlOy (CZA-Mgx, x = 0–0.2) catalysts derived from Cu-rich hydrotalcite-like compounds were prepared by a co-precipitation method with Na2CO3 as the precipitant. The results show that the Mg2+ ion content has a significant influence on the physicochemical and catalytic properties of the CuZn0.3MgxAlOy catalysts for the hydrogenation of L-phenylalanine methyl ester to L-phenylalaninol.The introduction of Mg2+ ions into CZA can promote the formation of hydrotalcite-like precursors, and the Mg2+ ion content would affect the phase purity of the hydrotalcite-like precursors. When the molar ratio of Mg2+/Al3+ was 0.1, the phase-pure hydrotalcite-like precursor of the CuZn0.3Mg0.1AlOy (CZA-0.1) catalyst could be obtained. With an increase in the Mg2+/Al3+ molar ratio, the BET surface area and exposed copper surface area of CZA-Mgx decreased, and the amount of acid sites showed a similar change trend with Mg2+/Al3+ molar ratio. The density of the total acid sites of the CZA-0.1 sample is the smallest at only 0.116 μmol m−2.
The dense layered hydrotalcite-like precursors are beneficial to the atom-level distribution of the corresponding metal oxides in the resulting CuZn0.3MgxAlOy catalysts, and the stronger interaction between Cu0 and Al2O3 (SMSI effect) after catalyst reduction can increase and stabilize the Cu0 dispersion, resulting in the decrease in the CuO species reducibility.
The activity of the CuZn0.3MgxAlOy catalysts is greatly dependent on not only the metallic copper surface area, but also the SMSI effect and the acidity of the catalysts. The CZA-0.1 catalyst with Mg2+/Al3+ = 0.1 (mol) was made from phase-pure hydrotalcite-like precursors and showed the highest activity among the CZA-Mgx catalysts. When L-phenylalanine methyl ester was hydrogenated over this catalyst at 110 °C and 4 MPa H2, 100% conversion of L-phenylalanine methyl ester and 91.1% yield of L-phenylalaninol without racemization were achieved. After recycling 13 times, the L-phenylalaninol selectivity of the CZA-0.1 catalyst only decreased by 7.2%, which shows its very high stability and good recycling utilization properties.
Acknowledgements
This project was supported financially by the National Basic Research Program of China (2010CB732300).References
- C. L. Paradise, P. R. Sarkar, M. Razzak and J. K. de Brabander, Org. Biomol. Chem., 2011, 9, 4017–4020 CAS.
- J. Meng, G. Wei, X. Huang, Y. Dong, Y. Cheng and C. Zhu, Polymer, 2011, 52, 363–367 CrossRef CAS.
- J. Jiao, X. Liu, X. Mao, J. Li, Y. Cheng and C. Zhu, New J. Chem., 2013, 37, 317–322 RSC.
- A. R. Hajipour and F. Omidian, High Perform. Polym., 2010, 22, 550–566 CrossRef CAS.
- A. Pinaka, G. C. Vougioukalakis, D. Dimotikali, E. Yannakopoulou, B. Chankvetadze and K. Papadopoulos, Chirality, 2013, 25, 119–125 CrossRef CAS PubMed.
- A. S. Saiyed and A. V. Bedekar, Tetrahedron: Asymmetry, 2013, 24, 1035–1041 CrossRef CAS.
- B. Ak, D. Elma, N. Meriç, C. Kayan, U. Işık, M. Aydemir, F. Durap and A. Baysal, Tetrahedron: Asymmetry, 2013, 24, 1257–1264 CrossRef CAS.
- S. Arita, T. Yabuuchi and T. Kusumi, Chirality, 2003, 15, 609–614 CrossRef CAS PubMed.
- H. He, D. Gong and P. Wei, Chem. Reagents, 2005, 27, 115–116 CAS.
- M. J. McKennon, A. Meyers, K. Drauz and M. Schwarm, J. Org. Chem., 1993, 58, 3568–3571 CrossRef CAS.
- M. Souček, J. Urban and D. Šaman, Collect. Czech. Chem. Commun., 1990, 55, 761–765 CrossRef.
- R. Goncalves, A. Pinheiro, E. da Silva, J. da Costa, C. Kaiser and M. de Souza, Synth. Commun., 2011, 41, 1276–1281 CrossRef CAS.
- C. Gao, X. Xiao, D. Mao and G. Lu, Catal. Sci. Technol., 2013, 3, 1056–1062 CAS.
- Z. Shi, X. Xiao, D. Mao and G. Lu, Catal. Sci. Technol., 2014, 4, 1132–1143 CAS.
- G. Yang, N. Tsubaki, J. Shamoto, Y. Yoneyama and Y. Zhang, J. Am. Chem. Soc., 2010, 132, 8129–8136 CrossRef CAS PubMed.
- S. Yu, Y. Chen, S. Gao, X. Wang and W. Huang, Asian J. Chem., 2013, 25, 6856–6860 CAS.
- S. Kaluza, M. Behrens, N. Schiefenhövel, B. Kniep, R. Fischer, R. Schlögl and M. Muhler, ChemCatChem, 2011, 3, 189–199 CrossRef CAS.
- M. Behrens, S. Zander, P. Kurr, N. Jacobsen, J. R. Senker, G. Koch, T. Ressler, R. W. Fischer and R. Schlögl, J. Am. Chem. Soc., 2013, 135, 6061–6068 CrossRef CAS PubMed.
- M. Behrens, J. Catal., 2009, 267, 24–29 CrossRef CAS.
- T. Fujitani and J. Nakamura, Catal. Lett., 1998, 56, 119–124 CrossRef CAS.
- D. M. Whittle, A. A. Mirzaei, J. S. Hargreaves, R. W. Joyner, C. J. Kiely, S. H. Taylor and G. J. Hutchings, Phys. Chem. Chem. Phys., 2002, 4, 5915–5920 RSC.
- M. Turco, G. Bagnasco, U. Costantino, F. Marmottini, T. Montanari and G. Ramis, J. Catal., 2004, 228, 43–55 CAS.
- U. Costantino, M. Curini, F. Montanari, M. Nocchetti and O. Rosati, Microporous Mesoporous Mater., 2008, 107, 16–22 CrossRef CAS.
- P. Gao, F. Li, H. Zhan, N. Zhao, F. Xiao, W. Wei, L. Zhong, H. Wang and Y. Sun, J. Catal., 2013, 298, 51–60 CrossRef CAS.
- P. Gao, F. Li, F. Xiao, N. Zhao, N. Sun, W. Wei, L. Zhong and Y. Sun, Catal. Sci. Technol., 2012, 2, 1447–1454 CAS.
- M. Behrens, I. Kasatkin, S. Kühl and G. Weinberg, Chem. Mater., 2010, 22, 386–397 CrossRef CAS.
- J. Carpentier, S. Siffert, J. Lamonier, H. Laversin and A. Aboukaïs, J. Porous Mater., 2007, 14, 103–110 CrossRef CAS.
- F. Cavani, F. Trifirò and A. Vaccari, Catal. Today, 1991, 11, 173–301 CrossRef CAS.
- M. Behrens, F. Girgsdies, A. Trunschke and R. Schlögl, Eur. J. Inorg. Chem., 2009, 2009, 1347–1357 CrossRef.
- C. Chen, P. Gunawan, X. W. D. Lou and R. Xu, Adv. Funct. Mater., 2012, 22, 780–787 CrossRef CAS.
- X. Guo, D. Mao, G. Lu, S. Wang and G. Wu, J. Catal., 2010, 271, 178–185 CrossRef CAS.
- L. He, H. Cheng, G. Liang, Y. Yu and F. Zhao, Appl. Catal., A, 2012, 452, 88–93 CrossRef.
- J. Cheng, J. Yu, X. Wang, L. Li, J. Li and Z. Hao, Energy Fuels, 2008, 22, 2131–2137 CrossRef CAS.
- R. Trujillano, M. J. Holgado, F. Pigazo and V. Rives, Phys. B, 2006, 373, 267–273 CrossRef CAS.
- I. Melian-Cabrera, M. L. Granados and J. Fierro, Phys. Chem. Chem. Phys., 2002, 4, 3122–3127 RSC.
- C.-H. Zhou, J. N. Beltramini, C.-X. Lin, Z.-P. Xu, G. M. Lu and A. Tanksale, Catal. Sci. Technol., 2011, 1, 111–122 CAS.
- J. A. Gursky, S. D. Blough, C. Luna, C. Gomez, A. N. Luevano and E. A. Gardner, J. Am. Chem. Soc., 2006, 128, 8376–8377 CrossRef CAS PubMed.
- R. K. Marella, C. K. P. Neeli, S. R. R. Kamaraju and D. R. Burri, Catal. Sci. Technol., 2012, 2, 1833–1838 CAS.
- M. Balaraju, K. Jagadeeswaraiah, P. S. Prasad and N. Lingaiah, Catal. Sci. Technol., 2012, 2, 1967–1976 CAS.
- M. Turco, G. Bagnasco, C. Cammarano, P. Senese, U. Costantino and M. Sisani, Appl. Catal., B, 2007, 77, 46–57 CrossRef CAS.
- S. Murcia-Mascaros, R. Navarro, L. Gomez-Sainero, U. Costantino, M. Nocchetti and J. Fierro, J. Catal., 2001, 198, 338–347 CrossRef CAS.
- S. Velu, K. Suzuki, M. Okazaki, M. Kapoor, T. Osaki and F. Ohashi, J. Catal., 2000, 194, 373–384 CrossRef CAS.
- T. Shishido, M. Yamamoto, D. Li, Y. Tian, H. Morioka, M. Honda, T. Sano and K. Takehira, Appl. Catal., A, 2006, 303, 62–71 CrossRef CAS.
- H. Tan, M. N. Hedhill, Y. Wang, J. Zhang, K. Li, S. Sioud, Z. A. Al-Talla, M. H. Amad, T. Zhan and O. E. Tall, Catal. Sci. Technol., 2013, 3, 3360–3370 CAS.
- B. Li, G. Jin, J. Gao, R. Zhao, L. Dong and Y. Gong, CrystEngComm, 2014, 16, 1253–1256 RSC.
- S. Kühl, A. Tarasov, S. Zander, I. Kasatkin and M. Behrens, Chem. – Eur. J., 2014, 20, 3782–3792 CrossRef PubMed.
- X. Long, Q. Zhang, Z.-T. Liu, P. Qi, J. Lu and Z.-W. Liu, Appl. Catal., B, 2013, 134, 381–388 CrossRef.
- D. Mao, W. Yang, J. Xia, B. Zhang, Q. Song and Q. Chen, J. Catal., 2005, 230, 140–149 CrossRef CAS.
- A. Bienholz, H. Hofmann and P. Claus, Appl. Catal., A, 2011, 391, 153–157 CrossRef CAS.
- X. Guo, D. Mao, G. Lu, S. Wang and G. Wu, J. Mol. Catal. A: Chem., 2011, 345, 60–68 CrossRef CAS.
- S. Natesakhawat, J. W. Lekse, J. P. Baltrus, P. R. Ohodnicki Jr., B. H. Howard, X. Deng and C. Matranga, ACS Catal., 2012, 2, 1667–1676 CrossRef CAS.
- G. Chinchen and M. Spencer, Catal. Today, 1991, 10, 293–301 CrossRef CAS.
- S. Zander, E. L. Kunkes, M. E. Schuster, J. Schumann, G. Weinberg, D. Teschner, N. Jacobsen, R. Schlögl and M. Behrens, Angew. Chem., Int. Ed., 2013, 52, 6536–6540 CrossRef CAS PubMed.
- J.-D. Grunwaldt, A. Molenbroek, N.-Y. Topsøe, H. Topsøe and B. Clausen, J. Catal., 2000, 194, 452–460 CrossRef CAS.
- M. Spencer, Top. Catal., 1999, 8, 259–266 CrossRef CAS.
- M. Behrens, F. Studt, I. Kasatkin, S. Kühl, M. Hävecker, F. Abild-Pedersen, S. Zander, F. Girgsdies, P. Kurr and B.-L. Kniep, Science, 2012, 336, 893–897 CrossRef CAS PubMed.
- R. N. d'Alnoncourt, X. Xia, J. Strunk, E. Löffler, O. Hinrichsen and M. Muhler, Phys. Chem. Chem. Phys., 2006, 8, 1525–1538 RSC.
- Y. Xing, Z. Liu and S. L. Suib, Chem. Mater., 2007, 19, 4820–4826 CrossRef CAS.
- J.-H. Lin, Z.-Y. Zeng, Y.-T. Lai and C.-S. Chen, RSC Adv., 2013, 3, 1808–1817 RSC.
- J. P. Greeley, Science, 2012, 336, 810–811 CrossRef PubMed.
- T. Kandemir, F. Girgsdies, T. C. Hansen, K. D. Liss, I. Kasatkin, E. L. Kunkes, G. Wowsnick, N. Jacobsen, R. Schlögl and M. Behrens, Angew. Chem., Int. Ed., 2013, 52, 5166–5170 CrossRef CAS PubMed.
Footnote |
| † Electronic supplementary information (ESI) available: Structural and textural properties (Table S1), pore size distribution curves (Fig. S1), XRD patterns (Fig. S2), morphologies (Fig. S3), surface element compositions (Table S2), XPS spectra (Fig. S4) and TG-DTG curves (Fig. S5) of the fresh, deactivated and unreduced CZA-0 catalysts characterized by various techniques, as well as the regeneration of the deactivated catalyst and its catalytic activity. See DOI: 10.1039/c5cy01238d |
| This journal is © The Royal Society of Chemistry 2016 |