 Open Access Article
Creative Commons Attribution 3.0 Unported Licence
Metal–support interactions in surface-modified Cu–Co catalysts applied in higher alcohol synthesis
Ankur
Bordoloi
a,
Johan
Anton
b,
Holger
Ruland
b,
Martin
Muhler
b and
Stefan
Kaluza
*bc
aCSIR-Indian Institute of Petroleum, Dehradun, India
bLaboratory of Industrial Chemistry, Ruhr University Bochum, Bochum, Germany
cFraunhofer Institute for Environmental, Safety and Energy Technology UMSICHT, Oberhausen, Germany. E-mail: stefan.kaluza@umsicht.fhg.de
First published on 5th May 2015
Abstract
Cu–Co-based model catalysts were prepared by a sophisticated alkali-free synthesis method and tested in the conversion of synthesis gas to higher alcohols. MoO3-coated alumina was used as the support, providing both high specific surface area and strongly interacting sites for the deposition of the active metals. A bulk Cu/Co ratio of ~2 was found to be most suitable in terms of activity and product distribution. Surface enrichment of Mo for all samples was observed by XPS, which significantly influenced the performance of the catalysts. Mo was found to be both a structural and a chemical promoter. Strong metal–support interactions were further achieved by modification of alumina with magnesia. With 12 wt% Mg incorporated, the catalysts showed 40% total oxygenate selectivity including 11% selectivity to ethanol.
1. Introduction
Conversion of synthesis gas derived from different resources (natural gas, coal, or biomass) has attracted renewed interest due to the possibility of producing clean fuels, fuel additives for octane or cetane enhancement and value added chemicals.1–5 In particular, higher alcohols are considered a potential alternative synthetic fuel for automobiles or a potential source of hydrogen for fuel cell applications.6,7 The heterogeneously catalyzed conversion of syngas to higher alcohols represents a promising route for large-scale higher alcohol production, but no commercial process exists till date. This is mostly due to the fact that controlling the selectivity towards the desired products is still a challenging issue in higher alcohol synthesis (HAS). Consequently, significant improvements in catalyst design and process development are required in order to achieve a commercially attractive process.Typically, higher alcohol synthesis reactions occur over a catalyst that combines several functions including C–O bond breaking, CO insertion and hydrogenation. The formation of higher alcohols involves the insertion of CO into a metal–alkyl bond to give an acyl intermediate that can form an alcohol molecule by hydrogenation.8,9 The preparation method, composition and structure of the catalyst as well as the reaction conditions applied are the determining factors for the selective formation of the intermediates required in HAS.
In general, noble and non-noble metal-based heterogeneous catalysts have been extensively studied for higher alcohol synthesis. Up to now, Rh seems to be the most suitable metal in HAS in terms of higher alcohol productivities. However, due to their high and fluctuating price, Rh-based catalysts are inapplicable on the industrial scale. Alternative systems containing non-noble metals are based on modified catalysts applied in hydrodesulphurization reactions (Mo-based), methanol synthesis (Cu-based) and Fischer–Tropsch synthesis (Co- or Fe-based).9–11
Combination of these metal species is considered a promising method to cope with the different functions required for the selective formation of alcohols. Catalysts for higher alcohol synthesis based on Cu–Co were first reported by the Institut Français du Pétrole (IFP).12 Since then, several reports on Cu–Co catalysts have been published.13–18 In most cases, Cu–Co-based catalysts are prepared by co-precipitation, impregnation or pyrolysis in the presence of organic acids. Meanwhile, different concepts have been developed regarding the nature of the active sites for the formation of higher alcohols over Cu–Co-based catalyst systems.19,20 However, they all agree that close proximity of the different metal species is mandatory, which requires skillful preparation and enhanced catalyst design.21,22
Although unsupported Co–Cu systems seem to be suitable model catalysts to analyze the nature of active sites and the mechanisms involved in carbon monoxide hydrogenation, the use of a support plays a major role in HAS and its choice highly influences the catalytic performance of Cu–Co-based systems in terms of activity, selectivity and stability. Silica has been widely used as a catalyst support due to its high surface area, porosity, and stability. However, silica-supported catalysts exhibit weak metal–support interactions. This leads to an enhanced agglomeration of the cobalt particles during reduction, resulting in a lower degree of dispersion and a decrease in the number of active sites.23 Therefore, the preparation of highly dispersed and stable Cu–Co catalysts requires a strong interaction between the metal precursor and the support. It has been reported that Co/alumina systems exhibit strong metal–support interactions and favorable mechanical properties, which may positively affect the surface properties, and hence the catalytic activity.24,25 Ordered mesoporous alumina are quite interesting and promising catalyst supports due to their structural characteristics such as uniform pore size distribution, high specific surface area, high specific pore volume, tunable pore size and long range ordering of the pore packing.26 The presence of surface hydroxyl groups offers the opportunity to support metals and metal oxides with potential catalytic activity. Moreover, due to the large pores they provide less diffusion limitation for the reactant and product molecules and minimize coke formation. Traditional alumina supports are non-porous or show disordered structures with wide pore size distributions, which makes it difficult to differentiate which pores are involved in the reaction.
In a previous study, mesoporous Co/alumina composites were successfully prepared by evaporation-induced self-assembly (EISA).27 The EISA process is one of the most suitable approaches to design functional mesoporous oxides with fine-tuned structural, compositional and morphological properties.28 However, the strong interaction between cobalt and the alumina support led to enhanced formation of a CoAl2O4 spinel phase. Co2+ is strongly bound in the spinel structure and is hardly reduced at temperatures below 973 K, which makes application in HAS quite difficult.29
The present contribution deals with the preparation of Cu–Co-based model catalysts for HAS applying a support that provides both the structural properties of mesoporous alumina and a suitable surface for efficient anchoring and dispersion of the active sites. For this purpose, mesoporous alumina was partly covered with MoO3 and used as a support for the simultaneous deposition of copper and cobalt. The MoO3 coating reduces spinel formation, which in turn significantly influences the performance of the catalyst. In addition, Mo is known to promote the catalytic performance of Cu/Co-based catalysts applied in HAS.22 The role of the support was further investigated by specific modifications. Moreover, in contrast to conventional preparation methods for HAS catalysts, the presented route does not require any alkali salts. Alkali metals are well-known to promote the HAS reaction.2,13 Thus, uncertain amounts of alkali residues in catalyst samples prepared by conventional co-precipitation or impregnation methods can have a strong impact on the catalyst performance and cause misleading results.30
The alkali-free Cu–Co model catalysts described in this paper were successfully applied in HAS, revealing the first insight into the role of metal–support interactions.
2. Experimental
2.1 Catalyst synthesis
All solvents and chemicals were obtained from Aldrich Chemicals and used as received.For the Mg modified support, 6.0 g of (EO)20(PO)70(EO)20 triblock copolymer (Pluronic P123), 12 g of aluminium isopropoxide and 10 mL of concentrated nitric acid were mixed in 100 mL of ethanol and allowed to stir for 5 h. The required amount of magnesium nitrate was added to the resultant mixture and stirred for one additional hour.
The obtained materials were dried and calcined for 6 h at 973 K applying a heating rate of 2 K min−1.31
2.2 Catalyst characterization
The actual composition of the synthesized materials was revealed by inductively coupled plasma optical emission spectrometry (ICP-OES) using a UNICAM PU 700.The modified support and the final catalysts were characterized by N2 physisorption measurements at 77 K using a slightly modified Autosorb 1C setup (Quantachrome). Prior to the measurements, samples were degassed under vacuum for 2 h at 473 K. The specific surface areas were determined from the adsorption isotherms in the relative pressure (p/p0) range from 0.06 to 0.2 applying the BET method. The pore size distribution (PSD) was calculated from the nitrogen desorption branch using the BJH method considering the maximum of the PSD as the average pore size. The pore volume was considered as the volume of liquid nitrogen adsorbed at p/p0 ~ 1.
X-ray powder diffraction (XRD) patterns were recorded in the 2θ range from 10 to 70° (step width of 0.0308°) with a PANalytical MPD diffractometer using Cu-Kα radiation (λ = 1.5418 Å) at 45 kV and 40 mA, 0.58 divergent and anti-scatter slits, a 0.2 mm high receiving slit, 0.04 rad incident and diffracted beam soller slits, and a secondary graphite monochromator. Powder diffraction files (PDFs) from the International Centre of Diffraction Data (ICDD) combined with the X'Pert Line software (PANalytical, Almelo) were used for qualitative phase analysis.
Scanning electron microscopy (SEM) coupled with energy-dispersive X-ray spectroscopy (EDX) was applied for optical evaluation. Measurements of the powder materials were performed with a high resolution thermally aided field SEM (Zeiss, LEO1530 Gemini).
X-ray photoelectron spectroscopy (XPS) measurements were carried out in an ultra-high vacuum (UHV) set-up equipped with a monochromatic Al Kα X-ray source (hν = 1486.6 eV), operated at 14.5 kV and 35 mA, and a high resolution Gammadata-Scienta SES 2002 analyzer. The base pressure in the measurement chamber was maintained at about 7 × 10⁻¹⁰ mbar. The measurements were performed in the fixed transmission mode with a pass energy of 200 eV, resulting in an overall energy resolution better than 0.5 eV. A flood gun was applied to compensate the charging effects. High-resolution spectra of C 1s, O 1s, Al 2p and Co 2p were recorded. The binding energy scales were re-calibrated based on the C 1s line from adventitious hydrocarbon at 284.8 eV. Casa XPS software with a 70![[thin space (1/6-em)]](https://www.rsc.org/images/entities/char_2009.gif) :
:![[thin space (1/6-em)]](https://www.rsc.org/images/entities/char_2009.gif) 30 Gaussian–Lorentzian product function and Shirley background subtraction was used for peak deconvolution.
30 Gaussian–Lorentzian product function and Shirley background subtraction was used for peak deconvolution.
Temperature-programmed reduction (TPR) measurements were performed with a sample weight of approximately 0.2 g loaded in a U-shaped quartz reactor and pre-treated in flowing Ar (100 mL min−1) at 573 K for 1 h. After cooling, a 5% H2/Ar mixture flowing at 100 mL min−1 was applied while heating the sample to 1123 K with a heating rate of 5 K min−1. The hydrogen consumption was measured by a thermal conductivity detector. Subsequent to each TPR measurement, N2O reactive frontal chromatography (RFC) was performed applying a flow of 1% N2O in He probing both metallic Cu0 and Co0 surfaces.34
2.3 Catalytic testing
The catalytic measurements were performed in a high-pressure flow set-up consisting of a gas supply, a heatable glass-lined packed-bed microreactor with an inner diameter of 8 mm and a pressure controller (Dräger Tescom). The applied synthesis gas consisted of 39.71% CO (99.997% purity), 40.36% H2 (99.9999%), and 19.93% N2 (99.9999%). A total gas flow of 40 Nml min−1 was regulated by mass flow controllers (MFCs). The reactor was filled with 250 mg of the calcined catalyst and diluted with 400 mg of alumina in a sieve fraction of 250 to 355 μm. The oven temperature was controlled by a Eurotherm 2416. Furthermore, the gas line was heated to 393 K to avoid condensation of alcohols and water. Prior to each measurement, the catalysts were reduced in 100 Nml min−1 5% H2 in N2. The temperature was raised to 623 K (1 K min−1) and kept constant for 6 h. The reaction temperature was chosen to be 553 K and a pressure of 60 bar was applied. Online gas analysis was realized by using two isotherm operating gas chromatographs (GC, Shimadzu 14A, Shimadzu 8A) using a Porapak N column to determine light hydrocarbons, alcohols, CO2, and H2O as well as a Molsieve 5A column to determine N2, CO, and CH4.303. Results and discussion
3.1 The Cu–Co/MoO3/Al2O3 system
The compositions of the different samples determined by ICP are summarized in Table 1. The samples are denoted by the theoretical weight percentage of Cu and/or Co impregnated on the Mo-modified Al2O3 support.| Sample | Compositiona (wt%) | Specific surface areab (m2 g−1) | Pore diameterb (nm) | Pore volumeb (cm3 g−1) | |||
|---|---|---|---|---|---|---|---|
| Al | Mo | Cu | Co | ||||
| a Determined by ICP. b Determined by N2 physisorption using the BET and BJH methods. | |||||||
| 12Cu/(Mo/Al) | 32.9 | 7.2 | 12.3 | — | 139 | 4 | 0.22 |
| 8Cu–4Co/(Mo/Al) | 32.6 | 6.7 | 8.4 | 3.9 | 163 | 5 | 0.22 |
| 6Cu–6Co/(Mo/Al) | 32.3 | 6.5 | 6.0 | 5.3 | 129 | 4 | 0.10 |
| 4Cu–8Co/(Mo/Al) | 33.1 | 6.9 | 3.8 | 7.1 | 189 | 6 | 0.28 |
| 12Co/(Mo/Al) | 31.9 | 7.8 | — | 10.3 | 131 | 4 | 0.20 |
The nature of the isotherm of nitrogen adsorption and desorption for pure Al2O3 was found to be type IV with an H1 hysteresis loop and confirms the mesoporosity of alumina.27 The Al2O3 sample exhibited a specific surface area of about 300 m2 g−1 with a maximum pore diameter of about 6.8 nm. After deposition of the MoO3 layer, the specific surface area decreased to 267 m2 g−1. A further decrease is observed after impregnation of the Mo-modified alumina with the respective amounts of Cu and/or Co (Table 1). Although the values differ, no clear trend with respect to the metal loading is found. In general, half of the specific surface area of pure Al2O3 was retained after the subsequent two deposition steps. As the decrease in the specific surface area is accompanied by a decrease in the pore volume and diameter, it is assumed that MoO3 as well as Co and Cu oxides mainly coat the inner surface of the alumina support.
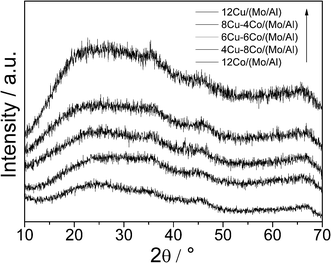
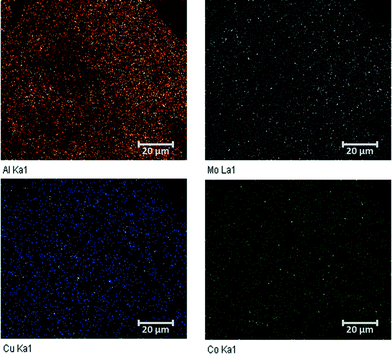
The bulk structure of the Cu–Co/(Mo/Al) samples was investigated by powder X-ray diffraction (Fig. 1). All samples show very broad and diffuse patterns typical for non-crystalline X-ray amorphous materials. The increasing background intensity with increasing Cu content is due to the fluorescence caused by the interactions between Cu and the applied Cu-Kα radiation. Significant reflexes of Mo, Cu or Co oxides are not observed, indicating small primary particles and a high degree of dispersion. The homogeneous dispersion of the metal components is confirmed by elemental mapping applying EDX (Fig. 2).
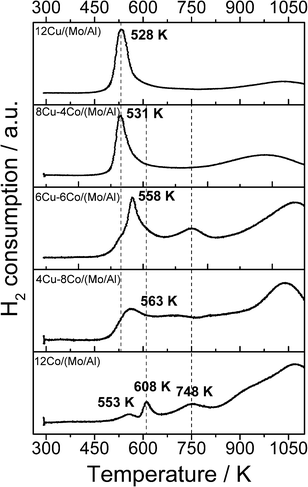
Activation of the catalyst prior to HAS is regarded as one crucial step in terms of active site formation. The reduction behavior of the different samples was investigated by TPR (Fig. 3). Sample 12Cu/(Mo/Al) shows a sharp reduction signal at relatively low temperatures, which can be assigned to the reduction of CuO. By analyzing the H2 consumption in this temperature range, complete Cu reduction is confirmed. Further H2 consumption at high temperatures originates from the reduction of MoO3. As the TPR set-up is limited to a maximum temperature of 1123 K, MoO3 reduction is not completed. Calculations based on the H2 consumption indicate that approximately 80% of MoO3 is reduced under the applied TPR conditions. With increasing Co amount (decreasing Cu) the reduction profile appears much broader and distributed over the whole temperature range. The profile of sample 12Co/(Mo/Al) displays the typical stepwise reduction of Co3O4 to Co0.35,36 Due to the strong overlap for the Co-containing samples, precise deconvolution of the single signals is not possible. However, by analyzing the overall H2 consumption, assuming complete reduction of CuO and 80% reduction of MoO3, the degree of Co reduction can be estimated (Table 2). Although it is just a rough approximation, the values indicate that the degree of Co reduction decreases with decreasing amount of Cu. This observation is explained by a spill-over effect: reduced Cu0 nanoparticles formed at lower temperatures adsorb hydrogen dissociatively and facilitate the reduction of the neighboring cobalt oxide.37 Incomplete Co reduction is assumed to be caused by the formation of a CoAl2O4 spinel phase, which requires temperatures higher than 1000 K to be reduced to Co0. However, TPR measurements of a Co/Al2O3 sample prepared by a similar impregnation method revealed that only 22% of the cobalt was reduced due to severe spinel formation. The comparison with 58% Co reduction for the 12Co/(Mo/Al) sample confirms that the partial coating of the Al2O3 surface with MoO3 resulted in reduced formation of the unwanted spinel phase.
| Sample | Molar composition (mmol g−1) | H2 consumptiona (mmol g−1) | Degree of Co reductionb (%) | ||
|---|---|---|---|---|---|
| Cu | Co | Mo | |||
| a Determined by TPR. b Assuming complete CuO reduction and 80% MoO3 reduction; Co present as Co3O4. | |||||
| 12Cu/(Mo/Al) | 1.9 | — | 0.8 | 3.63 | — |
| 8Cu–4Co/(Mo/Al) | 1.3 | 0.8 | 0.7 | 3.88 | 98.9 |
| 6Cu–6Co/(Mo/Al) | 1.0 | 0.9 | 0.7 | 3.54 | 79.9 |
| 4Cu–8Co/(Mo/Al) | 0.6 | 1.2 | 0.7 | 3.35 | 64.2 |
| 12Co/(Mo/Al) | — | 1.8 | 0.8 | 3.31 | 58.5 |
Although the samples were prepared by sequential deposition of Mo, Cu and Co oxide on Al2O3, the surface composition revealed by XPS differs significantly from what is expected (Table 3). All samples show a surface enrichment of Mo compared to the bulk composition. The surface Cu/Co ratios for samples 8Cu–4Co/(Mo/Al) and 4Cu–8Co/(Mo/Al) are almost equal to the respective bulk values. However, the Cu/Co ratio is significantly decreased for sample 6Cu–6Co/(Mo/Al) with respect to the expected bulk composition. The surface composition of this sample equals that of sample 4Cu–8Co/(Mo/Al), which is further confirmed by the estimated N2O consumption during RFC measurements. The values clearly correlate with the Cu content of the surface rather than with the bulk Cu amount.
| Sample | Surface compositiona (at%) | (Cu + Co)/Mo ratio | Cu/Co ratio | N2O consumption (mmol g−1) | ||||
|---|---|---|---|---|---|---|---|---|
| Cu | Co | Mo | Surface | Bulk | Surface | Bulk | ||
| a Determined by XPS. | ||||||||
| 12Cu/(Mo/Al) | 2.5 | — | 2.0 | 1.3 | 2.6 | — | — | 0.192 |
| 8Cu–4Co/(Mo/Al) | 1.7 | 0.8 | 1.9 | 1.3 | 2.8 | 2.2 | 2.0 | 0.122 |
| 6Cu–6Co/(Mo/Al) | 0.7 | 1.3 | 1.8 | 1.2 | 2.7 | 0.5 | 1.0 | 0.054 |
| 4Cu–8Co/(Mo/Al) | 0.7 | 1.4 | 1.8 | 1.1 | 2.5 | 0.5 | 0.5 | 0.051 |
| 12Co/(Mo/Al) | — | 1.4 | 1.7 | 0.8 | 2.2 | — | — | 0.033 |
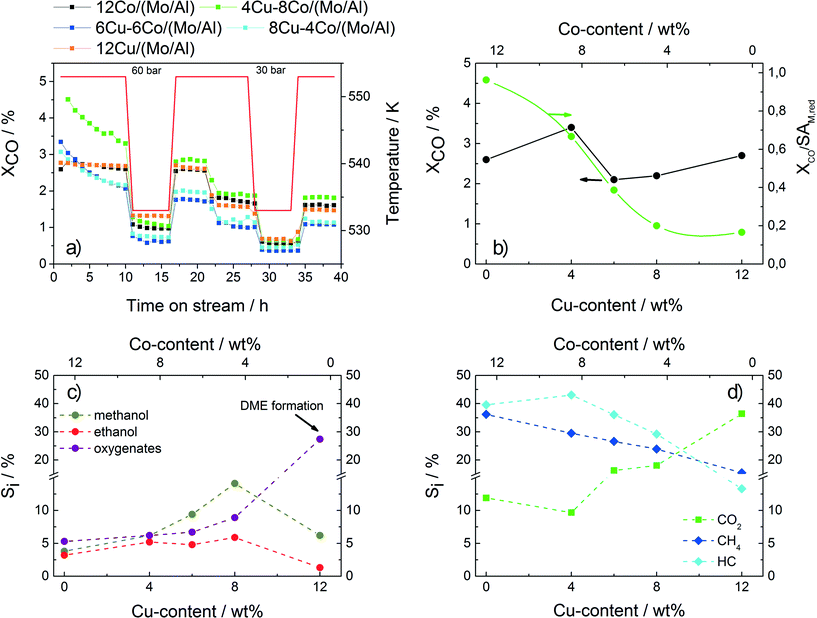
Fig. 4a shows the CO conversion of the different samples applied in HAS following the described test procedure as a function of time on stream. While strong deactivation is observed for the bimetallic samples during the first 10 h, the pure Cu and Co catalysts show constant conversion values. The overall conversion values obtained after 35 h of TOS do not follow a clear trend with respect to the catalyst composition. However, with increasing Cu content a decrease in the intrinsic conversion, which relates the overall conversion to the accessible metallic surface area revealed by N2O-RFC, is observed (Fig. 4b). The high intrinsic conversion value of the 12Co/(Mo/Al) sample is explained by the Fischer–Tropsch activity confirmed by the high selectivity to methane and hydrocarbons and relatively low oxygenate selectivity (Fig. 4c–d, Table 4). With increasing Cu content, the catalytic properties of the samples shift from FT-like toward methanol synthesis. An increase in the oxygenate selectivity is observed with methanol being the most prominent compound, while the selectivities to methane and other hydrocarbons are gradually decreasing. The increasing CO2 selectivity is explained by an increasing shift activity with increasing Cu amount. Sample 12Cu/(Mo/Al) shows a clear drop in the selectivity to methanol and ethanol due to increased ether formation caused by acid sites on the catalysts. Again, this result shows that the mesoporous Al2O3 support is not completely coated with the less acidic MoO3, resulting in enhanced ether formation. With decreasing temperature or pressure, all samples show lower conversion values, while the overall product distribution is retained (not shown). The highest selectivity to ethanol and other oxygenates is obtained for sample 8Cu–4Co/(Mo/Al). Further investigations and optimization are based on this Cu/Co ratio.
| Sample | XCO (%) | S i (%) | |||||
|---|---|---|---|---|---|---|---|
| CO2 | MeOH | EtOH | Oxya | CH4 | HCb | ||
| a Alcohols with carbon numbers of 3–6 (mainly 1-propanol, 1-butanol, 1-pentanol, 2-propanol). b Hydrocarbons with carbon numbers of 2–8 (linear alkanes and alkenes). | |||||||
| 12Cu/(Mo/Al) | 2.7 | 36.6 | 6.2 | 1.2 | 25.6 | 15.9 | 14.5 |
| 8Cu–4Co/(Mo/Al) | 2.2 | 16.7 | 12.8 | 5.7 | 8.2 | 24.4 | 32.3 |
| 6Cu–6Co/(Mo/Al) | 2.1 | 15.6 | 8.0 | 4.6 | 6.5 | 26.3 | 38.3 |
| 4Cu–8Co/(Mo/Al) | 3.4 | 9.2 | 5.2 | 4.8 | 7.4 | 29.3 | 44.1 |
| 12Co/(Mo/Al) | 2.6 | 13.9 | 3.4 | 2.9 | 5.0 | 37.5 | 37.3 |
3.2 Influence of the Mo loading
In order to confirm the beneficial effect of MoO3 coating, TPR measurements with catalysts prepared by deposition of Cu and Co on the unmodified alumina support were performed (not shown). Analysis of the detected H2 consumption revealed a degree of Co reduction of approximately 34%, which is slightly higher compared with the value of 22% obtained for the Co/Al2O3 sample, demonstrating the beneficial effect of Cu (spillover effect). However, this value is still rather low, confirming severe spinel formation. As the chosen reduction temperature for the activation of the catalyst prior to the catalytic test is only 623 K, the insufficient reduction of the active phase for Cu–Co/Al2O3 resulted in a poor catalyst for CO hydrogenation. In contrast, coating of the alumina support with MoO3 resulted in significantly higher degrees of reduction caused by suppressed spinel formation, leading to suitable catalytic performance of the catalysts applied in HAS.The results of the sample with Cu–Co deposited on Mo-modified Al2O3 indicate that the alumina surface was not completely covered with MoO3. The high reduction temperature for samples with high Co loading as well as the XPS measurements revealed the formation of the undesired CoAl2O4 spinel phase. Therefore, additional samples with two and threefold Mo loadings were prepared and impregnated with the active metals, achieving a Cu![[thin space (1/6-em)]](https://www.rsc.org/images/entities/char_2009.gif) :
:![[thin space (1/6-em)]](https://www.rsc.org/images/entities/char_2009.gif) Co molar ratio of 2
Co molar ratio of 2![[thin space (1/6-em)]](https://www.rsc.org/images/entities/char_2009.gif) :
:![[thin space (1/6-em)]](https://www.rsc.org/images/entities/char_2009.gif) 1. Table 5 summarizes the specific surface areas of the samples compared with the pure support. A strong decrease in the specific surface area is observed with increasing Mo loading due to the covering of the inner surface of the alumina support.
1. Table 5 summarizes the specific surface areas of the samples compared with the pure support. A strong decrease in the specific surface area is observed with increasing Mo loading due to the covering of the inner surface of the alumina support.
| Sample | Specific surface area (m2 g−1) | Pore diameter (nm) |
|---|---|---|
| Al2O3 | 300 | 6–7 |
| 1MoO3/Al2O3 | 267 | 4–5 |
| 8Cu–4Co/(1Mo/Al) | 163 | 5 |
| 8Cu–4Co/(2Mo/Al) | 95 | 4 |
| 8Cu–4Co/(3Mo/Al) | 30 | 3–4 |
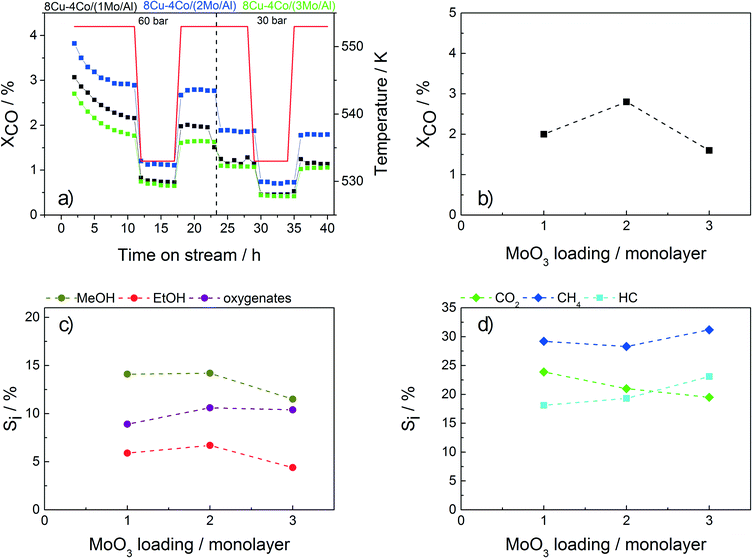
The test results for the catalysts with different Mo loadings applied in HAS are shown in Fig. 5. The conversion shows a small maximum for sample 8Cu–4Co/(2Mo/Al). The initial increase in conversion with higher loading is assumed to be caused by a higher coverage of the alumina surface with MoO3, leading to decreased spinel formation and thus a higher amount of reduced active metal species. By further increasing the Mo loading, the surface area drops resulting in a lower degree of dispersion and thus a lower overall activity.
Besides the mere physically effect of covering the alumina surface, an additional catalytic influence of Mo in HAS is observed. This promoting effect was recently investigated by de Jongh and coworkers combining the experimental and theoretical results obtained with CuCo/MoOx catalysts.22 A pronounced reducibility of Cu and Co in the presence of Mo was found, leading to enhanced formation of a Cu–Co alloy, which is considered the active phase in HAS over Cu–Co catalysts. Interestingly, a promoting effect is also clearly visible for samples 12Cu/(Mo/Al) and 12Co/(Mo/Al) containing only copper or cobalt, respectively (Table 4). On the one hand, for the pure Cu sample significant amounts of methane, higher hydrocarbons and C2+ oxygenates are observed in addition to the expected product methanol. On the other hand, methanol and other oxygenates are formed on the pure Co catalyst in addition to the typical Fischer–Tropsch products. These results indicate the synergetic interaction of Mo with Cu and Co, respectively, leading to a broad product distribution.
Additionally, a change in selectivity is observed by varying the Mo loading (Fig. 5c–d). While the amounts of MeOH, EtOH and CH4 are decreasing, a slight increase in the selectivities to C2+ oxygenates, hydrocarbons and CO2 with increasing Mo content is observed. However, for further optimization the sample containing the twofold amount of Mo is chosen as it shows the highest conversion together with a sufficient selectivity to ethanol.
3.3 Magnesium modification
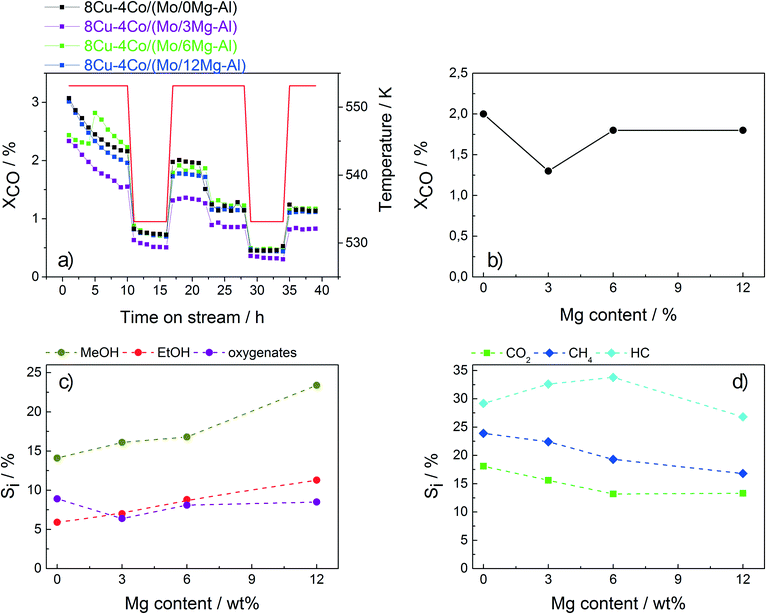
Although Rh has a significant catalytic effect in HAS, it is economically not feasible in terms of large-scale catalyst manufacturing. Therefore, suitable alternative materials based on less expensive metals have to be developed. For this purpose, Mg-modified alumina was prepared and used as a support for the Cu–Co catalyst applied in HAS. Magnesium has a strong tendency to form a MgAl2O4 spinel phase. Thus, the support is saturated to a certain extent resulting in less CoAl2O4 spinel formation. Moreover, the incorporation of Mg introduces basicity to the support, which is assumed to reduce methane formation and enhance oxygenate selectivity.38–40Three different Mg–Al materials were prepared containing 3, 6 and 12 wt% Mg, respectively, and used as supports. The overall compositions of the respective final catalysts are summarized in Table 6. The catalysts were tested in HAS and the results were compared to those obtained for the sample without Mg (Fig. 6).
The overall conversion is not affected by the Mg content of the support. However, a significant influence on the product distribution is observed. With increasing Mg content, the selectivities to CH4 and also CO2 decrease. While the amounts of C2+ oxygenates and hydrocarbons almost remain constant, the selectivity to ethanol (together with methanol) is significantly increased for the catalyst containing 12 wt% Mg. With a value of almost 11%, this catalyst exhibits by far the highest ethanol selectivity of all catalysts investigated in the present study. These preliminary results suggest that Mg modification is a promising tool for further optimization of Cu–Co-based catalysts applied in HAS.
4. Conclusions
Alkali-free Cu–Co-based model catalysts were prepared and successfully applied in HAS. By deposition of MoO3 onto the alumina surface, a support was obtained providing both high specific surface area and enhanced interaction with the active metal species. The formation of the unwanted CoAl2O4 spinel phase was reduced leading to increased activity of the catalyst.The degree of CO conversion and the product distribution were strongly affected the Cu/Co ratio. Moreover, MoO3 was not only found to provide enhanced interaction between the active sites and the support, but it was also found to function as a chemical promoter significantly influencing the performance of the catalyst.
The alcohol selectivity was further increased by the modification of the alumina support by incorporation of basic Mg2+ cations. These results clearly indicate the presence of strong metal–support interactions in Cu–Co-based catalysts for HAS.
Acknowledgements
The authors acknowledge their partners from the BETSY project (“Bio-Ethanol from Synthesis Gas”) funded by the Ministry for Economy, Energy, Building, Habitation and Transportation of North Rhine-Westphalia within the program Ziel2.NRW financed by the European Union through the European regional development fund (ERDF) for the fruitful collaboration.References
- K. J. Smith and R. B. Anderson, J. Catal., 1984, 85, 428–436 CrossRef CAS.
- K. J. Smith and R. B. Anderson, Can. J. Chem. Eng., 1983, 61, 40–45 CrossRef CAS.
- X. Pan, Z. Fan, W. Chen, Y. Ding, H. Luo and X. Bao, Nat. Mater., 2007, 6, 507–511 CrossRef CAS PubMed.
- B. O. Palsson, S. Faith-Afshar, D. F. Rudd and E. N. Lightfoot, Science, 1981, 213, 513–517 CAS.
- T. K. Ng, R. M. Busche, C. C. McDonald and R. W. Hardy, Science, 1983, 219, 733–740 CAS.
- J. J. F. Scholten and X. Xiaoding, in Progress in Synthetic Fuels, ed. G. Imarisio and J. M. Bemtgen, Graham & Trotman Limited, 1988, pp. 73–80 Search PubMed.
- M. Z. F. Kamarudin, S. K. Kamarudin, M. S. Masdar and W. R. W. Daud, Int. J. Hydrogen Energy, 2013, 38, 9438–9453 CrossRef CAS.
- P. Gronchi, E. Tempesti and C. Mazzocchia, Appl. Catal., A, 1994, 120, 115–126 CrossRef CAS.
- J. J. Spivey and A. Egbebi, Chem. Soc. Rev., 2007, 36, 1514–1528 RSC.
- V. Subramani and S. K. Gangwal, Energy Fuels, 2008, 22, 814–839 CrossRef CAS.
- M. Muhler and S. Kaluza, in Fuel Production with Heterogeneous Catalysis, ed. J. Sá, CRC Press Taylor & Francis Group, 2014, pp. 169–192 Search PubMed.
- A. Sugier and E. Freund, IFP, US4122110, 1978 Search PubMed.
- P. Courty, D. Durand, E. Freund and A. Sugier, J. Mol. Catal., 1982, 17, 241–254 CrossRef CAS.
- A. Kiennemann, P. Chaumette, B. Ernst, J. Saussey and J. C. Lavalley, Stud. Surf. Sci. Catal., 1997, 107, 55–62 CrossRef CAS.
- S. Velu, K. Suzuki, S. Hashimoto, N. Satoh, F. Ohashi and S. Tomura, J. Mater. Chem., 2001, 11, 2049–2060 RSC.
- N. Tien-Thao, H. Alamdari and S. Kaliaguine, J. Solid State Chem., 2008, 181, 2006–2019 CrossRef.
- X. Dong, X.-L. Liang, H.-Y. Li, G.-D. Lin, P. Zhang and H.-B. Zhang, Catal. Today, 2009, 147, 158–165 CrossRef CAS.
- Y. Xiang, V. Chitry, P. Liddicoat, P. Felfer, J. Cairney, S. Ringer and N. Kruse, J. Am. Chem. Soc., 2013, 135, 7114–7117 CrossRef CAS PubMed.
- N. Mouaddib, V. Perrichon and G. A. Martin, Appl. Catal., A, 1994, 118, 63–72 CrossRef CAS.
- N. D. Subramanian, G. Balaji, C. S. S. R. Kumar and J. J. Spivey, Catal. Today, 2009, 147, 100–106 CrossRef CAS.
- Y. Xiang, V. Chitry, P. Liddicoat, P. Felfer, J. Cairney, S. Ringer and N. Kruse, J. Am. Chem. Soc., 2013, 135, 7114–7117 CrossRef CAS PubMed.
- G. Prieto, S. Beijer, M. L. Smith, M. He, Y. Au, Z. Wang, D. A. Bruce, K. P. de Jong, J. J. Spivey and P. E. de Jongh, Angew. Chem., Int. Ed., 2014, 53, 6397–6401 CrossRef CAS PubMed.
- S. Sun, K. Fujimoto, Y. Zhang and N. Tsubaki, Catal. Commun., 2003, 4, 361–364 CrossRef CAS.
- B. A. Sexton, A. E. Hughes and T. W. Turney, J. Catal., 1986, 97, 390–406 CrossRef CAS.
- A. Lapidus, A. Krylova, V. Kazanskii, V. Borovkov and A. Zaitsev, Appl. Catal., A, 1991, 73, 65–81 CrossRef CAS.
- P. Yang, D. Zhao, D. I. Margolese, B. F. Chmelka and G. D. Stucky, Nature, 1998, 396, 152–154 CrossRef CAS.
- A. Bordoloi, M. D. Sanchez, H. Noei, S. Kaluza, D. Großmann, Y. Wang, W. Grünert and M. Muhler, J. Catal., 2014, 807545 Search PubMed.
- D. Grosso, F. Cagnol, G. J. de, A. A. Soler-Illia, E. L. Crepaldi, H. Amenitsch, A. Brunet-Bruneau, A. Bourgeois and C. Sanchez, Adv. Funct. Mater., 2004, 14, 309–322 CrossRef CAS.
- P. Arnoldy and J. A. Moulijin, J. Catal., 1985, 93, 38–54 CrossRef CAS.
- J. Anton, H. Ruland, S. Kaluza and M. Muhler, Catal. Lett., 2015 DOI:10.1007/s10562-015-1543-2.
- S. M. Morris, P. F. Fulvio and M. Jaroniec, J. Am. Chem. Soc., 2008, 130, 15210–15216 CrossRef CAS PubMed.
- G. Shi, T. Franzke, W. Xia, M. D. Sanchez and M. Muhler, Chem. Vap. Deposition, 2011, 17, 162–169 CrossRef CAS.
- M. Matzapetakis, M. Dakanali, C. P. Raptopoulou, V. Tangoulis, A. Terzis, N. Moon, J. Giapintzakis and A. Salifoglou, J. Biol. Chem., 2000, 5, 469–474 CAS.
- O. Hinrichsen, T. Genger and M. Muhler, Chem. Eng. Technol., 2000, 23, 956–959 CrossRef CAS.
- A. Lycourghiotis, Stud. Surf. Sci. Catal., 1983, 16, 343–357 CrossRef CAS.
- S. Ribet, D. Tichit, B. Coq, B. Ducourant and F. Morato, J. Solid State Chem., 1999, 142, 382–392 CrossRef CAS.
- L. Guczi, G. Boskovic and E. Kiss, Catal. Rev.: Sci. Eng., 2010, 52, 133–203 CAS.
- Y. Zhang, H. Xiong, K. Liew and J. Li, J. Mol. Catal. A: Chem., 2005, 237, 172–181 CrossRef CAS.
- J. A. Biscardi and E. Iglesia, J. Catal., 1999, 182, 117128 CrossRef.
- A.-M. Hilmen, M. Xu, M. J. L. Gines and E. Iglesia, Appl. Catal., A, 1998, 169, 355–372 CrossRef CAS.
| This journal is © The Royal Society of Chemistry 2015 |

