
 Open Access Article
 This Open Access Article is licensed under a
 Creative Commons Attribution 3.0 Unported Licence
Testing the transferability of a coarse-grained model to intrinsically disordered proteins
Gil O.
Rutter
a,
Aaron H.
Brown
bc,
David
Quigley
*d,
Tiffany R.
Walsh
c and
Michael P.
Allen
ae
aDepartment of Physics, University of Warwick, Coventry CV4 7AL, UK
bDepartment of Chemistry and Centre for Scientific Computing, University of Warwick, Coventry, CV4 7AL, UK
cInstitute for Frontier Materials, Deakin University, Geelong, VIC 3216, Australia
dDepartment of Physics and Centre for Scientific Computing, University of Warwick, Coventry CV4 7AL, UK. E-mail: D.Quigley@warwick.ac.uk
eH. H. Wills Physics Laboratory, Royal Fort, Tyndall Avenue, Bristol BS8 1TL, UK
First published on 5th November 2015
Abstract
The intermediate-resolution coarse-grained protein model PLUM [T. Bereau and M. Deserno, J. Chem. Phys., 2009, 130, 235106] is used to simulate small systems of intrinsically disordered proteins involved in biomineralisation. With minor adjustments to reduce bias toward stable secondary structure, the model generates conformational ensembles conforming to structural predictions from atomistic simulation. Without additional structural information as input, the model distinguishes regions of the chain by predicted degree of disorder, manifestation of structure, and involvement in chain dimerisation. The model is also able to distinguish dimerisation behaviour between one intrinsically disordered peptide and a closely related mutant. We contrast this against the poor ability of PLUM to model the S1 quartz-binding peptide.
1 Introduction
1.1 Intrinsically disordered proteins
Intrinsically disordered proteins and peptides (IDPs) are amino acid sequences which lack a static and stable native structure, and therefore differ from classical ordered proteins. IDPs are abundant in nature and often derive function from their disorder.1 IDPs are defined by their inability to fold into a unique and stable tertiary structure, and this term is preferable to the early term IUPs (intrinsically unstructured proteins) which falsely suggests a complete lack of structure.2Despite the presence of intrinsic disorder in 15–45% of eukaryotic proteins,3 the study of IDPs is a nascent field. The classical structure–function paradigm of proteins emerged from the proposition that protein denaturation is purely a conformational change,4 and states that 3D protein structure determines its function, therefore, all functional proteins require a stable native state. The cataloguing of thousands of functional native protein structures during the rest of the 20th century5 solidified the notion of 3D structure being a prerequisite of function.
Although evidence of conformational adaptability6,7 and functional disordered regions (numerous examples cited in ref. 8) appeared during the second half of the 20th century, it took until the turn of the millennium for researchers to formally argue for function in natively disordered proteins,9–12 thereby casting doubt on the universality of the structure–function paradigm.
Recent progress in the field of IDPs includes bioinformatic disorder prediction algorithms approaching 90% accuracy,13 assignment of IDP function to four broad categories2 and myriad experimental3,14–16 and atomistic simulation17–22 studies of specific IDPs.
Most popular coarse-grained protein models include a bias towards a native structure by including terms describing interactions between backbone atoms, as in ‘Gō-like’ models,23 or by fixing the secondary structure as in MARTINI and others.24–26 These approaches render a model inadequate for studying conformational changes of secondary structure. By the same token, this is not a suitable coarse-graining approach for IDPs. Conversely, models which give an almost all-atom description of the backbone by modelling each of Cα, C′ and N explicitly can aim to sample secondary structure organically, thus offering a better hope of understanding IDPs.27–31 PLUM27,32 is one such model, and the present work examines its ability to realistically simulate a class of IDPs involved in biomineralisation.
1.2 Biomineralisation and the n16N peptide
Biomineralisation is the process of mineral formation in controlled environments by living organisms. Biomineralisation can occur in an extracellular environment, where it is regulated by a macromolecular complex33–35 comprising proteins, polysaccharides or glycoproteins,36 with high levels of disorder. Indeed, biomineralisation proteins have been called the most disordered functional class in the protein world.37 The function of molecular assembly, required of complex-forming proteins, may benefit greatly from disorder. Complexes may assemble in multiple stages, making use of conformational adaptability to refold and to overcome steric barriers. Additionally, IDPs could exhibit selectivity over the chemical environment in which assembly is possible.38n16 is a family of 108AA (amino acid chain length) “aragonite promoter” proteins,39,40 named after their presence in nacre and their molecular weight in kDA. 23 polymorphic variants have been identified, all actively expressed in pearl oyster (pinctada fucata),41 while homologues of n16 have been found in other molluscs.42–44
The 30AA N-terminal sequence of n16 shown in Fig. 1, named n16N, has been studied experimentally in some detail45–53 and has been called “the key self-assembly/aragonite forming domain”.53 The addition of a β-chitin substrate, an extremely abundant polymer with a rigid crystalline structure which is present in the in vivo system,54 has been shown to enhance n16 and n16N's biomineralisation activity.49,51,55 An atomistic simulation study of n16N under aqueous conditions, using the Replica Exchange with Solute Tempering (REST)56,57 approach, provides a basis for comparison with work carried out with coarse-grained models.58 The ability of the REST approach to access observables that are otherwise challenging to obtain from molecular simulation was recently demonstrated with the near-reproduction of the experimentally determined binding free energy of the AuBP1 peptide adsorbed at the aqueous Au interface.59
 | ||
| Fig. 1 Amino acid sequence of the 30AA N-terminal region of n16, called n16N. An ellipsis indicates where the full n16 sequence continues, and braces indicate suggested subdomains,58 summarised in Table 1. Cationic amino acid residues shown in bold blue, anionic residues shown in bold red. | ||
n16N subdomains with the capacity to perform different functions in the context of the three-component n16N/β-chitin/calcium carbonate system have been proposed.58,60 These are described in Table 1 and shown in Fig. 1. SD1 and SD2 are rich in tyrosine residues, which are hypothesised to have roles in intra- and inter-peptide stabilisation via ring–ring and hydrogen bond interactions, and lead to SD1 and SD2 being less flexible than SD3. SD3 is a highly charged region which may be the mineral assembly subdomain; the mechanism of ion capture, by such a flexible, charged polymer chain, has been termed “fly-casting”.61
| Name | Residue indices | Notes |
|---|---|---|
| SD1 | 1 to 8 | Tentative role in Y-mediated β-chitin binding. Intrapeptide stabilisation. |
| SD2 | 9 to 16 | Clustering role due to interpeptide Y–Y interactions.60 β-Sheet forming capacity.62 Intrapeptide stabilisation. |
| SD3 | 17 to 30 | Greatest conformational accessibility, highly charged; proposed “fly-casting” mechanism in ion capture.61 |
A mutant of n16N referred to as n16NN is produced by mutating the acidic residues with their charge-neutral counterparts (Asp → Asn, Glu → Gln). This greatly hampers the aragonite selectivity of the peptide.49,51 It is confirmed that Asp and Glu do have an active role in organic–mineral association48 and that these substitutions abolish n16N's ability to form complexes with Ca2+.47 n16NN has been shown to self-assemble in an aberrant manner47 or not at all,50 suggesting that a simulation without mineral ions may suffice to reveal significant differences between n16N and this mutant.
In the present work, systems of n16N and n16NN will be simulated in one-unit and two-unit systems in order to evaluate PLUM's applicability to this IDP. As we cannot expect models at this resolution to provide new insight into the specific chemical nature of inter-peptide stabilisation, we limit our analysis to the ability of PLUM's effective interactions to correctly capture secondary structure statistics.
1.3 The S1 peptide and the proline residue
S1 is a bioinformatics-designed 12AA peptide, named as a contraction of ‘strong-binder one’, after its place as the first peptide designed by its authors to bind strongly to quartz.63 Circular dichroism (CD) spectral analysis of the peptide is indicative of a significant degree of polyproline II character, and this result was replicated by atomistic replica exchange molecular dynamics (REMD) simulation of the peptide in solution.64 The sequence of S1 is| PPPWLPYMPPWS. |
Proline (P) is a unique residue. Its side-chain is bonded cyclically to both the Cα and N backbone atoms, in a 5-membered ring. This makes the side-chain's structural properties unique, limiting the ϕ dihedral angle to approximately −60°, removing the preference for trans-isomerisation, and preventing the residue's nitrogen from participating in hydrogen bonding.
The PLUM model features a proline residue which cannot hydrogen bond through its nitrogen and has its own ω dihedral angular potential which is bimodal, facilitating both trans- and cis-isomerisation. However, there are no further provisions. In particular, the polyproline II structure is stabilised by P–P side-chain interactions, while the PLUM model is developed for the more common case of steric inhibition and hydrogen bonding being the main drivers of secondary structure.27 We include S1 within our testing to assess the limitations of the PLUM model in this context.
2 Methods
The implicit-solvent PLUM model, introduced by Bereau and Deserno,27 is designed to model protein folding and aggregation. Its goal is to be predictive where the protein structure is “not known, not well defined, strongly perturbed from the native state, or adjusts during aggregation events”.27 The PLUM model represents the backbone with near-atomistic resolution, with beads for NH, CαH and C′O united atoms. NH and C′O beads can hydrogen bond through a directional potential which depends on implicit positions of hydrogen and oxygen atoms within these beads. The side-chains are represented by single beads interacting via a simple hydrophobic scale, which may also capture other effects, based on previous crystal structure work.65Simulations of this model were carried out in the LAMMPS simulation package66 (http://lammps.sandia.gov), modified to support PLUM-specific pair potentials. All interaction parameters were taken from Bereau and Deserno's original PLUM paper.27 A timestep size of 3 fs was used and a Langevin thermostat was applied with damping parameter 1000 fs. We stress that the unit of time in PLUM and other coarse-grained models is not well-defined. The notional time units used here are calculated in terms of the energy, mass and length scales defined by the model. However these do not map directly onto real time and should be considered a measure of sample size only.
In order to extensively sample the ensemble of conformations available to each peptide, we employ the enhanced sampling technique replica exchange molecular dynamics (REMD).67,68 REMD simulations have M non-interacting systems with the same Hamiltonian, in heat baths at a range of temperatures. The highest temperatures have the greatest ability to overcome potential energy barriers. By regularly proposing swaps of coordinates and scaling of momenta between replicas, and accepting these proposals according to the Metropolis prescription, the enhanced sampling at the highest temperatures can propagate to the lower-temperature ensembles without violating canonical ensemble statistics.69 In the current work, we verify sufficient sampling of the whole temperature range by measuring the average round trip time across the range and ensuring the simulation time is far greater.
We use a clustering analysis to group geometrically similar conformations, producing a list of clusters ranked by their frequency of occurrence over the course of a trajectory. The g_cluster tool, available as part of the Gromacs package,70–72 and the gromos clustering algorithm,73 were used. Structures are candidates for grouping if they fall within a specified cut-off limit measuring the root-mean-square deviation (RMSD) between their atomic positions. The RMSD cut-off is a chosen parameter whose best value depends on the goal of the analysis and the system being studied, with larger systems generally requiring a larger cut-off to group similar manifestations of structure. Full chains of n16N or n16NN were analysed with a cut-off of 0.4 nm. Two-chain systems used a cut-off of 0.6 nm. Region-wise cluster analyses were carried out on the chain for residues 1 to 8, 9 to 16 and 23 to 30 with an RMSD cut-off of 0.2 nm. These residue ranges were deliberately equal-length representations of SD1, SD2 and SD3, defined in Table 1. ‘Core’ regions of the two-chain system, used in Section 3.4, had a cut-off of 0.3 nm, and consisted of the regions representing SD1 and SD2. In all cases, backbone atom positions were used for analysis, without side-chain beads.
Cartoon-style images of peptide conformations were produced in the NGL viewer74 for the single-chain system and the VMD viewer75 for the two-chain systems. As standard automatic structure-identifying algorithms cannot be applied to PLUM model proteins, the SABBAC76 online tool was used for the monomer, and manual assignment based on backbone dihedral angles and hydrogen bonding was used for the dimers.
3 Results
3.1 Overstabilisation of the α-helix in the original PLUM model
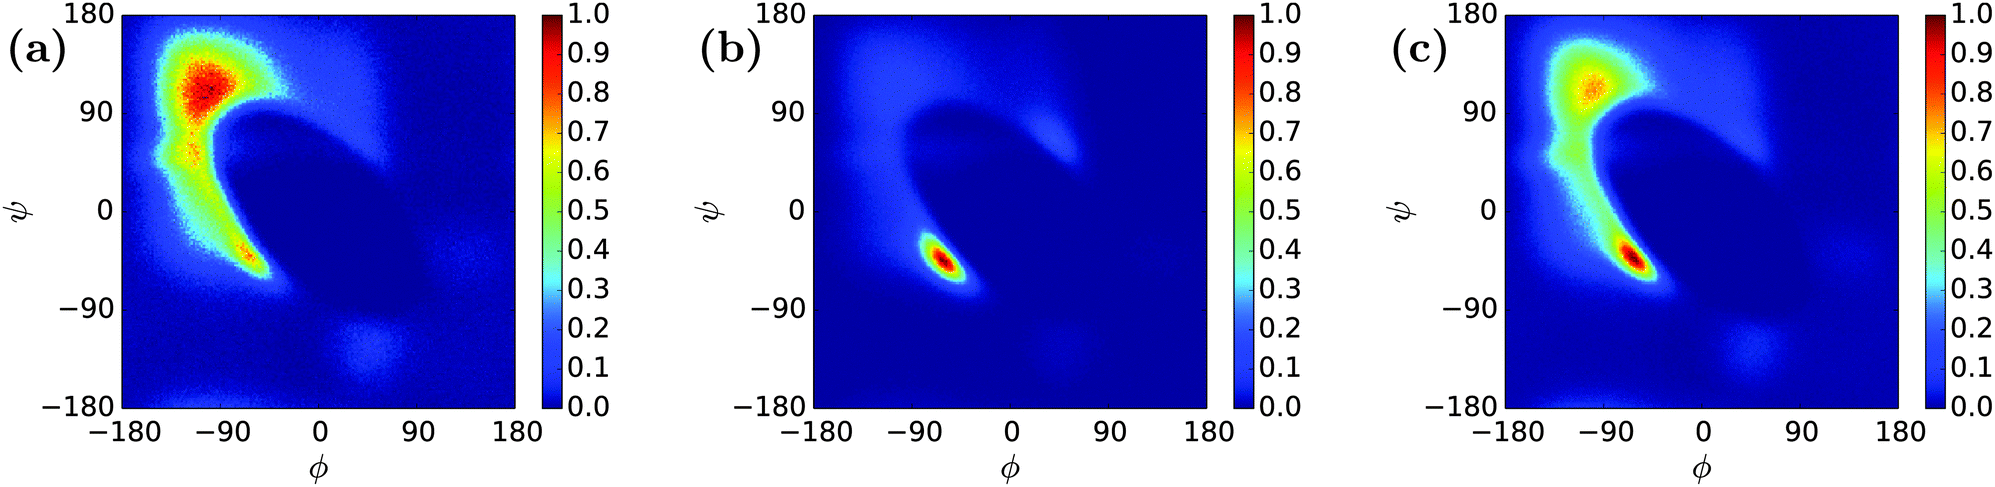
A REMD simulation of the intrinsically disordered n16N peptide was carried out with 16 replicas, each running for 8.5 μs, in the PLUM model. The replicas were thermostatted at Ti ∈ {275.0, 280.0, 285.0, 290.0, 300.0, 305.0, 307.5, 310.0, 312.5, 315.0, 317.5, 320.0, 325.0, 330.0, 340.0, 350.0} K.The data collected at 300.0 K were analysed. Based on comparison to available atomistic data,58 the simulation showed marked over-stabilisation of the α-helix secondary structural motif over the entire length of the chain. Analysing 11![[thin space (1/6-em)]](https://www.rsc.org/images/entities/char_2009.gif) 400 trajectory snapshots for geometric likeness, according to the algorithm described in Section 2, showed that the structure reproduced in Fig. 2 was remarkably dominant, with a cluster population of 48.9% of the snapshots. Fig. 3 is a Ramachandran plot which reinforces the notion of α-type structures dominating the peptide's behaviour in PLUM.
400 trajectory snapshots for geometric likeness, according to the algorithm described in Section 2, showed that the structure reproduced in Fig. 2 was remarkably dominant, with a cluster population of 48.9% of the snapshots. Fig. 3 is a Ramachandran plot which reinforces the notion of α-type structures dominating the peptide's behaviour in PLUM.
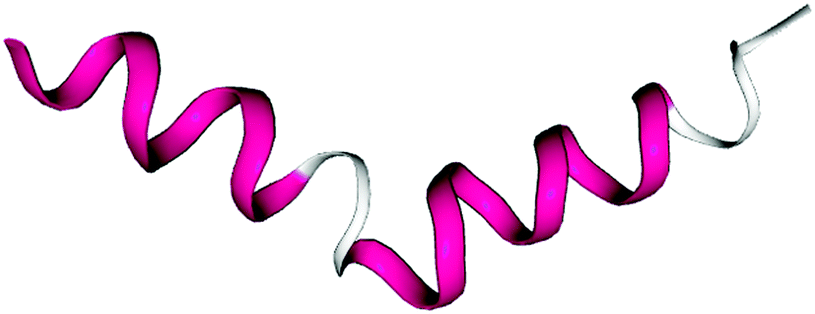 | ||
| Fig. 2 Highest-ranked geometric cluster of n16N at 300.0 K, accounting for 48.9% of trajectory snapshots in the original PLUM model and 4.4% in the modified PLUM* model. This is also the top-occurring cluster of n16NN in PLUM*, with a population of 8.3%. The N-terminus is on the left. Residues 1 to 13 form an α-helix. The structure has a kink centred on a highly α-disruptive proline. The C-terminal half conforms to a left-handed helix, αL. Only the final three residues suggest disorder. | ||
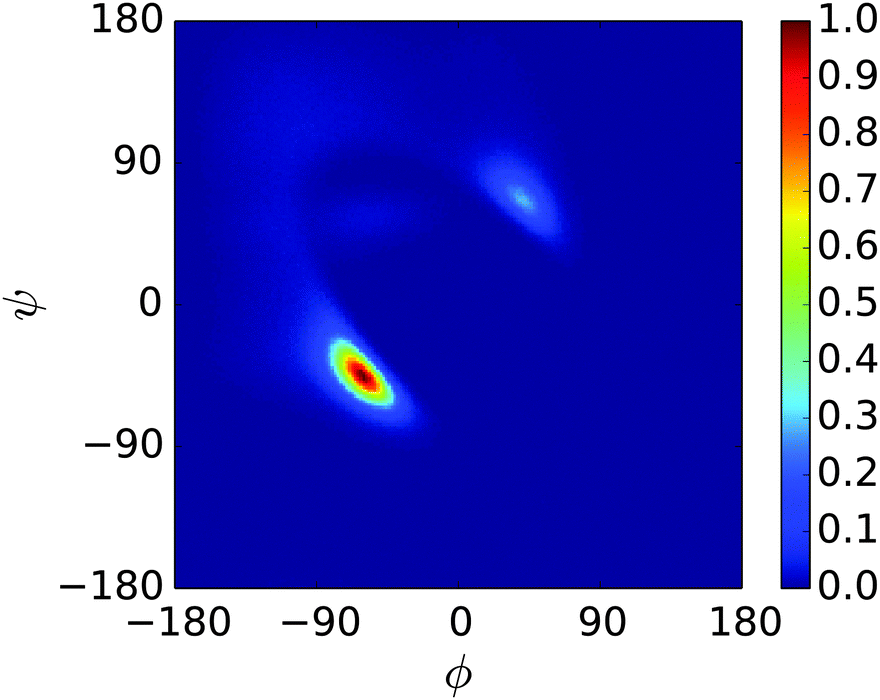 | ||
| Fig. 3 Ramachandran plot showing the exploration of (ϕ,ψ) space for a single unit of n16N at 300.0 K. The dominant peak represents α-helix structure, while the secondary peak represents αL-helix structure, the first peak's enantiomer. | ||
These data suggested that the original PLUM model is too strongly biased toward stable secondary structure to accurately reproduce the conformational ensemble of this IDP. The α-helix, and other common motifs, are principally stabilised by the strong energetic favourability of hydrogen bonding. Therefore, we have repeated the above simulations with minor alterations to the strength of the PLUM backbone–backbone hydrogen bond interaction strength parameter εHB. The resulting occupancy of each quadrant of the Ramachandran plot was plotted and compared to the atomistic REST trajectory, captured at 300.0 K in CHARMM22*.58 These data are presented in Fig. 4.
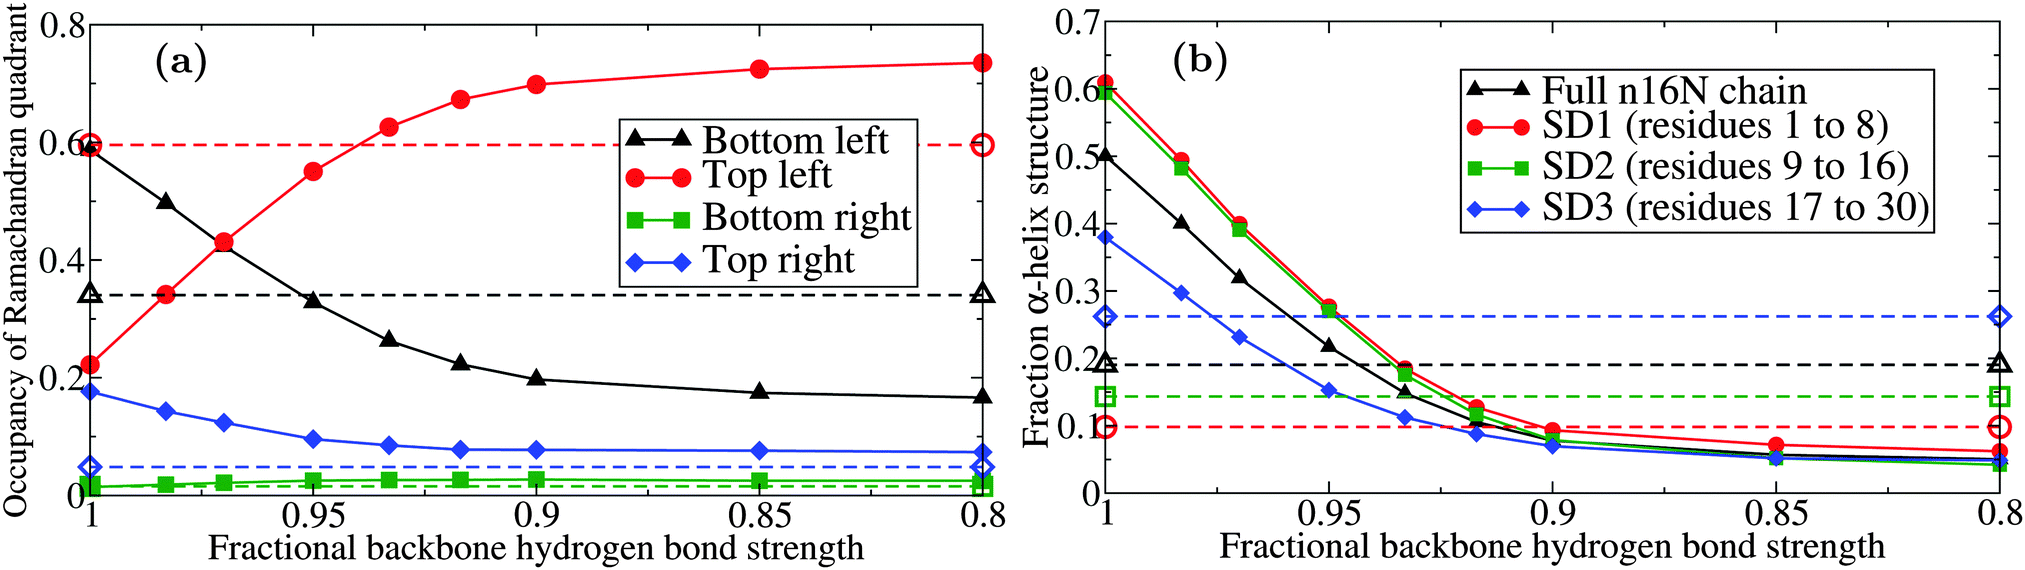 | ||
| Fig. 4 Behaviour of the PLUM model of n16N at 300.0 K as a function of hydrogen bond interaction strength εHB; (a) occupancy of the four Ramachandran quadrants and (b) α-helical structure, broken down by the regions of n16N. Dashed lines with corresponding hollow shapes are the results of atomistic REST simulations58 with the CHARMM22* model77,78 in TIP3P water.79 The occupancy of the alpha-helix-dominated bottom left quadrant drops from approximately 60% to 30% when εHB; is reduced to 94.5% of its original value. | ||
Fig. 4(b) shows that a decline in preference for α-helix structure occurs when the εHB parameter value is reduced, tracking the decline in lower left quadrant occupancy shown in Fig. 4(a). The PLUM output is very sensitive to adjustments, and reaches peak similarity to the atomistic data with a decrease of about 5%. However, when the level of structure is stratified by subdomain, it emerges that the PLUM model does not match the atomistic model in regional ranking by α-helicity.
Based on this study, we have adopted an εHB value set to 94.5% of the original; this will be henceforth referred to as the PLUM* model. Before moving forward, the PLUM* model was tested against validation systems used by the original PLUM authors to check for unexpected changes. The de novo designed peptide 2A3D80 and the 15-unit GNNQQNY peptide system81 were observed to fold and aggregate normally, the only change being the expected decline of approximately 5% in the transition temperature to disorder.
At present, we regard this modification as specific to the n16N system. The tendency to exaggerate stability of secondary structure motifs in IDPs may be a general feature of PLUM-like models, however the sensitivity to εHB demonstrated in Fig. 4 suggests that the specific adjustment used here is unlikely to be transferable. Similar calibration against atomistic simulation may be required on a system by system basis.
3.2 n16N in PLUM*
The simulation protocol of Section 3.1 was repeated in the PLUM* model for the n16N peptide. The results at 300.0 K revealed that the retuning was sufficient to bring PLUM into alignment with CHARMM22* on multiple measures of structural properties.An identical clustering analysis led to the top structure given in Fig. 2 falling in popularity from 48.9% to 4.4%. 1593 clusters of geometrically similar structures arose, compared to the previous experiment's count of 453, and the distribution was far flatter, with top four percentages of 4.4%, 3.4%, 3.0% and 2.4% compared to 48.9%, 10.3%, 4.1% and 3.7%. This implies that n16N is far more disordered in PLUM* than PLUM.
Region-wise cluster analyses were carried out on the chain for equal-length representations of each subdomain, defined in Table 1. All regions produced 32 clusters. The SD1 segment's top three clusters are populated with 41.3%, 26.2% and 9.5% of trajectory snapshots, SD2's with 48.1%, 20.2% and 9.2%, and SD3's with 33.3%, 20.7% and 15.7%. This disparity implies that SD3 possesses the greatest conformational accessibility, in agreement with the fly-casting hypothesis and with previous atomistic results.58
Fig. 5 shows the Ramachandran heat map for this simulation, broadly showing greater disorder in secondary structure. Fig. 6(a) and (b) break down the comparison of secondary structure by specific named structural regions. The majority of segments match well in (a) and (b), but PLUM* has greater γ-structure and other structure, at the expense of PPII structure.
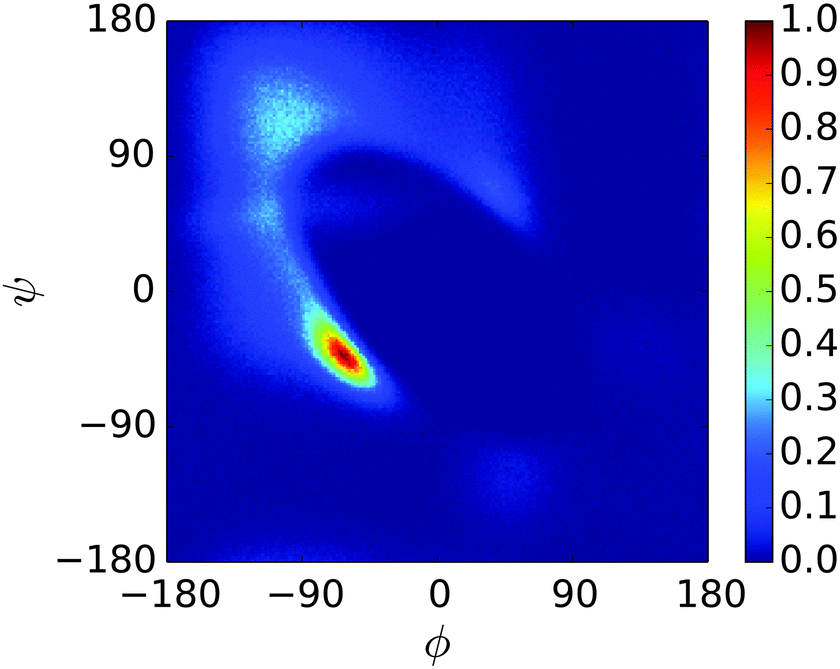 | ||
| Fig. 5 Ramachandran plot for a single unit of n16N at 300.0 K in the PLUM* model, where the backbone hydrogen bonding strength parameter εHB is set to 94.5% of its original value. This confirms that a higher degree of disorder now occurs, though no new peaks emerge. | ||
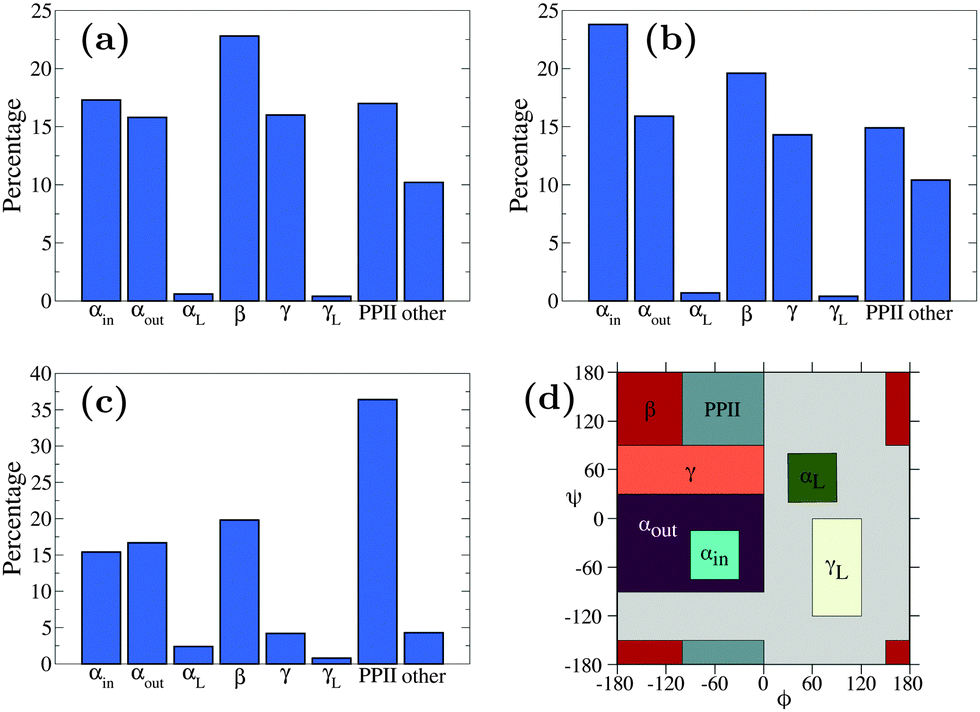 | ||
| Fig. 6 Secondary structure content of simulations of (a) n16N in the PLUM* model, (b) n16NN in the PLUM* model, and (c) n16N in the CHARMM22* model.58 Data represents occupancy of Ramachandran regions according to the scheme presented in (d), which is identical to that of the CHARMM22* model study. | ||
In Fig. 7, secondary structure is compared to the atomistic data on a per-residue basis. The results are promising, indicating that the PLUM* model has a good ability to select between the primary options; α-structure or β-like structure, at the level of individual peptide bonds. Strikingly, both top left quadrant lines are punctuated by two valleys centred on glycines, fluctuating about 0.6 otherwise. Each α line hits a minimum around SD2's I residue, but the disagreement in α-helicity between each subdomain is clear.
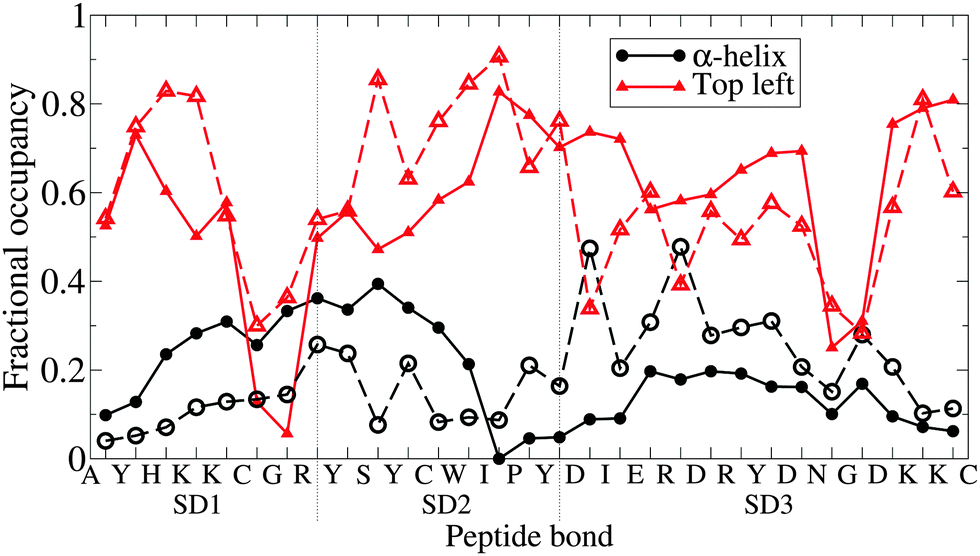 | ||
| Fig. 7 The degree of manifestation of two Ramachandran regions; α-helix and, broadly, “top left quadrant”, for each peptide bond of n16N in the PLUM* model. Subdomains are demarcated by dashed lines. Dashed lines with corresponding hollow shapes are the results of atomistic REST simulations.58 | ||
Moving away from secondary structure, further support for the subdomain hypothesis and for PLUM*'s ability to distinguish chain regions is presented in Fig. 8. Here, side-chain interaction frequencies are examined for the single chain, and the result bolsters the subdomain hypothesis, showing an island of SD1–SD2 interactions, while SD3 is isolated.
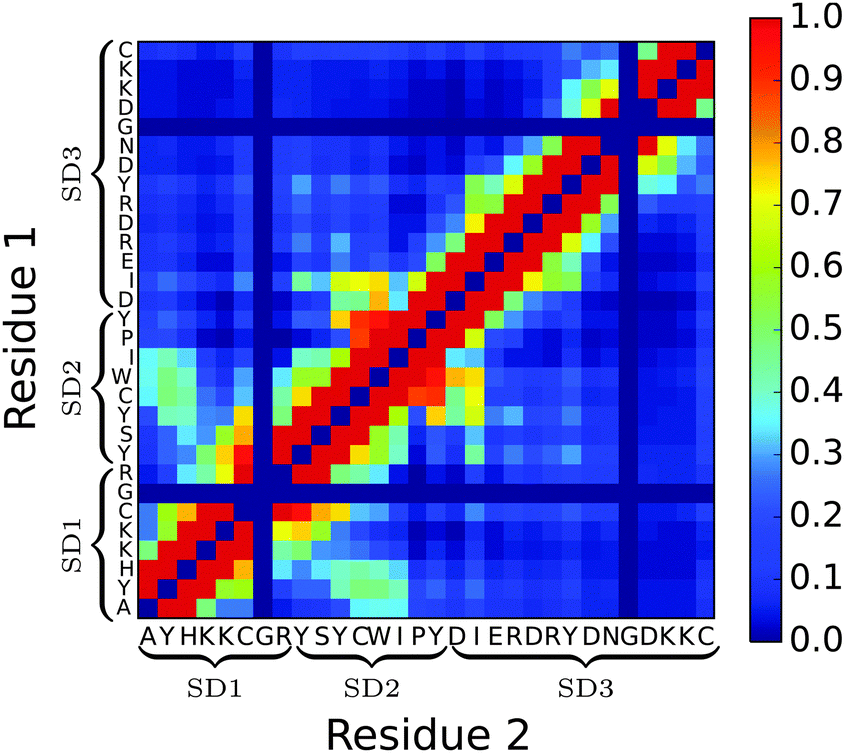 | ||
| Fig. 8 Heat map showing side-chain intrapeptide interaction frequency for the n16N system in PLUM*. Each axis is labelled with the chain's primary structure. Glycine, having no side-chain bead, is always set to 0.0. Self-interactions are set to 0.0. | ||
3.3 n16NN in PLUM*
The simulation parameters used for n16N were used again on the mutant peptide n16NN, and the 300.0 K trajectory was analysed.The top geometric clusters were similar to those found for n16N; the structure in Fig. 2 remained the most frequently-occurring with an increased population of 8.3%. The increased stability is an expected result of removing negatively-charged residues. Fig. 6(b) shows that a move towards greater stability of α-structure, at the expense of most other structural forms, is representative of the whole ensemble. This points towards the conclusion that the charged residues had a role in ensuring the peptide could thermally access a relatively large number of conformational states. However, region-wise cluster analyses show no clear trend towards greater local conformational accessibility, suggesting that the difference lies in the characteristics of the whole peptide. SD1's top clusters had populations at 40.6%, 27.8% and 8.1% of trajectory snapshots, SD2's at 45.9%, 20.0% and 15.9%, and SD3's at 28.1%, 19.0% and 18.0%.
3.4 Two units of n16N and n16NN
REMD simulations of two-chain systems of n16N and of n16NN were carried out; these will be denoted n16N-2 and n16NN-2. n16N-2 simulations ran for 5.1 μs in PLUM* and PLUM, and the n16NN-2 simulation in PLUM* ran for 6.4 μs. For each simulation, 30 replicas were thermostatted at Ti ∈ {275.0, 278.54, 281.69, 284.57, 287.23, 289.67, 291.84, 293.8, 295.61, 297.29, 298.87, 300.00, 301.79, 303.15, 304.46, 305.73, 307.06, 308.47, 309.98, 311.61, 313.39, 315.39, 317.69, 320.5, 324.19, 328.27, 332.72, 337.66, 343.3, 350.0} K. The trajectory at 300.00 K was analysed.Fig. 9 shows the Ramachandran heat maps for the dimer systems. In the PLUM* model, secondary structure manifestation has changed greatly between n16N and n16N-2. α- and αL-structure has been replaced by β-structure, as an emergent result of the peptide's multiplicity. Fig. 9(b) shows that the original PLUM model has not allowed new behaviour to emerge from n16N, compared to the monomer case in Fig. 3. Its structural ensemble has remained α-helix dominated. The n16NN-2 chain in PLUM* shows a greater remaining propensity for α-helicity than n16N-2, though it too has shifted towards β-structure.
 | ||
| Fig. 9 Ramachandran plots of (a) n16N-2 in the PLUM* model, (b) n16N-2 in the PLUM model, and (c) n16NN-2 in the PLUM* model. Despite the relatively subtle differences between the original and altered PLUM model for single-unit n16N, the two models diverge upon simulating n16N-2. | ||
Trajectory snapshots were again used for geometric clustering. The PLUM* trajectories showed a trend of subdomains SD1 and SD2 retaining rigid, β-based conformations at the core of the dipeptide system, while SD3 is extended and labile. n16N-2's highest-ranked cluster populations are 2.6%, 1.9%, 1.0% and 1.0%, and two of these are shown in Fig. 10. n16NN-2 is more stable, and its most populous cluster at 6.9% is the structure shown in Fig. 10(b). The second-place structure with a population of 2.7% is in Fig. 10(a). PLUM produced top n16N clusters mostly consisting of two chains folded helically as in Fig. 2, sitting next to each other and interacting through their side-chains.
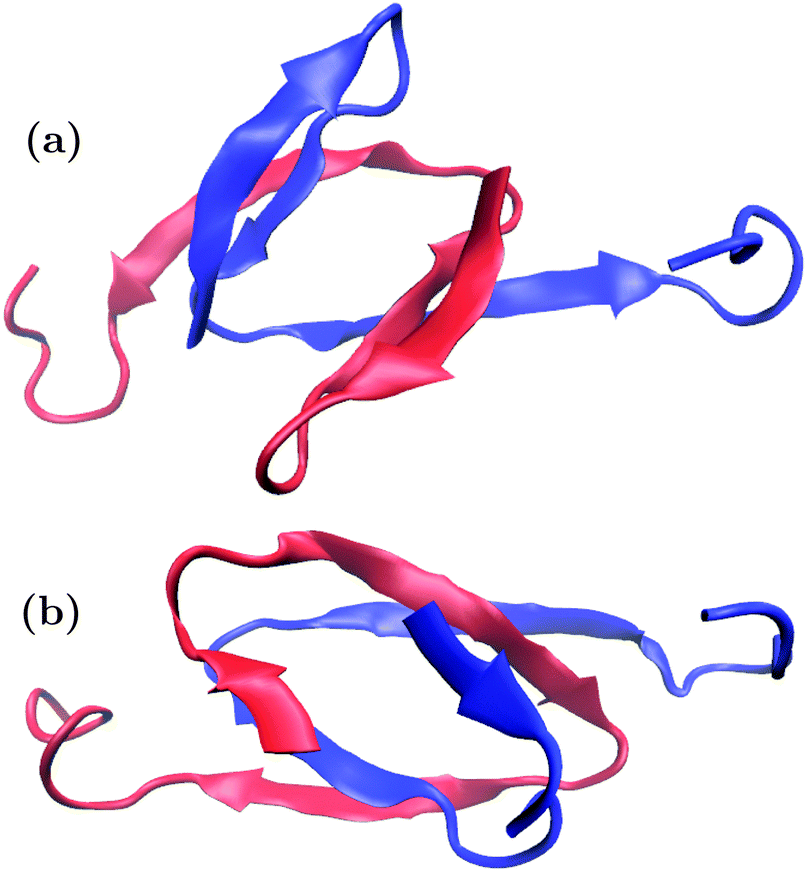 | ||
| Fig. 10 The top-occurring structures for the n16N-2 system in PLUM* at 300.0 K, with populations of (a) 2.6% and (b) 1.9%. In the top structure, SD1 and SD2 form β-hairpins, turning on residues G7 and R8, and ending with a turn on I14 and P15. In the second structure, parallel β-strands bind the chains, with few intrapeptide interactions. Turns occur within the region of residues K5 to R8, and more sharply at residues I14 and P15. In both structures, only the final seven C-terminal residues form a free tail. The two peptides are distinguished by colour. | ||
In order to check for differences in the stable core regions of n16N and n16NN, SD1 and SD2, between the n16N-2 and n16NN-2 PLUM* chains, these regions were also clustered separately. This resulted in the two top clusters matching those in Fig. 10. The most frequently-occurring clusters of n16NN-2 contain a larger proportion of the overall population than in the n16N-2 system, its top three scoring 3.5%, 3.2% and 1.3%, compared to 2.6%, 0.79% and 0.63%. This complements the result seen for single units of the peptides that conformational accessibility of the full chain, not just that of SD3, drops as a result of the changes from n16N to n16NN.
Fig. 11 shows each residue's level of involvement in interpeptide interactions for the dimers in the PLUM* model. Combined with the clustering analysis, these data are in striking agreement with the hypothesised domain roles (Table 1). SD1 and SD2 are highly involved in interpeptide stabilisation, both by backbone and side-chain interaction. Interpeptide interactions decline after SD2, so that the tail of SD3 is largely free and unbound. A surprisingly simple difference is seen between the n16N and n16NN lines, which is a slight increase in proportion throughout, once again lending strength to the hypothesis of the SD3 changes having a full-system effect.
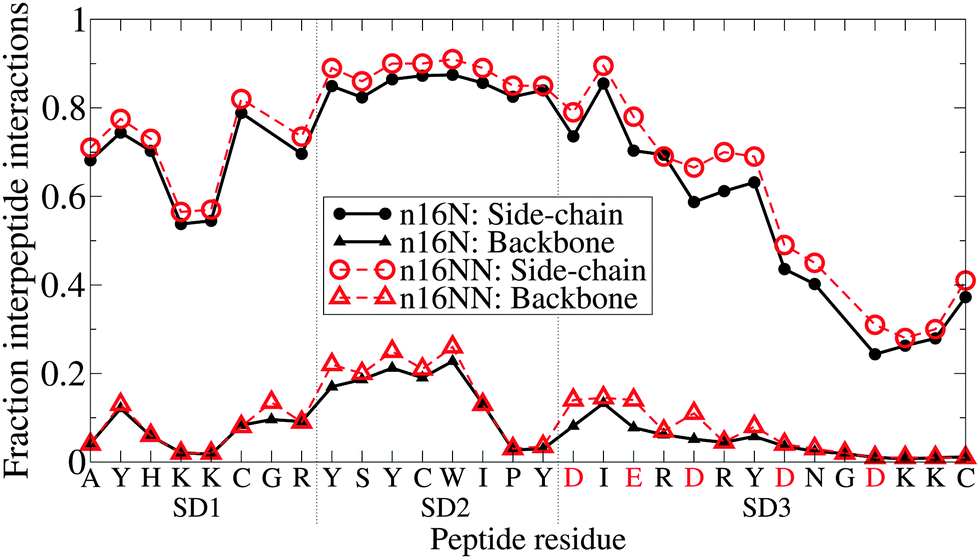 | ||
| Fig. 11 The proportion of trajectory snapshots for which any given residue along the chain is involved in an interaction binding it to the other chain, in the n16N-2 and n16NN-2 systems. The n16N residue sequence is shown on the x-axis; the residues indicated in red are replaced in n16NN according to D → N and E → Q. Interactions are divided into side-chain and backbone hydrogen bond types; glycine is skipped on the side-chain datasets as it has no side-chain bead. | ||
3.5 The S1 peptide in PLUM*
A REMD simulation of the proline-rich peptide S1 was carried out with 16 replicas, each running for 8.4 μs. The replicas were thermostatted at Ti ∈ {275.0, 280.0, 285.0, 290.0, 300.0, 305.0, 307.5, 310.0, 312.5, 315.0, 317.5, 320.0, 325.0, 330.0, 340.0, 350.0} K.The trajectory at 300.0 K was analysed. Fig. 12 displays the Ramachandran heat map for this dataset. As discussed in Section 1.3, S1 is expected to fold into a polyproline II helix, with approximate (ϕ, ψ) coordinates of (−75°, 160°), making the result seen here disappointing. Extremely similar results were produced for S1 when the simulation was performed in the original PLUM model. S1 was simulated as a litmus test of the PLUM model's ability to model proline realistically, and its failure leads to an important caveat about PLUM's success.
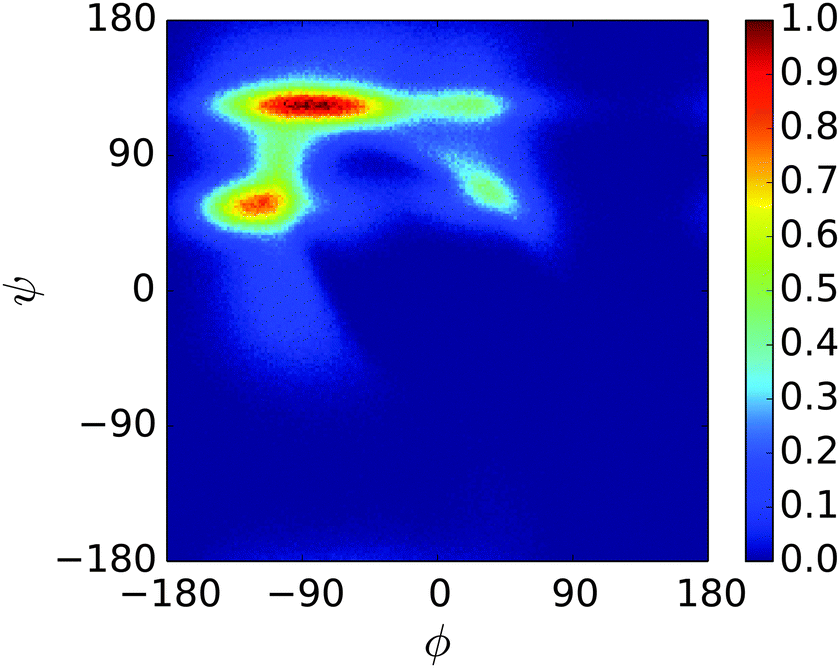 | ||
| Fig. 12 Ramachandran plot showing the exploration of (ϕ,ψ) space for a single unit of S1 at 300.0 K. | ||
4 Summary and conclusions
The four-bead-per-residue protein model PLUM27 was used to simulate two peptides representative of intrinsically disordered proteins (IDP). The model places side-chain beads on a hydrophobic scale and deduces interaction strengths from simple mixing rules. Simulations of n16N in the PLUM model showed over-expression of the α-helix motif, replicating the common result that IDP simulations with current models produce structures which are overly collapsed.18–22 The model's backbone hydrogen bonding strength parameter was adjusted with reference to atomistic data;58 an optimal reduction was found to be 5.5%. We refer to this adjusted model as PLUM*.The new model had greatly enhanced success with ensemble averaged structural properties of the n16N system. Measures of secondary structure based on dihedral angles reveal a good approximation to atomistic data, especially in terms of gross structural characteristics, and semi-quantitatively on a per-peptide bond basis. Measurements of most frequent residue–residue interactions showed that the importance of tyrosine–tyrosine interactions and the subdomain SD2's interactions, proposed on the basis of bioinformatics studies60 and atomistic simulations58 were replicated in PLUM*. A clustering analysis of the trajectory showed that the C-terminal region known as SD3 had the greatest conformational accessibility, in keeping with the current subdomain hypothesis shown in Table 1.
The n16N-2 and n16NN-2 system simulations were extremely interesting. The fact that multiplicity of the peptide in the system vastly changes the peptides' folding and draws divergent behaviour out of each subdomain, aligning with the hypothesised aggregation-dependent function and featuring disorder, is a remarkable property of the system for Bereau and Deserno's simple model to capture. This result suggests the strong possibility of a role for coarse-grained protein models of this level, albeit in modified form, in studying intrinsically disordered protein behaviour.
The simulations of the mutant peptide n16NN showed that PLUM* can distinguish small changes in a peptide; these systems had greater full-chain stability for the more frequently occurring geometric cluster, and had a stronger tendency than n16N for α-structure. Compared to n16N-2, the n16NN-2 system featured a far more stable SD1 and SD2 core; an interesting result, as these subdomains are identical in the two peptides. As it has been suggested that disorder is beneficial for molecular assembly,38 this may be relevant to n16NN's reported difficulty aggregating.47,50
Experimental CD spectral data and dynamic light scattering data52 and bioinformatic studies62 provide an insight into the oligomerisation behaviour of n16N which larger-scale PLUM* simulations could compare to. Greater structural stability is expected from n16N in larger systems and PLUMμs behaviour in this situation will be an important test of the model. Failure of PLUM* to correctly simulate the proline-rich S1 peptide highlights one instance where caution is needed, as the proline residue is found at the centre of the n16N sequence.
Acknowledgements
This work was funded as part of the Materials Interface with Biology (MIB) consortium, supported by the Engineering and Physical Sciences Research Council under grant number EP/I001514/1. This work was partially supported by the Air Force Office for Scientific Research, grant number FA9550-12-1-0226. The Centre for Scientific Computing at Warwick University provided access to its high-performance facilities and the UK's national computing facility Archer was also utilised under this grant. MPA and GOR acknowledge helpful discussions with Tristan Bereau and Anthony M. Bano. TRW thanks veski for an Innovation Fellowship.References
- A. K. Dunker, C. J. Brown, J. D. Lawson, L. M. Iakoucheva and Z. Obradović, Biochemistry, 2002, 41, 6573–6582 CrossRef CAS PubMed.
- A. K. Dunker, M. M. Babu, E. Barbar, M. Blackledge, S. E. Bondos, Z. Dosztányi, H. J. Dyson, J. Forman-Kay, M. Fuxreiter, J. Gsponer, K.-H. Han, D. T. Jones, S. Longhi, S. J. Metallo, K. Nishikawa, R. Nussinov, Z. Obradovic, R. V. Pappu, B. Rost, P. Selenko, V. Subramaniam, J. L. Sussman, P. Tompa and V. N. Uversky, Intrinsically Disordered Proteins, 2013, 1, 4 CrossRef.
- P. Tompa, Trends Biochem. Sci., 2012, 37, 509–516 CrossRef CAS PubMed.
- H. Wu, Chin. J. Physiol., 1931, 5, 321–344 CAS.
- H. M. Berman, J. Westbrook, Z. Feng, G. Gilliland, T. N. Bhat, H. Weissig, I. N. Shindyalov and P. E. Bourne, Nucleic Acids Res., 2000, 28, 235–242 CrossRef CAS PubMed.
- F. Karush, J. Am. Chem. Soc., 1950, 72, 2705–2713 CrossRef CAS.
- W. S. Bennett and T. A. Steitz, Proc. Natl. Acad. Sci. U. S. A., 1978, 75, 4848–4852 CrossRef CAS.
- K. W. Plaxco and M. Gross, Nature, 1997, 386, 657–659 CrossRef CAS PubMed.
- P. E. Wright and H. Dyson, J. Mol. Biol., 1999, 293, 321–331 CrossRef CAS PubMed.
- V. N. Uversky, J. R. Gillespie and A. L. Fink, Proteins: Struct., Funct., Genet., 2000, 41, 415–427 CrossRef CAS.
- A. Dunker, J. Lawson, C. J. Brown, R. M. Williams, P. Romero, J. S. Oh, C. J. Oldfield, A. M. Campen, C. M. Ratliff, K. W. Hipps, J. Ausio, M. S. Nissen, R. Reeves, C. Kang, C. R. Kissinger, R. W. Bailey, M. D. Griswold, W. Chiu, E. C. Garner and Z. Obradovic, J. Mol. Graphics Modell., 2001, 19, 26–59 CrossRef CAS PubMed.
- P. Tompa, Trends Biochem. Sci., 2002, 27, 527–533 CrossRef CAS PubMed.
- B. Monastyrskyy, A. Kryshtafovych, J. Moult, A. Tramontano and K. Fidelis, Proteins: Struct., Funct., Bioinf., 2014, 82, 127–137 CrossRef CAS PubMed.
- M. Arai, K. Sugase, H. J. Dyson and P. E. Wright, Proc. Natl. Acad. Sci. U. S. A., 2015, 112, 9614–9619 CrossRef CAS PubMed.
- I. C. Felli and R. Pierattelli, J. Magn. Reson., 2014, 241, 115–125 CrossRef CAS PubMed.
- D. Eliezer, Curr. Opin. Struct. Biol., 2009, 19, 23–30 CrossRef CAS PubMed.
- W. Ye, D. Ji, W. Wang, R. Luo and H.-F. Chen, J. Chem. Inf. Model., 2015, 55, 1021–1029 CrossRef CAS PubMed.
- J. Henriques, C. Cragnell and M. Skepö, J. Chem. Theory Comput., 2015, 11, 3420–3431 CrossRef CAS.
- A. Kurut, J. Henriques, J. Forsman, M. Skepö and M. Lund, Proteins: Struct., Funct., Bioinf., 2014, 82, 657–667 CrossRef CAS PubMed.
- R. B. Best, W. Zheng and J. Mittal, J. Chem. Theory Comput., 2014, 10, 5113–5124 CrossRef CAS PubMed.
- D. Nettels, S. Müller-Späth, F. Küster, H. Hofmann, D. Haenni, S. Rüegger, L. Reymond, A. Hoffmann, J. Kubelka, B. Heinz, K. Gast, R. B. Best and B. Schuler, Proc. Natl. Acad. Sci. U. S. A., 2009, 106, 20740–20745 CrossRef CAS PubMed.
- F. Palazzesi, M. K. Prakash, M. Bonomi and A. Barducci, J. Chem. Theory Comput., 2015, 11, 2–7 CrossRef CAS.
- D. Baker, Nature, 2000, 405, 39–42 CrossRef CAS PubMed.
- R. D. Hills, Jr, L. Lu and G. A. Voth, PLoS Comput. Biol., 2010, 6, e1000827 Search PubMed.
- R. DeVane, W. Shinoda, P. B. Moore and M. L. Klein, J. Chem. Theory Comput., 2009, 5, 2115–2124 CrossRef CAS PubMed.
- L. Monticelli, S. K. Kandasamy, X. Periole, R. G. Larson, D. P. Tieleman and S.-J. Marrink, J. Chem. Theory Comput., 2008, 4, 819–834 CrossRef CAS.
- T. Bereau and M. Deserno, J. Chem. Phys., 2009, 130, 235106 CrossRef PubMed.
- A. Barducci, M. Bonomi and P. Derreumaux, J. Chem. Theory Comput., 2011, 7, 1928–1934 CrossRef CAS.
- I. Coluzza, PLoS One, 2011, 6, e20853 CAS.
- M. Cheon, I. Chang and C. K. Hall, Proteins: Struct., Funct., Bioinf., 2010, 78, 2950–2960 CrossRef CAS PubMed.
- A. Wagenmann and T. Geyer, J. Chem. Theory Comput., 2012, 8, 4732–4745 CrossRef CAS.
- T. Bereau, C. Globisch, M. Deserno and C. Peter, J. Chem. Theory Comput., 2012, 8, 3750–3758 CrossRef CAS.
- S. Weiner and P. M. Dove, Rev. Mineral. Geochem., 2003, 54, 1–29 CrossRef CAS.
- V. Bettencourt and A. Guerra, J. Exp. Mar. Biol. Ecol., 2000, 248, 191–205 CrossRef CAS PubMed.
- G. He, T. Dahl, A. Veis and A. George, Nat. Mater., 2003, 2, 552–558 CrossRef CAS PubMed.
- H. A. Lowenstam and S. Weiner, On Biomineralization, Oxford University Press, 1989 Search PubMed.
- L. Kalmar, D. Homola, G. Varga and P. Tompa, Bone, 2012, 51, 528–534 CrossRef CAS PubMed.
- K. Namba, Genes Cells, 2001, 6, 1–12 CrossRef CAS PubMed.
- T. Samata, N. Hayashi, M. Kono, K. Hasegawa, C. Horita and S. Akera, FEBS Lett., 1999, 462, 225–229 CrossRef CAS PubMed.
- S. Collino and J. S. Evans, Biomacromolecules, 2008, 9, 1909–1918 CrossRef CAS PubMed.
- C. Nogawa, H. Baba, T. Masaoka, H. Aoki and T. Samata, Gene, 2012, 504, 84–91 CrossRef CAS PubMed.
- L. Gardner, D. Mills, A. Wiegand, D. Leavesley and A. Elizur, BMC Genomics, 2011, 12, 455 CrossRef CAS PubMed.
- B. Marie, C. Joubert, A. Tayalé, I. Zanella-Cléon, C. Belliard, D. Piquemal, N. Cochennec-Laureau, F. Marin, Y. Gueguen and C. Montagnani, Proc. Natl. Acad. Sci. U. S. A., 2012, 109, 20986–20991 CrossRef CAS PubMed.
- C. Montagnani, B. Marie, F. Marin, C. Belliard, F. Riquet, A. Tayalé, I. Zanella-Cléon, E. Fleury, Y. Gueguen, D. Piquemal and N. Cochennec-Laureau, ChemBioChem, 2011, 12, 2033–2043 CrossRef CAS PubMed.
- I. W. Kim, E. DiMasi and J. S. Evans, Cryst. Growth Des., 2004, 4, 1113–1118 CAS.
- I. Kim, M. Darragh, C. Orme and J. Evans, Cryst. Growth Des., 2006, 6, 5–10 CAS.
- K. Delak, S. Collino and J. S. Evans, Langmuir, 2007, 23, 11951–11955 CrossRef CAS PubMed.
- R. A. Metzler, I. W. Kim, K. Delak, J. S. Evans, D. Zhou, E. Beniash, F. Wilt, M. Abrecht, J.-W. Chiou, J. Guo, S. N. Coppersmith and P. U. P. A. Gilbert, Langmuir, 2008, 24, 2680–2687 CrossRef CAS PubMed.
- E. C. Keene, J. S. Evans and L. A. Estroff, Cryst. Growth Des., 2010, 10, 1383–1389 CAS.
- R. A. Metzler, J. S. Evans, C. E. Killian, D. Zhou, T. H. Churchill, N. P. Appathurai, S. N. Coppersmith and P. U. P. A. Gilbert, J. Am. Chem. Soc., 2010, 132, 6329–6334 CrossRef CAS PubMed.
- E. C. Keene, J. S. Evans and L. A. Estroff, Cryst. Growth Des., 2010, 10, 5169–5175 CAS.
- F. F. Amos, C. B. Ponce and J. S. Evans, Biomacromolecules, 2011, 12, 1883–1890 CrossRef CAS PubMed.
- J. Seto, A. Picker, Y. Chen, A. Rao, J. S. Evans and H. Cölfen, Cryst. Growth Des., 2014, 14, 1501–1505 CAS.
- S. Weiner, W. Traub and S. B. Parker, Philos. Trans. R. Soc. London, Ser. B, 1984, 304, 425–434 CrossRef CAS.
- G. Falini, S. Albeck, S. Weiner and L. Addadi, Science, 1996, 271, 67–69 Search PubMed.
- P. Liu, B. Kim, R. A. Friesner and B. J. Berne, Proc. Natl. Acad. Sci. U. S. A., 2005, 102, 13749–13754 CrossRef CAS PubMed.
- L. Wang, R. A. Friesner and B. J. Berne, J. Phys. Chem. B, 2011, 115, 9431–9438 CrossRef CAS PubMed.
- A. H. Brown, P. M. Rodger, J. S. Evans and T. R. Walsh, Biomacromolecules, 2014, 15, 4467–4479 CrossRef CAS PubMed.
- L. B. Wright, J. P. Palafox-Hernandez, P. M. Rodger, S. Corni and T. R. Walsh, Chem. Sci., 2015, 6, 5204–5214 RSC.
- J. S. Evans, Bioinformatics, 2012, 28, 3182–3185 CrossRef CAS PubMed.
- B. A. Shoemaker, J. J. Portman and P. G. Wolynes, Proc. Natl. Acad. Sci. U. S. A., 2000, 97, 8868–8873 CrossRef CAS PubMed.
- C. B. Ponce and J. S. Evans, Cryst. Growth Des., 2011, 11, 4690–4696 CAS.
- E. E. Oren, C. Tamerler, D. Sahin, M. Hnilova, U. O. S. Seker, M. Sarikaya and R. Samudrala, Bioinformatics, 2007, 23, 2816–2822 CrossRef CAS PubMed.
- E. E. Oren, R. Notman, I. W. Kim, J. S. Evans, T. R. Walsh, R. Samudrala, C. Tamerler and M. Sarikaya, Langmuir, 2010, 26, 11003–11009 CrossRef CAS PubMed.
- S. Miyazawa and R. L. Jernigan, J. Mol. Biol., 1996, 256, 623–644 CrossRef CAS PubMed.
- S. Plimpton, J. Comput. Phys., 1995, 117, 1–19 CrossRef CAS.
- Y. Sugita and Y. Okamoto, Chem. Phys. Lett., 1999, 314, 141–151 CrossRef CAS.
- R. H. Swendsen and J.-S. Wang, Phys. Rev. Lett., 1986, 57, 2607–2609 CrossRef PubMed.
- D. Frenkel and B. Smit, Understanding molecular simulation: from algorithms to applications, Academic Press, 2002 Search PubMed.
- H. Berendsen, D. van der Spoel and R. van Drunen, Comput. Phys. Commun., 1995, 91, 43–56 CrossRef CAS.
- B. Hess, C. Kutzner, D. van der Spoel and E. Lindahl, J. Chem. Theory Comput., 2008, 4, 435–447 CrossRef CAS.
- S. Pronk, S. Páll, R. Schulz, P. Larsson, P. Bjelkmar, R. Apostolov, M. R. Shirts, J. C. Smith, P. M. Kasson, D. van der Spoel, B. Hess and E. Lindahl, Bioinformatics, 2013, 29, 845–854 CrossRef CAS PubMed.
- X. Daura, K. Gademann, B. Jaun, D. Seebach, W. F. van Gunsteren and A. E. Mark, Angew. Chem., Int. Ed., 1999, 38, 236–240 CrossRef CAS.
- A. S. Rose and P. W. Hildebrand, Nucleic Acids Res., 2015, 43, W576–W579 CrossRef PubMed.
- W. Humphrey, A. Dalke and K. Schulten, J. Mol. Graphics, 1996, 14, 33–38 CrossRef CAS PubMed.
- J. Maupetit, R. Gautier and P. Tufféry, Nucleic Acids Res., 2006, 34, W147–W151 CrossRef CAS PubMed.
- S. Piana, K. Lindorff-Larsen and D. E. Shaw, Biophys. J., 2011, 100, L47–L49 CrossRef CAS PubMed.
- A. D. MacKerell, D. Bashford, M. Bellott, R. L. Dunbrack, J. D. Evanseck, M. J. Field, S. Fischer, J. Gao, H. Guo, S. Ha, D. Joseph-McCarthy, L. Kuchnir, K. Kuczera, F. T. K. Lau, C. Mattos, S. Michnick, T. Ngo, D. T. Nguyen, B. Prodhom, W. E. Reiher, B. Roux, M. Schlenkrich, J. C. Smith, R. Stote, J. Straub, M. Watanabe, J. Wiórkiewicz-Kuczera, D. Yin and M. Karplus, J. Phys. Chem. B, 1998, 102, 3586–3616 CrossRef CAS PubMed.
- W. L. Jorgensen, J. Chandrasekhar, J. D. Madura, R. W. Impey and M. L. Klein, J. Chem. Phys., 1983, 79, 926–935 CrossRef CAS.
- S. T. R. Walsh, H. Cheng, J. W. Bryson, H. Roder and W. F. DeGrado, Proc. Natl. Acad. Sci. U. S. A., 1999, 96, 5486–5491 CrossRef CAS.
- J. Gsponer, U. Haberthür and A. Caflisch, Proc. Natl. Acad. Sci. U. S. A., 2003, 100, 5154–5159 CrossRef CAS PubMed.
| This journal is © the Owner Societies 2015 |