Acidity of two-dimensional zeolites†
Received
26th August 2015
, Accepted 14th September 2015
First published on 6th October 2015
Abstract
Hybrid quantum mechanics:molecular mechanics (QM/MM) calculations of absolute deprotonation energies are performed with periodic boundary conditions for Brønsted sites of aluminosilicate bilayers with various Al/Si ratios (two-dimensional zeolite). The supercell method is applied and density functional theory is used. Much lower values are obtained (1042, 1069 and 1091 kJ mol−1 for Al/Si = 1/63, 1/7 and 1/3, respectively) than those for bulk zeolites (1233 kJ mol−1 for H-chabazite with Al/Si = 1/11). We ascribe the much lower deprotonation energy to the smaller effective dielectric constant (1.6–1.9) of an ultra-thin dielectric in a vacuum compared to that of the corresponding bulk systems (3.0 for H-chabazite), which leads to a better stabilization of the charge created upon deprotonation.
1. Introduction
Zeolites are crystalline porous aluminosilicates which are naturally occurring or synthesized. They are widely used as catalysts in industrial processes such as catalytic cracking of crude oil, methanol to gasoline conversion and olefin oligomerization.1,2 The catalytic activity of proton forms of zeolites originates from bridging Al–O(H)–Si groups which represent Brønsted acid sites.3,4
In recent years a particular class of materials, two-dimensional zeolites, has attracted interest.5 They exist either as nanosheets, as thin as single unit cells of, e.g. MFI,6,7 or as ultra-thin model systems grown under UHV conditions on metal substrates.8,9 The latter were prepared by the deposition of O2, Si and Al on the Ru(0001) surface and subsequent adsorption and desorption of water.8,9 They consist of an aluminosilicate bilayer with a two-dimensional arrangement of hexagonal prisms and contain surface Brønsted sites.8 Thus, they may be considered as two-dimensional zeolites (H-2dH) with the flat surface corresponding to the infinite pore size.9 The advantage of the H-2dH thin films is that their properties can be analysed using surface science techniques.
Adsorption of the weak bases CO and C2H2 on the acidic site of the H-2dH zeolite causes a red shift of the O–H stretching band that is considerably higher than the shift observed for the bulk H-SSZ-13 zeolite, the protonated form of H-chabazite (H-CHA).8,9 This suggests that the two-dimensional (2D) zeolite structures are considerably more acidic than the three-dimensional (3D) ones.
The OH frequency shift upon adsorption of probe molecules10 is only one of the different measures of acidity strength.11–13 It is a reactivity parameter that assumes an “early” transition state. In contrast, adsorption of strong bases like ammonia or pyridine that have also been studied for H-2dH and H-CHA catalysts9 implies a late transition state with the proton being transferred to the reaction partner. However, the heat of ammonia adsorption depends on two factors, the intrinsic acidity of the Brønsted site (which is larger for the 2D zeolite) and the van der Waals interaction between the ammonium ion formed and the surface. The latter is larger for the curved surface of the porous material which is due to a better fit. A parameter that describes the intrinsic acidity without any interaction between the base molecule and the surface is the deprotonation energy (or the proton affinity of the deprotonated Brønsted site).4
The energy of adsorption, ΔEads, for the formation of an interacting ion pair
can be decomposed into the energy of the interaction, Δ
EIP, between the protonated species and the deprotonated surface site,
the deprotonation energy, Δ
EDP, of the Brønsted site,
and the proton affinity, Δ
EPA, of the base molecule
Hence,
| | | ΔEads = ΔEIP + ΔEDP + ΔEPA | (5) |
For molecules in the gas phase measuring the deprotonation energy (or the proton affinity) is a well-established technique. Mass spectrometry yields proton transfer equilibrium constants that are converted into gas phase acidity and gas phase basicity scales,
e.g.,
ref. 14. For surface hydroxyl groups, however, quantum chemical calculations are the only source.
4,11,15,16
The aim of this work is to determine the intrinsic acidity of H-2dH zeolites by performing hybrid QM/MM calculations of the deprotonation energy, and to compare it with that of H-CHA as an example of bulk zeolites. We also investigate the influence of the Al/Si ratio on the acidity of the H-2dH system and we analyse the structure factors determining the deprotonation energies.
2. Methods
2.1 Periodicity and deprotonation energies
Zeolites are crystalline materials and theoretical investigations of their properties have to take into account the periodicity of the system. The deprotonation energy of a zeolite (ΔEDP) is defined as the energy difference between the deprotonated (Z–O−) and the protonated (Z–OH) zeolite:| | | ΔEDP = EZO− − EZOH = ΔEvDP + Erel | (6) |
Using the energy of the deprotonated system “at the structure of” the parent system, EZO−//ZOH, it may be decomposed into a “vertical” deprotonation energy, ΔEvDP, and a relaxation energy, Erel,| | | Erel = EZO− − EZO−//ZOH | (7a) |
| | | ΔEvDP = EZO−//ZOH − EZOH | (7b) |
Applying periodic boundary conditions to the deprotonation process implies that a negative charge is created in every unit cell. This causes divergence of the electrostatic energy for the deprotonated system, ZO−. It is also an unrealistic model because in the catalytic process we do not expect release of a proton in every unit cell at the same time. The divergence of the electrostatic energy can be eliminated by adding a uniform background charge to the deprotonated unit cell. The spurious interaction between the charged defects can be reduced using the supercell method or approximately eliminated using the method proposed by Leslie and Gillan (LG method).17
2.1.1 The supercell approach.
This is the simplest, but computationally most demanding method. We build a series of supercells by multiplying the original unit cell N times in every direction and calculate the deprotonation energy for each supercell. We remove only one proton per supercell. This way, the distance between charged defects increases, and the artificial anion–anion interaction decreases. The deprotonation energy of the zeolite becomes a function of N. In the limit of infinitely large N, its value, ΔE∞DP, is interpreted as the deprotonation energy needed to remove the proton from an isolated Brønsted site. In the N × N × N supercell, the cubic root of the supercell volume,  , can be defined as the average distance between the charged defect and its nearest periodic images, 〈r−
![[thin space (1/6-em)]](https://www.rsc.org/images/entities/char_2009.gif) −〉. The deprotonation energy of the system can be extrapolated using the following equation:
−〉. The deprotonation energy of the system can be extrapolated using the following equation:| |  | (8) |
where ΔEDP(N) is the deprotonation energy for the N × N × N supercell, and A and B are fitting parameters. The 1/r and 1/r3 terms of the total correction, Ecorr, correspond to charge–charge and dipole–dipole interactions, respectively, and the parameters A and B reflect the screening properties of the material.
2.1.2 Aperiodic correction.
The method proposed by Leslie and Gillan17 relies on the macroscopic approximation. It assumes that the difference between the energy per unit cell for the periodic defect and for the isolated defect is equal to the interaction of a periodic array of point charges, E−−, immersed in a dielectric medium with the dielectric constant ε of the system without defects. Therefore, the deprotonation energy can be expressed as:| |  | (9) |
In practice, E−− is the energy of the point charge (usually H+) placed in the unit cell of the investigated system immersed in the compensating background charge, whereas ε(LG) is 1/3 of the trace of the static dielectric tensor of the system. Comparison of eqn (8) and (9) shows that, if both correction methods are correct, the relationship:| | 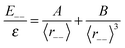 | (10) |
holds, from which we can calculate an effective dielectric constant εeff(SC) from given A and B parameters. The Leslie–Gillan approach is valid if the original unit cell is big enough to encapsulate the structural deformation induced by the charged defect and the dielectric constant of the material is isotropic. Both conditions are usually fulfilled for bulk zeolites, and the Leslie–Gillan method of aperiodic correction is the method of choice for these materials.
2.2 Embedded cluster QM/MM calculations
To calculate the deprotonation energy of zeolites, we used a mechanical embedding scheme,18,19 which partitions the system (S) into the inner region (I) and the outer region (O). The dangling bonds of the inner part are saturated with hydrogen link atoms, and the inner part together with the link atoms forms the cluster (C). The total energy E(S) and the forces ![[F with combining right harpoon above (vector)]](https://www.rsc.org/images/entities/i_char_0046_20d1.gif) α(S) acting on the atoms are obtained as follows:18,19
α(S) acting on the atoms are obtained as follows:18,19| | | E(S) = EQM(C) + EMM(S) − EMM(C) | (11a) |
| | | α(S) = α,QM(C) + α,MM(S) − α,MM(C) α ∈ I | (11b) |
| | | β(S) = β,MM(S) β ∈ O | (11c) |
To the quantum mechanical results for the cluster, EQM(C) and α,QM(C), the results of the periodic description of the lattice by the force field, EMM(S) and α,MM(S), are added. The third contribution EMM(C) and α,MM(C) eliminates approximately the double counting of the contributions coming from atoms in the inner region and artificial contributions from link atoms. For an atom α of the inner region, all three terms contribute to the force acting on it. For an atom β of the outer region, the force is obtained from the force field alone. A link atom is not moved according to the force acting on it. It is instead fixed on the bond which it terminates.19,20
If we apply the QM-Pot embedding scheme (eqn (11a)) to calculate the zeolite deprotonation energy and introduce the notation CH, SH, C− and S−, for the cluster C and the total system S of the protonated and deprotonated form, respectively, we obtain:
| | | ΔEDP = ΔEDP(QM) + ΔEDP(MM) | (12a) |
with:
| | | ΔEDP(QM) = EQM(C−) − EQM(CH) | (12b) |
| | | ΔEDP(MM) = EMM(S−) − EMM(C−) − [EMM(SH) − EMM(CH)] | (12c) |
If the cluster is large enough, the structural distortion upon deprotonation decays within the cluster region and the Δ
EDP(MM) term consists only of electrostatic interactions,
i.e. long-range contributions Δ
ELR.
18 Hence,
| | | ΔEDP = ΔEDP(QM) + ΔELR | (13) |
Effectively, the deprotonation energy of the whole system is the sum of the deprotonation energy of a cluster calculated at the QM level and the long-range term representing the electrostatic interaction between the inner and the outer part of the system. This long range term is described at the MM level. Thus, the choice of an appropriate force field is crucial for the success of QM/MM calculations. To check if the applied embedding scheme works correctly, the convergence of the deprotonation energy with respect to the cluster size has to be investigated.
For the Leslie–Gillan method, with eqn (9) the total long-range correction, ΔE∞LR, is given by
| |  | (14) |
whereas for the supercell method it is obtained as
| | | ΔE∞LR = ΔE∞DP − ΔEDP(QM) | (15) |
2.3 Details of QM/MM calculations
We used the QMPOT package,19,20 with DFT for the QM part and the DFT-parametrized polarizable shell model potential of Sierka and Sauer21 for the MM part. The DFT calculations of energies and forces were done using the TURBOMOLE22 package with the B3LYP functional and the TZVP basis set named “def2” in the TURBOMOLE library.23,24 The latter includes the following contracted functions: H: (5s1p)/[3s1p], O: (11s6p2d1f)/[5s3p2d1f], and Si/Al: (14s9p3d1f)/[5s5p2d1f]. The choice of functional is based on previous experiences,21,25 and motivated by the fact that deprotonation energies of small aluminosilicate clusters calculated with the B3LYP functional are in very good agreement with the CCSD(T) results (see Table S1 in the ESI†). For the shell model MM calculations, we used the GULP code,26 with parameters derived from B3LYP cluster calculations.21 It was shown21 that for this combination of QM and MM methods deprotonation energies of zeolites converge to a constant value with increasing cluster size. This indicates that the polarizable shell-model force field describes the electrostatic interactions as accurately as the B3LYP functional.
3. Results
3.1 H-CHA
The H-CHA zeolite is chosen as a reference system because it consists of hexagonal prisms as secondary building units like the H-2dH zeolite (Fig. 1).9 All tetrahedral atoms of H-CHA are crystallographically equivalent (Fig. 1) and there are only four distinct oxygen positions.28 The energies of structures with the proton attached to different oxygen positions are similar,25 therefore we calculate deprotonation energies for the lowest energy structure only, i.e. with the proton attached to the O1 oxygen. We used a unit cell consisting of 37 atoms,20,21 with HAlSi11O24 composition and cell parameters optimised using the shell model potential (see Table S2 in the ESI†). These unit cell parameters were fixed during subsequent structure optimisation of protonated and deprotonated forms of the zeolite, for which we used the following convergence criteria: a maximum energy change of 1 × 10⁻⁵ eV, a maximum gradient component of 1 × 10⁻² eV Å−1, and a maximum displacement component of 1 × 10⁻³ Å. Cluster models of increasing size were generated automatically by selecting only those tetrahedral sites which were within a defined distance from the O1 site.
 |
| | Fig. 1 Optimized 2 × 2 × 2 unit cell of H-CHA zeolite together with the numbering of oxygen atoms. The following colour scheme is adopted: silicon, oxygen, aluminium and hydrogen are depicted in yellow, red, grey and white, respectively. The pictures of molecular models were generated using the Jmol program.27 | |
The QM clusters were always terminated with OH groups with a fixed OH distance of 96.1 pm (Fig. 2). This is an equilibrium distance that we obtained by free cluster optimization of similar cluster models.
 |
| | Fig. 2 Cluster models applied in QM/MM calculations of the H-CHA deprotonation energy. | |
To compare Leslie–Gillan deprotonation energies (eqn (9)) with those obtained using the supercell method we performed calculations for an embedded 8T12OH cluster model (eight tetrahedral sites terminated by 12 OH groups) with increasing supercell size from 2 × 2 × 2 to 4 × 4 × 4. Fig. 3 and Table 1 show that the corrected deprotonation energies of both methods, ΔELGDP and ΔE∞DP, agree within 0.6 kJ mol−1.
 |
| | Fig. 3 Uncorrected deprotonation energies of the 8T12OH cluster model of H-CHA embedded in N × N × N supercells (black dots). The solid line is the fitting curve, eqn (8). Deprotonation energies corrected using the LG method (red triangles) as a function of the cubic root of the unit cell volume and extrapolated deprotonation energy (dashed line). | |
Table 1 Deprotonation energies (kJ mol−1) and their components for the 8T12OH cluster model of H-CHA embedded in different N × N × N supercells: ΔELGDP and ΔE∞DP – deprotonation energies calculated using the Leslie–Gillan (LG) and supercell (SC) methods, respectively; ΔEDP(QM/MM) and ΔEDP(QM) – (uncorrected) QM/MM deprotonation energy and its QM part, respectively. Dielectric constants calculated as 1/3 of the trace of the dielectric constant matrix at the MM level (shell-model potential) (LG), and calculated from eqn (10) using the fitted parameters A and B, and εeff(SC)
| Unit cell |
2 × 2 × 2 |
3 × 3 × 3 |
4 × 4 × 4 |
|
Eqn (9).
Eqn (10).
|
| ΔELGDP |
1238.0 |
1238.0 |
1238.0 |
|
E
−−/ε(LG)a |
−37.6 |
−24.9 |
−18.6 |
| ΔEDP(QM/MM) |
1200.4 |
1213.1 |
1219.4 |
| ΔEDP(QM) |
1291.7 |
1292.4 |
1292.3 |
| ΔE∞DP |
1238.6 |
1238.6 |
1238.6 |
|
A/〈r−−〉b |
−38.42 |
−25.61 |
−19.22 |
|
B/〈r−−〉3b |
0.22 |
0.07 |
0.02 |
|
ε(LG) |
2.79 |
2.81 |
2.83 |
|
ε
eff(SC) |
2.75 |
2.74 |
2.74 |
The increase of ΔEDP(QM/MM) with increasing cell size is perfectly compensated by the decrease of the aperiodic correction, E−−/ε(LG) (Leslie–Gillan method) or by the decrease of the A/〈r−−〉, +B/〈r−−〉3 correction term (super-cell method) so that the ΔELGDP and ΔE∞DP values, respectively, are perfectly converged already for the smallest 2 × 2 × 2 cell.
The dielectric constants calculated from the fitted parameters A and B (Fig. 3) and the average dielectric constants calculated for the LG correction method from the shell-model potential are virtually identical. The variation of ε(LG) with the cell size is less than 2%, with the cluster size (Table 2) being slightly larger, 5%.
Table 2 Deprotonation energy components (kJ mol−1) for various embedded cluster models of the H-CHA zeolite embedded in a 2 × 2 × 2 supercell. See Table 1 for definitions
| Model |
ΔELGDP |
E
−−/ε(LG)a |
ΔEDP |
ΔEDP(QM) |
ΔE∞LRb |
ε(LG) |
|
Eqn (9).
Long range correction for LG corrected deprotonation energy, see eqn (13).
Cluster models embedded in a 3 × 3 × 3 supercell.
|
| MM |
1036.4 |
−34.0 |
1002.3 |
— |
— |
3.09 |
| 8T12OH |
1238.0 |
−37.6 |
1200.4 |
1291.7 |
−53.7 |
2.79 |
| 12T12OH |
1239.3 |
−36.1 |
1203.1 |
1276.4 |
−37.1 |
2.91 |
| 16T16OH |
1237.4 |
−36.8 |
1200.7 |
1290.7 |
−53.3 |
2.86 |
| 33T34OHc |
1233.5 |
−24.7 |
1208.8 |
1267.3 |
−33.8 |
2.83 |
| 44T34OHc |
1232.5 |
−24.0 |
1208.5 |
1267.1 |
−34.6 |
2.92 |
The QM part of the deprotonation energy is almost independent of the supercell size. This shows that the cluster structure is not affected by the unit cell size and structural distortions do not extend beyond the 2 × 2 × 2 supercell. In absolute terms, the charge–charge interaction, A/〈r−−〉, is more than two orders of magnitude larger than the dipole–dipole aperiodic correction term, B/〈r−−〉3 (Table 1). This supports the assumption of Leslie and Gillan that the aperiodic correction is given by the charge–charge interaction. We use the A/〈r−−〉 term only to correct all subsequent deprotonation energies of the H-CHA zeolite.
The results obtained with embedded clusters of increasing size (Table 2) show that the corrected deprotonation energies of the H-CHA zeolite converge to 1233 ± 5 kJ mol−1. This energy is in very good agreement with the value of 1231 kJ mol−1, determined using the QM/MM methodology with a smaller basis set,29 and with the value of 1235 kJ mol−1 obtained from the planewave DFT calculation with the BLYP functional (corrected for the systematic error of the functional).29 A periodic planewave DFT calculation with the PW91 functional yields a deprotonation energy of 1176 kJ mol−1,30 but this value does not include the aperiodic correction and should be compared with our uncorrected value, 1164 kJ mol−1. The remaining difference is small due to different basis sets and density functionals.
As we can see from Table 2, increasing the cluster size decreases the QM contribution of the deprotonation energy and simultaneously increases the total long range correction by almost the same value. This shows that the force field describes the electrostatic interaction consistent with the (B3LYP) functional used for its parametrization. This has been documented before for Hartree–Fock calculations with correspondingly parametrized force fields.18 Geometric parameters of the acidic site are not strongly affected by the size of the QM region, and their values converge to constant values with increasing cluster size (see ESI,† Table S3). These all facts prove that the applied QM/MM methodology is appropriate to describe the properties of zeolites. Therefore, it can be used to predict the deprotonation energy of the H-2dH system.
3.2 Ultra-thin H-2dH zeolite
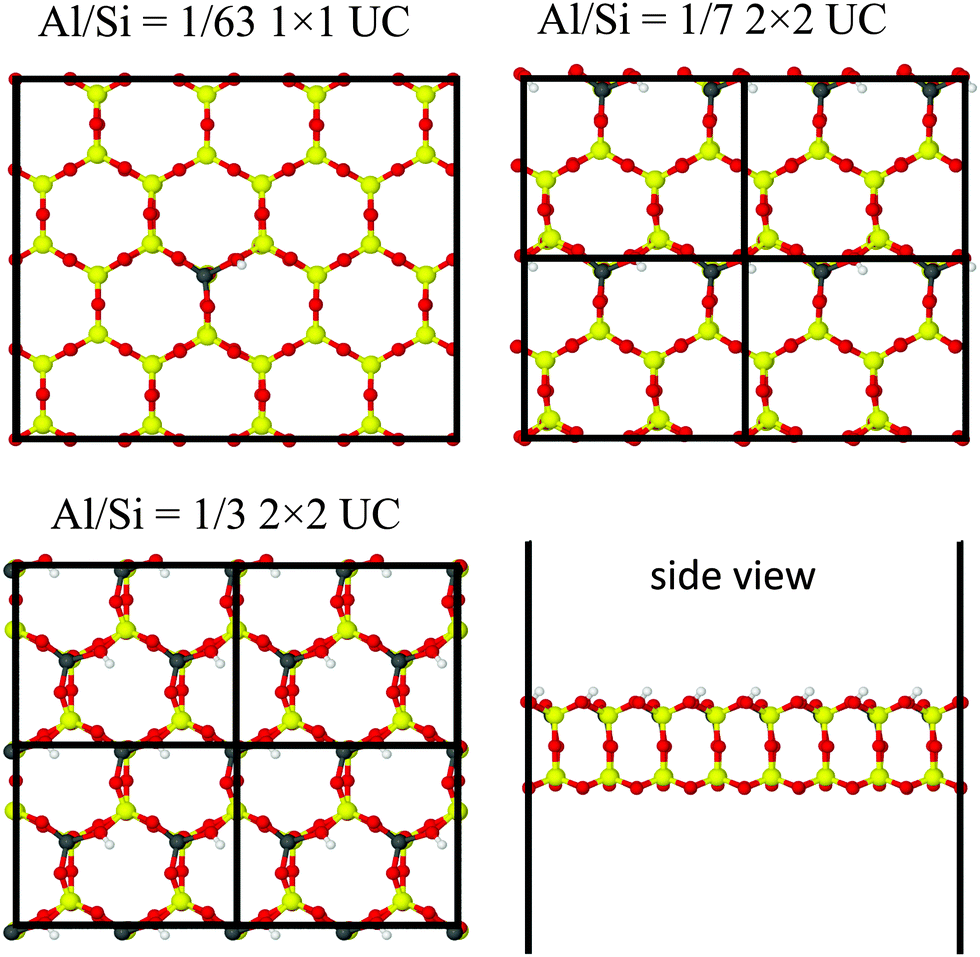
To study the acidity of the ultra-thin H-2dH zeolite, we performed calculations for cells of HnAlnSi64−nO128 with increasing Al/Si ratio (Fig. 4), namely 1/63 (n = 1), 1/7 (n = 8) and 1/3 (n = 16). The cells for the different Al/Si ratio have the same size, but correspond to 1 × 1, 2 × 2, and 2 × 2 supercells, respectively, because the size of the primitive cells differs.
 |
| | Fig. 4 Optimized cells of the H-2dH zeolite with different Al/Si ratios. | |
Experimentally, two-dimensional zeolites were prepared on a Ru(0001) substrate.8,9,31 However the interaction between zeolite and the substrate was found to be weak31 and we excluded the ruthenium layer from our computational models. We applied 2D periodic boundary conditions and calculated electrostatic interactions using the Perry summation technique,32,33 implemented in the GULP code.26 This was necessary because for standard slab calculations the energy of the charged system increases linearly with the vacuum thickness, and diverges in the limit of infinite values.34
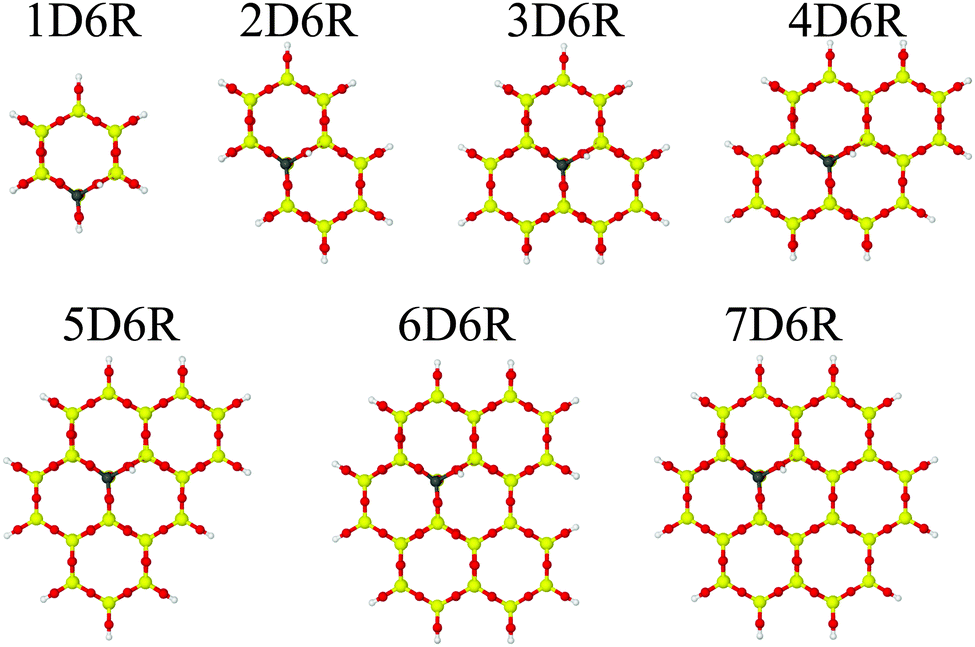
First, we optimized the unit cell parameters using the shell model potential, which were kept fixed during all subsequent calculations. We prepared clusters of increasing size starting from a single hexagonal prism containing a Brønsted site (1D6R model) and adding up to 6 adjoining hexagonal prisms forming the 7D6R model (Fig. 5).
 |
| | Fig. 5 Cluster models applied in QM/MM calculations of the H-2dH deprotonation energy (Al/Si = 1/63, models for the other Al/Si ratios are presented in Fig. S1 and S2 in the ESI†). | |
In some cases it was necessary to add some extra tetrahedral sites to avoid terminal O–H groups that are connected to neighbouring Brønsted sites. These additional T-sites are indicated by a subscript, e.g. 4D6R+4T stands for four additional tetrahedral sites added to the 4DR6 cluster. Cluster models were terminated in the same way as for the H-CHA zeolite.
The simple Leslie–Gillan method of aperiodic corrections is not applicable to the H-2dH system. For the two-dimensional case, the macroscopic approximation is not valid anymore. To calculate corrected deprotonation energies for the H-2dH zeolites, we used the supercell extrapolation method which is computationally demanding. The original unit cells were multiplied in ![[a with combining right harpoon above (vector)]](https://www.rsc.org/images/entities/i_char_0061_20d1.gif) and
and ![[b with combining right harpoon above (vector)]](https://www.rsc.org/images/entities/i_char_0062_20d1.gif) directions and extrapolation curves, eqn (8), were fitted as a function of the square root of the surface area. A series of three supercells per each system, namely 1 × 1, 2 × 2, and 3 × 3 for Al/Si = 1/63, and 2 × 2, 3 × 3, and 4 × 4 for Al/Si = 1/7 and 1/3, were used to extrapolate deprotonation energies. All supercell structures were optimized, both the protonated and deprotonated forms. The resulting fitting parameters and correction energies are presented in the ESI,† Table S4 and Fig. S3.
directions and extrapolation curves, eqn (8), were fitted as a function of the square root of the surface area. A series of three supercells per each system, namely 1 × 1, 2 × 2, and 3 × 3 for Al/Si = 1/63, and 2 × 2, 3 × 3, and 4 × 4 for Al/Si = 1/7 and 1/3, were used to extrapolate deprotonation energies. All supercell structures were optimized, both the protonated and deprotonated forms. The resulting fitting parameters and correction energies are presented in the ESI,† Table S4 and Fig. S3.
For each Al/Si ratio the fitted parameters A and (especially) B depend on the cluster model. Nevertheless, the correction energies, Ecorr (eqn (8)), are almost constant within 6 kJ mol−1. This means that one can calculate the aperiodic correction energy using the supercell approach for only one embedded cluster model, or even at the MM level, and then apply this correction for different embedded cluster models of the same unit cell, tolerating an error of about 6 kJ mol−1.
The fitted A parameters are much larger for H-2dH (ESI,† Table S4) than for H-CHA (Fig. 3). This shows that in the two-dimensional H-2dH zeolite the interaction between charged defects is much less screened than that in the bulk H-CHA zeolite. This is also reflected in very small effective dielectric constants of H-2dH, 1.5–1.8 (Table 3), compared to 2.9–3.1 for H-CHA (Table 2).
Table 3 Deprotonation energy components (kJ mol−1) calculated for various embedded cluster models of H-2dH zeolites for different Al/Si ratios using the supercell (SC) method
| Al/Si |
Model |
ΔE∞DP |
ΔEQM |
ΔE∞LR |
E
rel
|
E
corr(SC)
|
ε
eff(SC) |
|
2 × 2 cell, 〈r−−〉 = 39.9 Å.
4 × 4 cell, 〈r−−〉 = 40.0 Å.
4 × 4 cell, 〈r−−〉 = 40.2 Å.
E
corr(SC), and εeff(SC) taken from the 4R6 model.
E
corr(SC), and εeff(SC) taken from the 2R6 model.
|
| 1/63a |
MM |
836.1 |
— |
— |
−184.3 |
−44.3 |
1.529 |
| 1D6R |
1032.1 |
1277.9 |
−245.8 |
−144.6 |
−42.9 |
1.579 |
| 2D6R |
1037.4 |
1244.7 |
−208.5 |
−139.9 |
−42.9 |
1.579b |
| 3D6R |
1041.0 |
1232.6 |
−182.0 |
−143.2 |
−45.3 |
1.493 |
| 4D6R |
1041.5 |
1227.2 |
−185.7 |
−137.5 |
−42.1 |
1.607 |
| 5D6R |
1042.8 |
1217.6 |
−174.9 |
−137.3 |
−42.1d |
1.607d |
| 6D6R |
1044.8 |
1213.3 |
−168.7 |
−137.4 |
−42.1d |
1.607d |
| 7D6R |
1045.0 |
1210.1 |
−165.1 |
−136.9 |
−42.1d |
1.607d |
|
|
| 1/7b |
MM |
870.8 |
— |
— |
−191.3 |
−42.5 |
1.591 |
| 1D6R+2T |
1049.3 |
1320.4 |
−271.2 |
−142.5 |
−37.9 |
1.781 |
| 2D6R+4T |
1072.1 |
1249.2 |
−177.1 |
−137.2 |
−44.3 |
1.523 |
| 3D6R+2T |
1073.6 |
1238.3 |
−164.7 |
−137.8 |
−44.3e |
1.523e |
| 4D6R |
1068.9 |
1235.9 |
−167.0 |
−135.8 |
−36.7 |
1.840 |
| 7D6R+4T |
1071.8 |
1229.4 |
−157.6 |
−134.5 |
−37.9 |
1.778 |
|
|
| 1/3c |
MM |
890.3 |
— |
— |
−181.9 |
−41.8 |
1.591 |
| 1D6R+4T |
1069.6 |
1290.0 |
−220.4 |
−143.0 |
−41.3 |
1.636 |
| 4D6R+4T |
1090.6 |
1241.3 |
−150.7 |
−138.7 |
−43.0 |
1.570 |
The extrapolated deprotonation energies of the H-2dH zeolites converge to constant values with increasing embedded cluster size (Table 3 and ESI,† Fig. S4), which is also true for the geometrical parameters of the Brønsted sites (see ESI,† Table S5). The deprotonation energies of all studied H-2dH systems are much lower than those of H-CHA. Even the least acidic two-dimensional system with Al/Si = 1/3 has a deprotonation energy (1091 kJ mol−1) which is 142 kJ mol−1 lower than that of H-CHA with Al/Si = 1/12.
Table 4 compares calculated deprotonation energies and their components for H-2dH with different Al/Si ratios with those for H-CHA. The table shows that the QM part of the deprotonation energy is significantly smaller for H-2dH than that for H-CHA. Nevertheless, the decisive factor for the very low deprotonation energy of two-dimensional zeolites is the long-range term, which (in absolute terms) is a few times larger than that for H-CHA.
Table 4 Calculated deprotonation energies and their components (kJ mol−1) for two-dimensional zeolites with different Al/Si ratios compared to H-CHA
| Systema |
Model |
ΔE∞DP |
ΔEDP(QM) |
ΔE∞LR |
E
rel
|
ε
eff(SC) |
|
Al/Si ratio is in parentheses.
3 × 3 × 3 unit cell.
2 × 2 unit cell.
4 × 4 unit cell.
|
| H-CHA (1/11) |
44T32OHb |
1233 |
1267 |
−35 |
−144 |
2.92 |
| H-2dH (1/63) |
4D6Rc |
1042 |
1227 |
−186 |
−138 |
1.61 |
| H-2dH (1/7) |
4D6Rd |
1069 |
1236 |
−167 |
−136 |
1.84 |
| H-2dH (1/3) |
4D6R+4Tc |
1091 |
1241 |
−151 |
−139 |
1.57 |
The long-range component of the deprotonation energy results from the interactions between the inner part (cluster model) and its periodic surroundings. Upon removing the proton there is a change in the electrostatic (Coulomb and polarization) part of these interactions. The negative charge created upon deprotonation is stabilized by its surroundings. This stabilization is maximum if there is no screening of the created charge (ε = 1). The more efficient the screening (the larger ε), the smaller is the electrostatic stabilization of the created charge. For the H-2dH zeolites the dielectric constant is relatively small, therefore the created charge is more stabilized by the crystal field than the one in H-CHA. If this interpretation is correct, one should observe a dependence of the deprotonation energy of zeolites on their dielectric constant.
The geometric parameters of the Brønsted sites of H-2dH (Al/Si = 1/63) and H-CHA are almost the same (see ESI,† Tables S1 and S2) and the relaxation energies, Erel, of two-dimensional and bulk zeolites (Table 4) are also very similar. Both these facts confirm that differences in long range electrostatic interactions are indeed responsible for the observed differences in deprotonation energies.
3.3 Effect of the Al/Si ratio
The deprotonation energy of the H-2dH zeolites increases with increasing Al/Si ratio (Table 4 and Fig. S4 in the ESI†). This behaviour was found in a number of experimental12,35,36 and theoretical studies.37–39 It suggests that an important factor governing the acidity of the Brønsted site is its local environment, i.e. the number of AlO4 tetrahedra in the second coordination sphere of the particular acidic site.12,35–38,40,41 An increase in the Al/Si ratio also affects the structure of the protonated and the deprotonated Brønsted sites (Table S5 in the ESI†), namely it decreases the Al–O bond length and the Al–O–Si angle and increases the Si–O bond length. Geometric parameters do not affect the relaxation energy of the anion, which is independent of the Al/Si ratio (Table 4). This suggests that the decrease of the acidity with increase of the Al content is caused mainly by the changes of the electronic structure of the zeolite. In 3D zeolites this effect is localised,37,38 namely it is caused by the interaction of the Brønsted site with its nearest surroundings. However, comparison of the QM and long range contributions of the deprotonation energies of H-2dH zeolites (Table 4) shows that the increase of the Al/Si ratio also affects the long range term.
3.4 Dielectric screening in two-dimensional systems
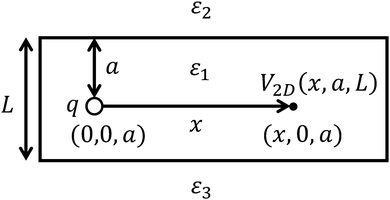
The small dielectric constant of the H-2dH thin film can be explained by classical electrostatics, using the images.42 Let us first consider an electrostatic potential generated by a point charge q immersed in a homogeneous dielectric film, characterised by a dielectric constant ε1 and the thickness L, surrounded by a medium with a dielectric constant ε2 (Fig. 6 with ε3 = ε2).
 |
| | Fig. 6 Model for dielectric constant calculations. | |
The charge placed in the point (0, 0, a) generates the following potential (in atomic units) at the point (x, 0, a):43
| |  | (16a) |
With
| |  | (16b) |
| |  | (16c) |
Let us now consider an electrostatic potential generated by the point charge
q immersed in the homogenous dielectric medium of a bulk system, characterized by the dielectric constant
ε. At a distance
x from the charge the potential (in atomic units) is:
| |  | (17) |
By comparison of
eqn (16a) and (17) we can determine the effective dielectric constant
εeff =
ε at the point (
x, 0,
a) of the dielectric slab:
| |  | (18) |
In contrast to bulk dielectrics, the effective dielectric constant of thin layers depends on the distance from the charge (
Fig. 7). Independent of the sample's thickness, the effective dielectric constant on the surface (
a = 0) changes continuously from (
ε1 +
ε2)/2 near the charge to
ε2 at an infinite distance from it (
Fig. 7). In the case of the H-2dH thin film, for which
ε1 (calculated as 1/3 of the trace of the dielectric constant tensor, which was determined from the shell-model potential calculations) is about 5 and
ε2 is equal to 1 (vacuum), the theoretical dielectric constant should decrease from 3 near the charge to 1 at large distances. During derivation of
eqn (18) a few assumptions were made, among others the assumption of homogenous dielectric medium and the assumption that the border between two dielectric media is sharp. Nevertheless, the calculated dielectric constant (1.6–1.9,
Table 4) falls in the theoretical range (1 <
ε < 3), but a precise theoretical value cannot be specified.
 |
| | Fig. 7 Theoretical effective dielectric constant (eqn (18)) as a function of a distance x from the charge calculated for ε1 = 5.0 and ε2 = 1.0 and different a and L parameters. | |
We can use eqn (18) to predict the qualitative behaviour of zeolite dielectric properties. For example, we know that the effective dielectric constant depends on the distance a from the surface (Fig. 7). In other words, when ε1 > ε2, increasing a increases the dielectric constant. This is an important statement because it means that in the case of two-dimensional zeolites we cannot compare uncorrected deprotonation energies of two different Brønsted sites which are at different distances from the surface, even though the size of the unit cell is the same. This also suggests that the acidity of the Brønsted sites which are deeper in the sample can be lower than of those which are at the surface. The thickness of the sample changes the slope of the dielectric constant curve, namely with decrease of L the curve becomes steeper (Fig. 7). Hence, we can expect that the acidity of the surface Brønsted sites should increase with decrease of the sample thickness. To confirm these predictions, a separate study of the thickness dependence of deprotonation energies for thin H-MFI films6 is underway.
Let us consider the most general situation, namely a thin film characterized by a macroscopic dielectric constant ε1 surrounded by different media at the top and the bottom with dielectric constants ε2 and ε3, respectively. This corresponds to our experimental model system, namely the ultrathin zeolite film deposited on the metal surface (ε3 = ∞) under ultra-high vacuum conditions (ε2 = 1.0). Once again we can apply the macroscopic approximation to calculate the electrostatic potential within a film and subsequently the effective dielectric constant of the film.43Fig. 8 shows the effective dielectric constant within the thin layer as a function of a distance x from the point charge, calculated for different dielectric constants of the bottom layer. The effective dielectric constant on the slab surface (a = 0) changes continuously from (ε1 + ε2)/2 near the charge to (ε2 + ε3)/2 at large distances. It means that in the experimental case the dielectric screening near the charge is smaller than in the bulk zeolite, but for the bigger distances it quickly approaches infinity. Therefore the long range interaction between the active site and the crystal lattice should be much reduced with respect to the system without the metal substrate. If we assume that the influence of the metal substrate on the QM part of the deprotonation energy is not strong (short range interaction) we can expect that the acidity of the ultra-thin zeolite adsorbed on the metallic surface should be reduced with respect to the free-standing film.
 |
| | Fig. 8 Theoretical effective dielectric constant as a function of a distance from the charge calculated for ε1 = 5.0, ε2 = 1.0, L = 5.3 Å, a = 0.0 Å and different dielectric constants of the bottom layer (ε3). | |
3.5 Comparison with OH frequency shifts
Since deprotonation energies cannot be directly measured for solid acids, a linear relationship has been suggested (Paukshtis and Yurchenko)44,45 between the OH frequency shift upon complex formation with a weak base molecule and the enthalpy of deprotonation, ΔHDP (kJ mol−1):| | ΔHDP = 1390 − 442.5·log(Δ![[small nu, Greek, tilde]](https://www.rsc.org/images/entities/i_char_e0e1.gif) OH/ΔSiOH) OH/ΔSiOH) | (19) |
Here, ΔOH and ΔSiOH are the wavenumber shifts for the O–H stretching vibrations of Brønsted sites and free silanols, respectively (in cm−1), caused by the adsorption of weak bases. Because we are interested in the difference between two different zeolites, Δ(ΔEDP), we do not need to know ΔSiOH, which cancels out:| | | Δ(ΔEDP) ≈ Δ(ΔHDP) = −442.5·log(ΔOH(H-2dH)/ΔOH(H-CHA)) | (20) |
The wavenumber shifts upon CO adsorption from ref. 9, which have been calculated for exactly the same Si/Al = 7 bilayer as examined in the present study, yield a deprotonation energy difference of only 12 kJ mol−1, one order of magnitude less than the calculated difference of 164 kJ mol−1 from Table 4. Insertion of experimental values of ΔOH(H-2dH) and ΔOH(H-CHA), 379 and 316 cm−1, respectively,9 into eqn (20) yields a larger deprotonation energy difference of 35 kJ mol−1, but which is still much smaller than the calculated value of 164 kJ mol−1.
The obvious reason for the breakdown of the ΔHDP − ΔOH plot is that the OH stretching frequency shift upon adsorption of CO refers to an “early” stage of the reaction, whereas deprotonation refers to a “late” stage of the catalytic reaction when the proton has been removed. This is consistent with the finding that the much larger acidity “measured” with the deprotonation energy is largely due to the better stabilization of the created negative charge in media with low dielectric constants such as two-dimensional zeolites.
4. Conclusions
QM/MM calculations of deprotonation energies of ultrathin H-2dH zeolites and the bulk H-CHA zeolite confirm the much higher acidity of the ultra-thin zeolites compared to bulk systems, previously observed in experiments.8,9 The very low deprotonation energy of the H-2dH system reflects the fact that the dielectric constant of thin dielectrics immersed in a vacuum is much lower than that of corresponding bulk systems, resulting in a better stabilization of the charge created upon deprotonation. The dielectric constant of a thin film depends on its thickness and on the distance of the charge from the surface. This suggests that the properties of acidic sites in ultra-thin zeolites6,7 and single layer zeolites8,9 vary with their distance from the surface and can be tuned by changing the sample's thickness. Another consequence is that the acidity of two-dimensional systems as judged upon deprotonation energies is much larger than OH frequency shifts upon adsorption of base molecules indicated.
Acknowledgements
This work has been supported by the German Research Foundation (DFG) through Collaborative Research Center Grant CRC 1109. The authors would like to thank Milan Ončák and Radosław Włodarczyk for helpful discussions.
References
- A. Corma, Chem. Rev., 1995, 95, 559 CrossRef CAS.
- A. Corma, J. Catal., 2003, 216, 298 CrossRef CAS.
- W. O. Haag, R. M. Lago and P. B. Weisz, Nature, 1984, 309, 589 CrossRef CAS PubMed.
- W. J. Mortier, J. Sauer, J. A. Lercher and H. Noller, J. Phys. Chem., 1984, 88, 905 CrossRef CAS.
- W. J. Roth, P. Nachtigall, R. E. Morris and J. Čejka, Chem. Rev., 2014, 114, 4807 CrossRef CAS PubMed.
- M. Choi, K. Na, J. Kim, Y. Sakamoto, O. Terasaki and R. Ryoo, Nature, 2009, 461, 246 CrossRef CAS PubMed.
- Y. Seo, K. Cho, Y. Jung and R. Ryoo, ACS Catal., 2013, 3, 713 CrossRef CAS.
- J. A. Boscoboinik, X. Yu, B. Yang, F. D. Fischer, R. Włodarczyk, M. Sierka, S. Shaikhutdinov, J. Sauer and H.-J. Freund, Angew. Chem., Int. Ed., 2012, 51, 6005 CrossRef CAS PubMed.
- J. A. Boscoboinik, X. Yu, E. Emmez, B. Yang, S. Shaikhutdinov, F. D. Fischer, J. Sauer and H.-J. Freund, J. Phys. Chem. C, 2013, 117, 13547 CAS.
- A. Zecchina, G. Spoto and S. Bordiga, Phys. Chem. Chem. Phys., 2005, 7, 1627 RSC.
- J. Sauer, J. Mol. Catal., 1989, 54, 312 CrossRef CAS.
- W. E. Farneth and R. J. Gorte, Chem. Rev., 1995, 95, 615 CrossRef CAS.
- E. G. Derouane, J. C. Védrine, R. R. Pinto, P. M. Borges, L. Costa, M. A. N. D. A. Lemos, F. Lemos and F. R. Ribeiro, Catal. Rev., 2013, 55, 454 CAS.
- J. E. Bartmess, J. A. Scott and R. T. McIver, Jr., J. Am. Chem. Soc., 1979, 101, 6046 CrossRef CAS.
- H. V. Brand, L. A. Curtiss and L. E. Iton, J. Phys. Chem., 1993, 97, 12773 CrossRef CAS.
- M. Brändle and J. Sauer, J. Am. Chem. Soc., 1998, 120, 1556 CrossRef.
- M. Leslie and M. J. Gillan, J. Phys. C: Solid State Phys., 1985, 18, 973 CrossRef CAS PubMed.
- U. Eichler, M. Brändle and J. Sauer, J. Phys. Chem. B, 1997, 101, 10035 CrossRef CAS.
- U. Eichler, C. Kölmel and J. Sauer, J. Comput. Chem., 1997, 18, 463 CrossRef CAS.
- M. Sierka and J. Sauer, J. Chem. Phys., 2000, 112, 6983 CrossRef CAS PubMed.
- M. Sierka and J. Sauer, Faraday Discuss., 1997, 106, 41 RSC.
- TURBOMOLE V6.4; a development of the University of Karlsruhe and Forschungszentrum Karlsruhe GmbH, http://www.turbomole.com, 2012.
- F. Weigend, M. Häser, H. Patzelt and R. Ahlrichs, Chem. Phys. Lett., 1998, 294, 143 CrossRef CAS.
- F. Weigend and R. Ahlrichs, Phys. Chem. Chem. Phys., 2005, 7, 3297 RSC.
- M. Sierka and J. Sauer, J. Phys. Chem. B, 2001, 105, 1603 CrossRef CAS.
- J. D. Gale, J. Chem. Soc., Faraday Trans., 1997, 93, 629 RSC.
- Jmol: an open-source Java viewer for chemical structures in 3D, http://www.jmol.org/.
- M. Calligaris, G. Nardin, L. Randaccio and P. C. Chiaramonti, Acta Crystallogr., 1982, 38, 602 CrossRef.
- J. Sauer, K.-P. Schröder and V. Termath, Collect. Czech. Chem. Commun., 1998, 63, 1394 CrossRef CAS.
- C. Lo and B. L. Trout, J. Catal., 2004, 227, 77 CrossRef CAS PubMed.
- R. Włodarczyk, M. Sierka, J. Sauer, D. Löffler, J. J. Uhlrich, X. Yu, B. Yang, I. M. N. Groot, S. Shaikhutdinov and H. J. Freund, Phys. Rev. B: Condens. Matter Mater. Phys., 2012, 85, 085403 CrossRef.
- D. E. Parry, Surf. Sci., 1975, 49, 433 CrossRef CAS.
- D. E. Parry, Surf. Sci., 1976, 54, 195 CrossRef.
- E. Wasserman, J. R. Rustad and A. R. Felmy, Surf. Sci., 1999, 424, 19 CrossRef CAS.
- H. Stach, J. Jaenchen, H. G. Jerschkewitz, U. Lohse, B. Parlitz and M. Hunger, J. Phys. Chem., 1992, 96, 8480 CrossRef CAS.
- B. Gil, E. Broclawik, J. Datka and J. Klinowski, J. Phys. Chem., 1994, 98, 930 CrossRef CAS.
- L. Grajciar, C. O. Arean, A. Pulido and P. Nachtigall, Phys. Chem. Chem. Phys., 2010, 12, 1497 RSC.
- M. Sierka, U. Eichler, J. Datka and J. Sauer, J. Phys. Chem. B, 1998, 102, 6397 CrossRef CAS.
- A. G. Pel'menshchikov, E. A. Paukshtis, V. G. Stepanov, V. I. Pavlov, E. N. Yurchenko, K. G. Ione, G. M. Zhidomirov and S. Beran, J. Phys. Chem., 1989, 93, 6725 CrossRef.
-
G. M. Zhidomirov and V. B. Kazansky, in Advances in Catalysis, ed. D. D. Eley, H. Pines and P. B. Weisz, Academic Press, 1986, vol. 34, p. 131 Search PubMed.
- J. Datka and B. Gil, J. Catal., 1994, 145, 372 CrossRef CAS.
-
J. Jackson, Classical Electrodynamics, Wiley, 3rd edn, 1998 Search PubMed.
- M. Kumagai and T. Takagahara, Phys. Rev. B: Condens. Matter Mater. Phys., 1989, 40, 12359 CrossRef CAS.
- E. A. Paukshtis, R. I. Soltanov and E. N. Yurchenko, React. Kinet. Catal. Lett., 1981, 16, 93 CrossRef.
- A. P. Evgenii and E. N. Yurchenko, Russ. Chem. Rev., 1983, 52, 242 CrossRef PubMed.
Footnote |
| † Electronic supplementary information (ESI) available: Unit cell parameters, geometric parameters, figures of cluster models, and additional results for deprotonation energies as well as x, y, and z coordinates for selected structures. See DOI: 10.1039/c5cp05088j |
|
| This journal is © the Owner Societies 2015 |
Click here to see how this site uses Cookies. View our privacy policy here. 
 Open Access Article
 This Open Access Article is licensed under a
  , can be defined as the average distance between the charged defect and its nearest periodic images, 〈r−