
 Open Access Article
 This Open Access Article is licensed under a
 Creative Commons Attribution 3.0 Unported Licence
Dynamics of ultrathin gold layers on vitreous silica probed by density functional theory
Carolin
Hühn
,
Lothar
Wondraczek
and
Marek
Sierka
*
Otto Schott Institute of Materials Research, Friedrich Schiller University of Jena, Löbdergraben 32, 07743 Jena, Germany. E-mail: marek.sierka@uni-jena.de
First published on 16th September 2015
Abstract
The structure and properties of Au ultrathin films on hydroxyl-free and hydroxylated silica glass surfaces are investigated using ab initio molecular dynamics simulations. Substantial surface structure dependence of Au agglomeration behavior (solid-state dewetting) is found. On hydroxyl-free surfaces, the Au film virtually undergoes instantaneous agglomeration accompanied by the formation of voids exposing a bare silica glass surface. In contrast, simulated annealing of the Au film on hydroxylated surface models leaves its structure unchanged within the simulation time. This points to a key role of reactive defect sites in the kinetics of solid-state dewetting processes of metals deposited on the glass surface. Such sites are important for initial void nucleation and formation of metal clusters. In addition, our calculations demonstrate the crucial role of the appropriate inclusion of dispersion interactions in density functional theory simulations of metals deposited on glass surfaces. For defective, hydroxyl-free glass surfaces the dispersion correction accounts for 35% of the total adhesion energy. The effect is even more dramatic for hydroxylated glass surfaces, where adhesion energies are almost entirely due to dispersion interactions. The Au adhesion energies of 200 and 160 kJ (mol nm2)−1 calculated for hydroxylated glass surfaces are in good agreement with the experimental data.
1. Introduction
Ultrathin metal layers and metal clusters deposited on silica and silicate glasses play an important role in a broad variety of technical applications ranging from architecture and automotive glazing to electronic devices, sensor technology and catalysis.1–8 In particular, continuous layers, particulate deposits and clusters of noble metals have attained key importance due to their high imaginary part of the refractive index and, consequently, high optical reflectivity along with the specific position of their plasmonic resonance frequency. This enables a precise control of spectral reflection and transmission (e.g., for low-emissivity and solar protection windows) as well as other properties such as their catalytic or antimicrobial activity.9,10 Tailoring of the metal layer structure and thickness (usually between a monolayer and a few nm), controlling the formation of atomic agglomerates, cluster deposits or nanoparticles, is the essential step in all these applications. It has been shown that film homogeneity and noble metal agglomeration behavior very strongly depend on subtle variations in the substrate conditions such as the degree of surface hydroxylation.11During the deposition process but also during off-line annealing or long-term operation thin metal films can disintegrate into particles, even upon annealing at temperatures well below the melting point, for example, through solid-state dewetting.12–18 It is assumed that this process proceeds in three steps: (i) void initiation, (ii) void growth and (iii) void coalescence and particle formation.17 It has further been postulated that the initial voids form at grain boundaries, vacancies, impurities or pores.15–17 However, the role of surface defect sites of substrates in the solid-state dewetting process has been largely disregarded in this context. The present hypothesis is that voids, initiated by any nucleation center, grow towards the film surface. The time needed for this process is called incubation time, ranging typically from some minutes to hours, depending on film thickness and annealing temperature.17 After breaking through the entire film, the voids grow and coalesce to form metal particles. However, Seguini et al.18 have found that ultrathin Au films (0.5 to 6 nm thickness) deposited at room temperature on amorphous SiO2 by means of e-beam evaporation spontaneously aggregate, forming nanoparticles without any additional thermal treatment.
Computational studies of noble metal agglomeration on silica surfaces are so far scarce.19 To our best knowledge ab initio investigations of Au on SiO2 surfaces were limited to a single Au atom or an Au dimer interacting with various cluster or crystalline models of silica.20–23 In the present study the structure and properties of Au ultrathin films on hydroxyl-free and hydroxylated silica glass surfaces are investigated for the first time using ab initio molecular dynamics (MD) simulations.
2. Computational details
2.1. General simulation procedure
Fig. 1 depicts the simulation procedure applied in this work. As the first step models of bulk silica glass were generated through simulated melting and quenching at the ReaxFF force field24,25 level, starting from β-cristobalite supercells. The reliability of the models was assessed by comparison of the calculated structure and properties with the experimental data for silica glass. In the second step, slab models of hydroxyl-free glass surfaces were cut out of the bulk glass models, annealed using the ReaxFF force field and subsequently optimized at the density functional theory (DFT) level. From this, hydroxylated surface models were obtained by saturating all surface defects with oxygen and hydrogen atoms. Finally, a gold monolayer was deposited on each such surface model and MD simulations at the DFT level were carried out. The final equilibrated structures were optimized at the DFT level and used to evaluate gold-glass adhesion energies.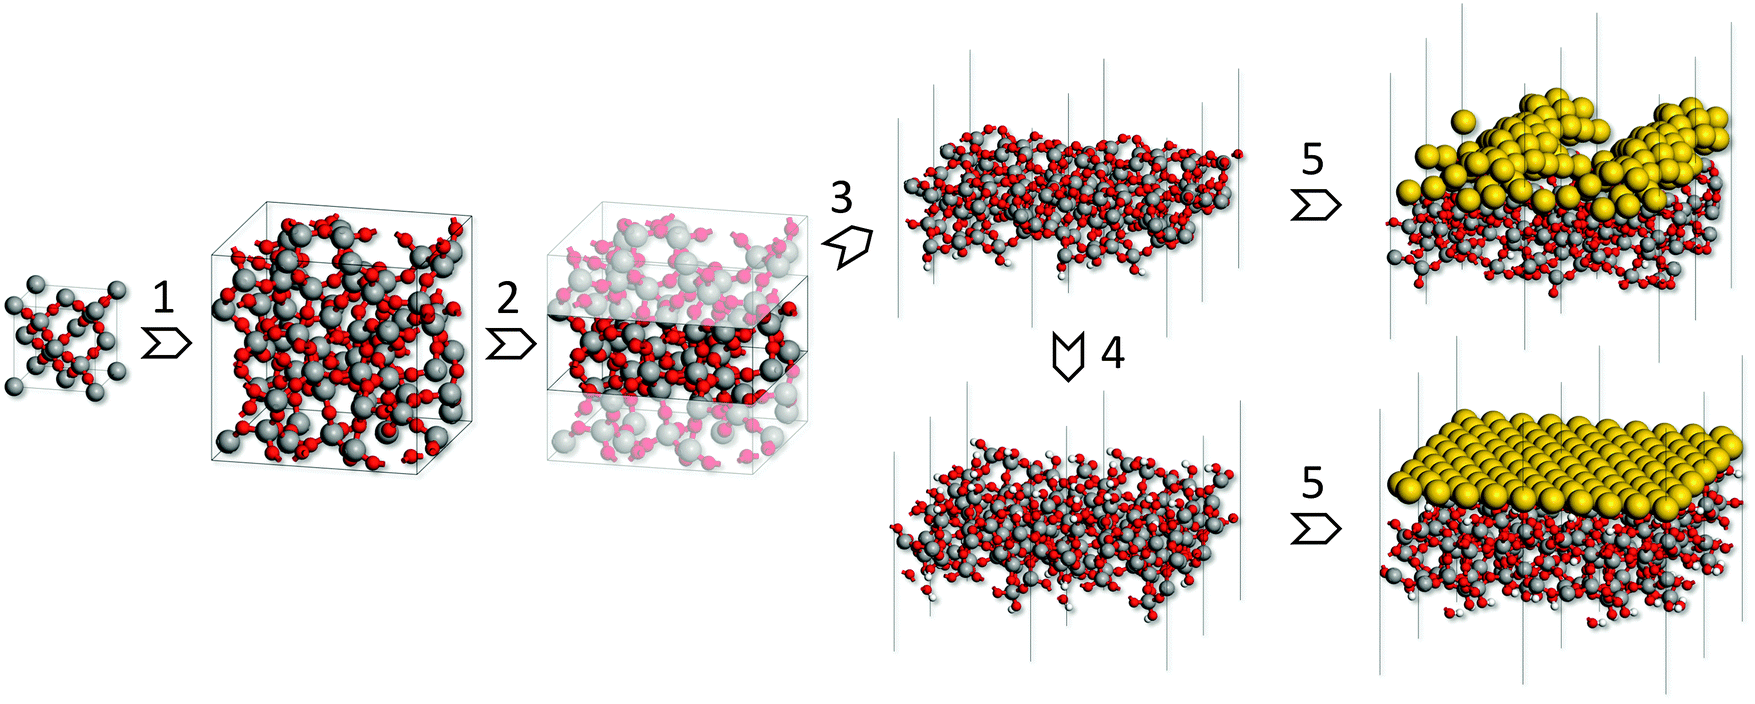 | ||
| Fig. 1 Scheme of the simulation procedure: (1) bulk glass models generated by simulated melting and quenching starting from β-cristobalite supercells; (2) slab construction; (3) hydroxyl-free surface models; (4) hydroxylated surfaces generated by saturation with H atoms/OH groups; (5) deposition of a gold monolayer and MD simulations at the DFT level. (Si: grey, O: red, H: white, Au: yellow). | ||
2.2. Methods
Structural optimizations and MD simulations at the ReaxFF force field24 level were carried out using parameters reported in ref. 25. For all ReaxFF MD simulations, an NVT ensemble with a 0.5 fs time step and linear velocity scaling for cooling procedures was used, employing the LAMMPS (Large-scale Atomic/Molecular Massively Parallel Simulator) program.26Structural optimizations and MD simulations at the DFT level were performed using the Perdew–Burke–Ernzerhof (PBE) exchange–correlation functional27 and the projector-augmented plane-wave (PAW)28,29 method as implemented in the VASP (Vienna ab initio Simulation Package) program.30–33 Unless stated otherwise, a 250 eV cutoff for the plane wave basis set and the Γ point for the integration34 of the first Brillouin zone were used. All MD simulations at the DFT level were performed with a 1 fs time step and linear velocity scaling applied for annealing procedures. For surface models the Grimme dispersion correction (DFT-D3)35 was added. It has been shown that the DFT-D3 method achieves accuracy comparable with CCSD(T). For Au clusters DFT-D3 yields relative energies that are within 8 kJ mol−1 of the CCSD(T) reference values.35
2.3. Bulk glass models
As noted above, bulk glass models were prepared by a simulated melting and quenching process at the ReaxFF force field level. First, supercells of β-cristobalite were constructed as summarized in Table 1. Using MD simulations, each supercell was equilibrated at 8000 K for 175 ps. At every 50 ps, 75 ps, 100 ps, 125 ps, 150 ps, and 175 ps a structure snapshot was taken. The snapshots were cooled down to 300 K within 2 ns, and optimized. The most stable structure for each supercell size, denoted as G2–G8 (cf.Table 1), was used for further calculations. G2 and G3 were subsequently optimized at the DFT level.| Model | Supercell | l | N |
|---|---|---|---|
| G2 | 2 × 2 × 2 | 1.42 | 64 |
| G3 | 3 × 3 × 3 | 2.14 | 216 |
| G4 | 4 × 4 × 4 | 2.85 | 512 |
| G5 | 5 × 5 × 5 | 3.56 | 1000 |
| G6 | 6 × 6 × 6 | 4.27 | 1728 |
| G7 | 7 × 7 × 7 | 4.98 | 2744 |
| G8 | 8 × 8 × 8 | 5.70 | 4096 |
Harmonic vibrational frequencies for G2 were calculated using the density functional perturbation theory36 as implemented in VASP. Infrared intensities were obtained from the matrix of Born effective charges employing the formula given by Baroni et al.37 The vibrational frequencies were scaled38 by 0.9825. This scaling factor was determined by fitting calculated infrared (IR) frequencies to the experimental data.39
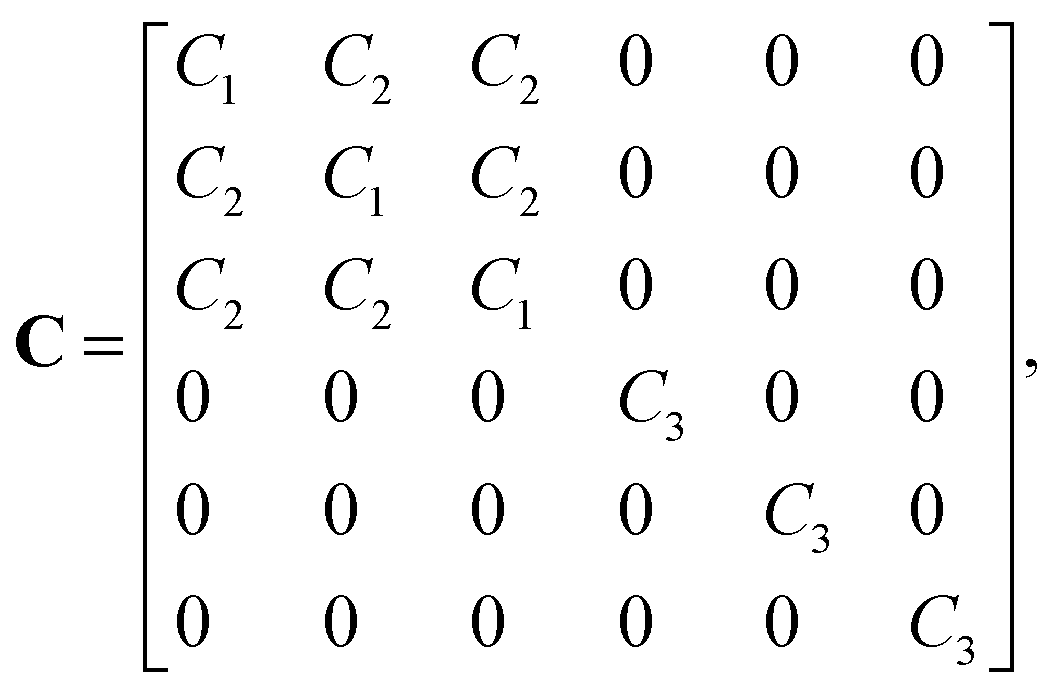
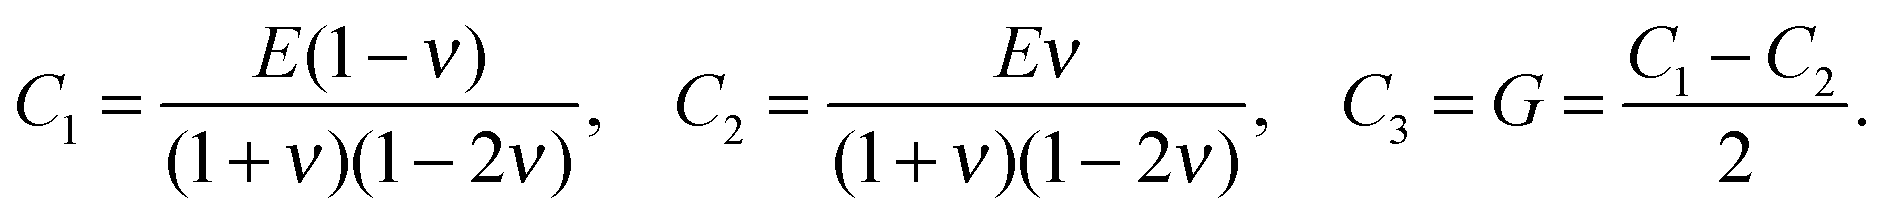
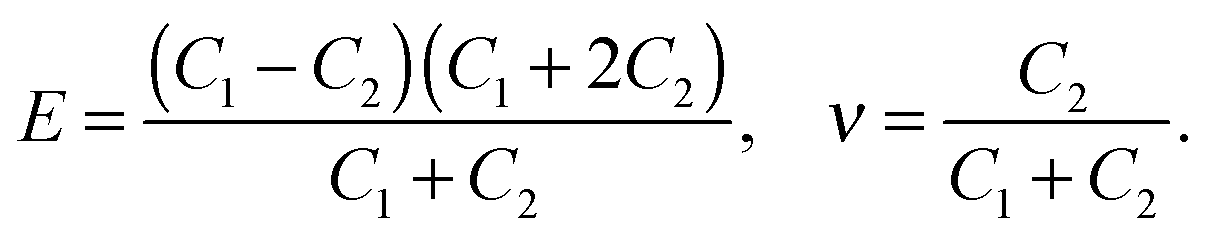
The stiffness tensor C for G2 was calculated at the DFT level using an energy cutoff of 400 eV for the plane wave basis set. Young's modulus E, shear modulus G and the Poisson ratio ν were determined under the conditions of an isotropic material, which leads to the following expression for C:
 | (1) |
 | (2) |
 | (3) |
2.4. Pristine glass surface models
Two slab models of pristine glass surfaces (denoted as S1 and S2) were constructed by cutting two-dimensional, about 9 Å thick slabs out of the G2 model. These slabs were optimized, annealed at 1500 K, cooled down to 300 K within 2 ns and subsequently optimized using the ReaxFF force field. Three-dimensional slab models for DFT calculations were prepared by adding a vacuum gap of 15 Å followed by structural optimization at the DFT level.2.5. Hydroxylated glass surface models
Hydroxylated surface models were prepared by saturating all surface defects (threefold coordinated silicon (Si3), non-bridging oxygen (NBO) and three-membered Si–O rings (3-ring)) of S1 and S2 with oxygen and hydrogen atoms. These hydroxylated slab models hS1 and hS2 were optimized, annealed at 300 K within 2 ns and subsequently optimized using the ReaxFF force field. A vacuum gap of 15 Å was added and the models were optimized at the DFT level.2.6. Gold monolayer models
An fcc gold unit cell was optimized at the DFT level using a 10 × 10 × 10 Monkhorst–Pack grid for the integrations of the first Brillouin zone and a 400 eV cutoff for the plane wave basis set. To deposit an Au film a single (111) 14.5 × 15 Å Au monolayer containing 30 atoms was cut out of the bulk structure. It was compressed to 14.2 × 14.2 Å to fit the dimension of the glass surface models and placed at a distance of approximately 3.5 Å over the surface. The structures were subsequently optimized at the DFT level keeping the cell parameters constant. The glass surface atoms within the upper 5 Å were allowed to relax with the remaining atoms fixed to their original positions so as to mimic bulk glass behavior. Next, the systems were annealed from 1400 K to 300 K within 5 ps using MD calculations at the DFT level and were subsequently optimized.The adhesion energy, Ead, of the gold film was calculated as
 | (4) |
3. Results and discussion
3.1. Glass models
Simulations of amorphous materials usually employ semi-amorphous periodic models. Within this approximation a proper description of the amorphous nature requires sufficiently large simulation cells. Therefore, a number of differently sized cells were generated to identify the limit of percolation at which the ensemble size is sufficiently large to describe the properties of bulk silica glass. Fig. 2 shows two examples of the glass models summarized in Table 1. The differences between the energy per SiO2 unit of models with different sizes are very small, within 1−4 kJ (mol SiO2)−1, for both ReaxFF and DFT methods. This indicates that already the smallest model is suitable to describe vitreous silica, and also validates the accuracy of the ReaxFF force field. For further assessment of the reliability of our model, selected properties were calculated and compared to the experimental data. Fig. 3 shows the comparison of the total correlation function of G2 with the experimental neutron diffraction data for silica glass.40 The agreement between calculated and experimental peak positions is very good. The first peak at 1.61 Å corresponds to the average distance between the nearest Si and O atoms, the second peak at 2.64 Å to the average distance between the nearest O atoms and the peak at 3.08 Å to the average distance between the nearest Si atoms. Table 2 summarizes the average interatomic distances and average bond angles for both ReaxFF and DFT optimized models. Both methods reproduce the experimental average distances very well, with DFT slightly overestimating and ReaxFF slightly underestimating the distances. The absolute errors of the average interatomic distances are between 0.02 and 0.09 Å and the relative errors are between 1.3 and 3.4%. The average bond angles are in very good agreement with the experimental values.41,42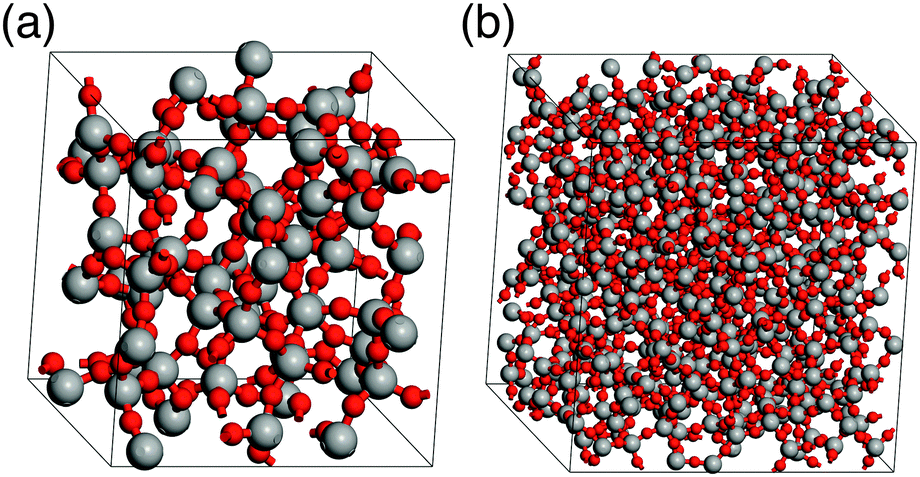 | ||
| Fig. 2 Bulk silica glass models G2 (a) and G5 (b) (see Table 1; Si: grey, O: red). | ||
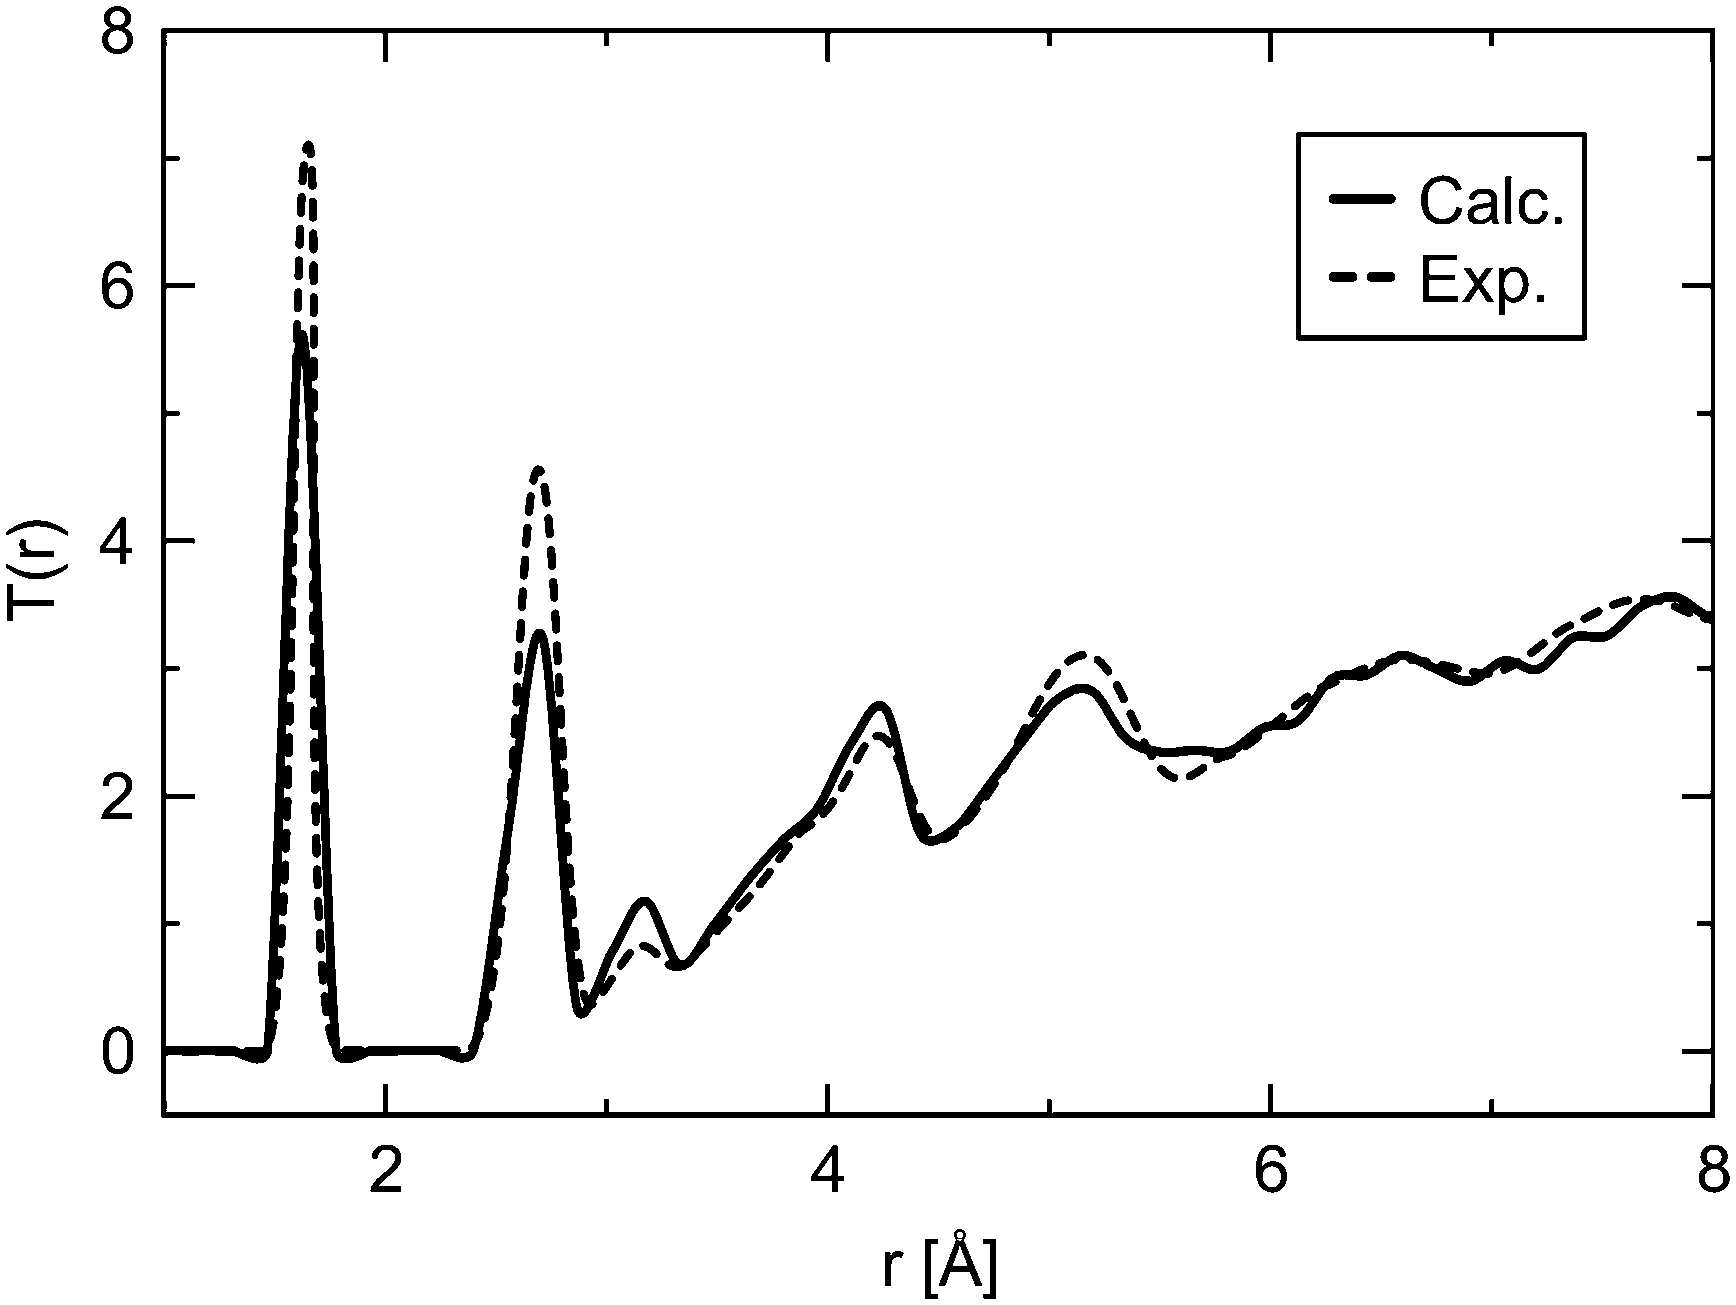 | ||
| Fig. 3 Comparison of the total correlation function T(r) of G2 (solid line, see Table 1) with the experimental40 data (dashed line). | ||
Fig. 4 shows the calculated and experimental39 IR transverse-optic spectra of silica glass with the Si–O–Si rocking vibration at about 457 cm−1, the Si–O–Si symmetrical stretching vibration at about 810 cm−1 and the Si–O–Si asymmetrical stretching vibration at approximately 1076 cm−1. The calculated values are in very good agreement with the experimental39 data. The positions of the adsorption bands are reproduced within 2−6 cm−1.
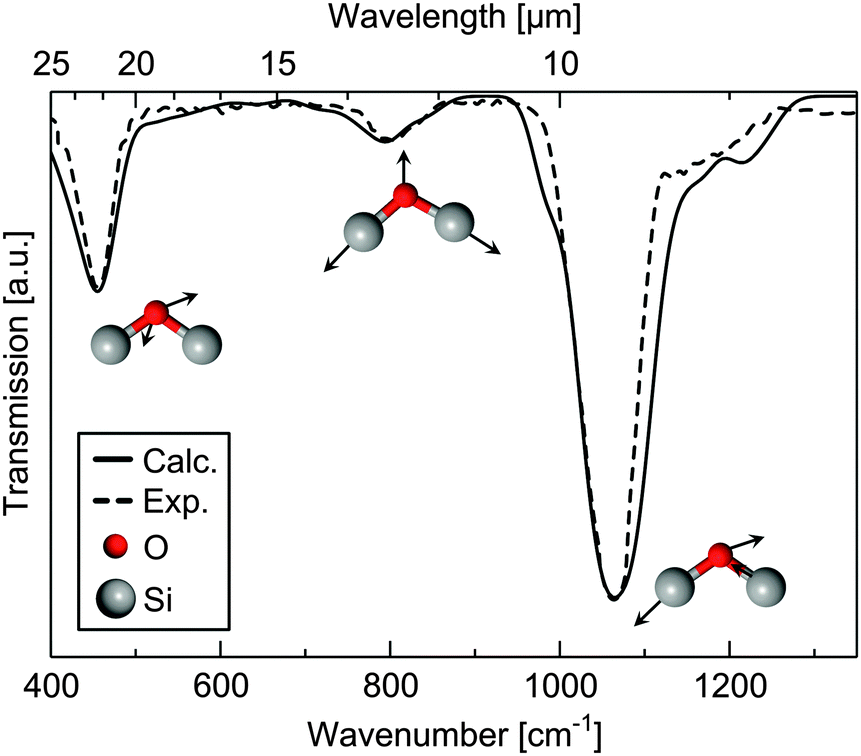 | ||
| Fig. 4 Experimental39 (dashed line) and calculated (G2 model, solid line) infrared spectrum of bulk silica glass. The calculated spectrum is convoluted using a Gaussian line shape function with a half-width of 12 cm−1. | ||
The calculated Young's modulus, the shear modulus and the Poisson ratio of G2 are 95 ± 9 GPa, 35 ± 1 GPa and 0.176 ± 0.02, respectively. The calculated values agree well with the experimental data of 73.5 GPa, 31.5 GPa and 0.17,43 respectively.
In summary, the properties calculated even for the smallest G2 model containing 64 SiO2 units are in very good agreement with the experimental data available for bulk silica glass. This confirms the validity of our procedure for generating glass models.
3.2. Glass surfaces
Surface properties of real glasses vary widely depending on the environmental conditions. In a very moist environment, silicate glass surfaces are typically fully hydroxylated, whereas heat-treated (∼1200 °C) glass in a vacuum chamber displays a hydroxyl-free surface.44 Therefore, two limiting cases of silica glass surfaces were considered here: fully hydroxylated and hydroxyl-free surfaces. The corresponding surface models are shown in Fig. 5. Due to the limited size of the models they do not include low concentration defects, such as two membered Si–O rings (concentration 0.2–0.4 nm−2).45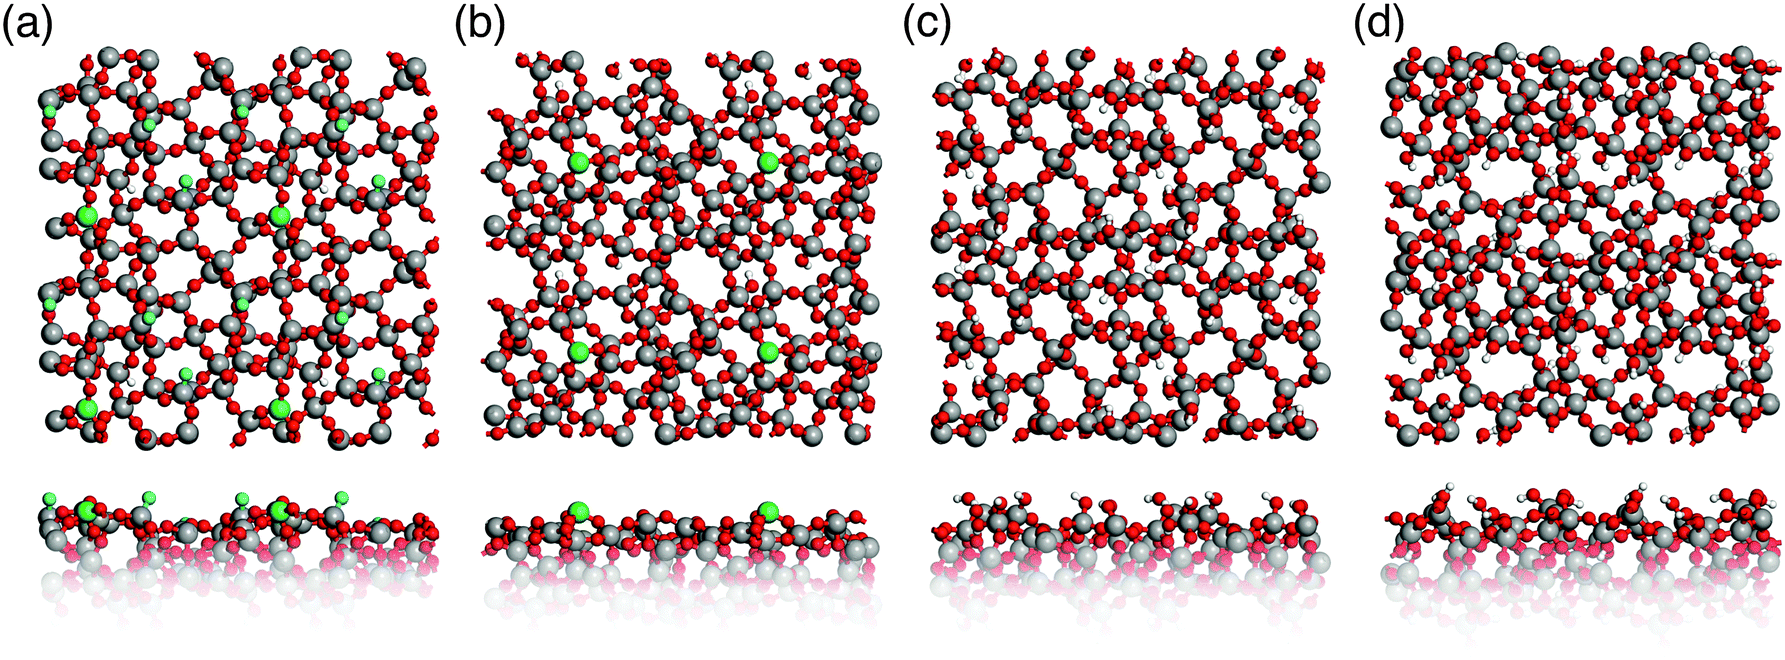 | ||
| Fig. 5 Top and side view of glass surface models. (a) and (b) Hydroxyl-free S1 and S2; (c) and (d) hydroxylated hS1 and hS2 (Si: grey, O: red, H: white, Si3: green, NBOs: blue). | ||
Table 3 compares the calculated and experimental properties of hydroxylated surfaces. The concentration of surface silanol groups for both hS1 and hS2 models of 4.4 and 4.9 nm−2, respectively, is in very good agreement with the experimental value44 of 4.9 ± 0.05 nm−2. The slight deviation of 0.5 nm−2 for hS1 is due to the relatively small surface area of the models, hence, the removal of one silanol group results in a concentration error of 0.5 nm−2. However, the ratio of geminal silanols to the total number of silanol groups of 0.22 and 0.1 for both hS1 and hS2, respectively, is in very good agreement with the range of 0.08–0.24, which was observed in experiments.46,47
![[thin space (1/6-em)]](https://www.rsc.org/images/entities/char_2009.gif) :SiOHtot) for hydroxylated glass surfaces
:SiOHtot) for hydroxylated glass surfaces
Table 4 shows calculated concentrations of NBO and Si3 surface sites as well as 3-membered Si–O rings for hydroxyl-free glass surface models S1 and S2. NBOs are only present in S1, whereas Si3 and 3-membered Si–O rings are included in both models. There are only few qualitative45,48,49 and quantitative50–52 experimental data concerning the defect concentration and structure of hydroxyl-free silica surfaces. Bobyshev and Radzig50,51 determined the concentration of Si3 and NBO centers on activated silica surfaces as 0.02 and 0.02 to 0.04 nm−2, respectively. McCrate et al.52 found a slightly higher value of approximately 10−1 nm−2 for Si3 centers. The limited size of our surface models prevents achieving such low defect concentrations. Already one defect site per surface unit cell results in a concentration of 0.49 nm−2 and modeling even lower ones would require prohibitively large simulation cells.
| S1 | S2 | |
|---|---|---|
| NBO | 1.48 | 0 |
| Si3 | 0.49 | 0.49 |
| 3-ring | 0.99 | 2.47 |
3.3. Gold monolayer on glass surfaces
Simulated annealing of gold monolayers on hydroxyl-free surface models S1 and S2 leads to its virtually instantaneous agglomeration and formation of voids exposing a bare glass surface as demonstrated for the final structures in Fig. 6a and b. The analysis of MD trajectories with snapshots shown in Fig. 7 reveals that voids are initiated by opening the Au layer at the NBO sites with the Si3 centers located beneath the forming Au clusters. The growing voids gradually expose defect-free parts of the silica surface with the NBO sites remaining in close contact with the edge of the voids and Si3 remaining beneath Au clusters. In the final, optimized structures (Fig. 6a and b) the corresponding bond distances are in average 2.17 Å and 2.33 Å for Au–NBO and Au–Si3, respectively. These findings indicate that defect sites such as NBO and Si3 centers on hydroxyl-free glass surfaces play a key role in the solid-state dewetting processes by providing centers for initial void nucleation and cluster formation. In addition, the strong interaction with the defect sites stabilizes the forming Au clusters.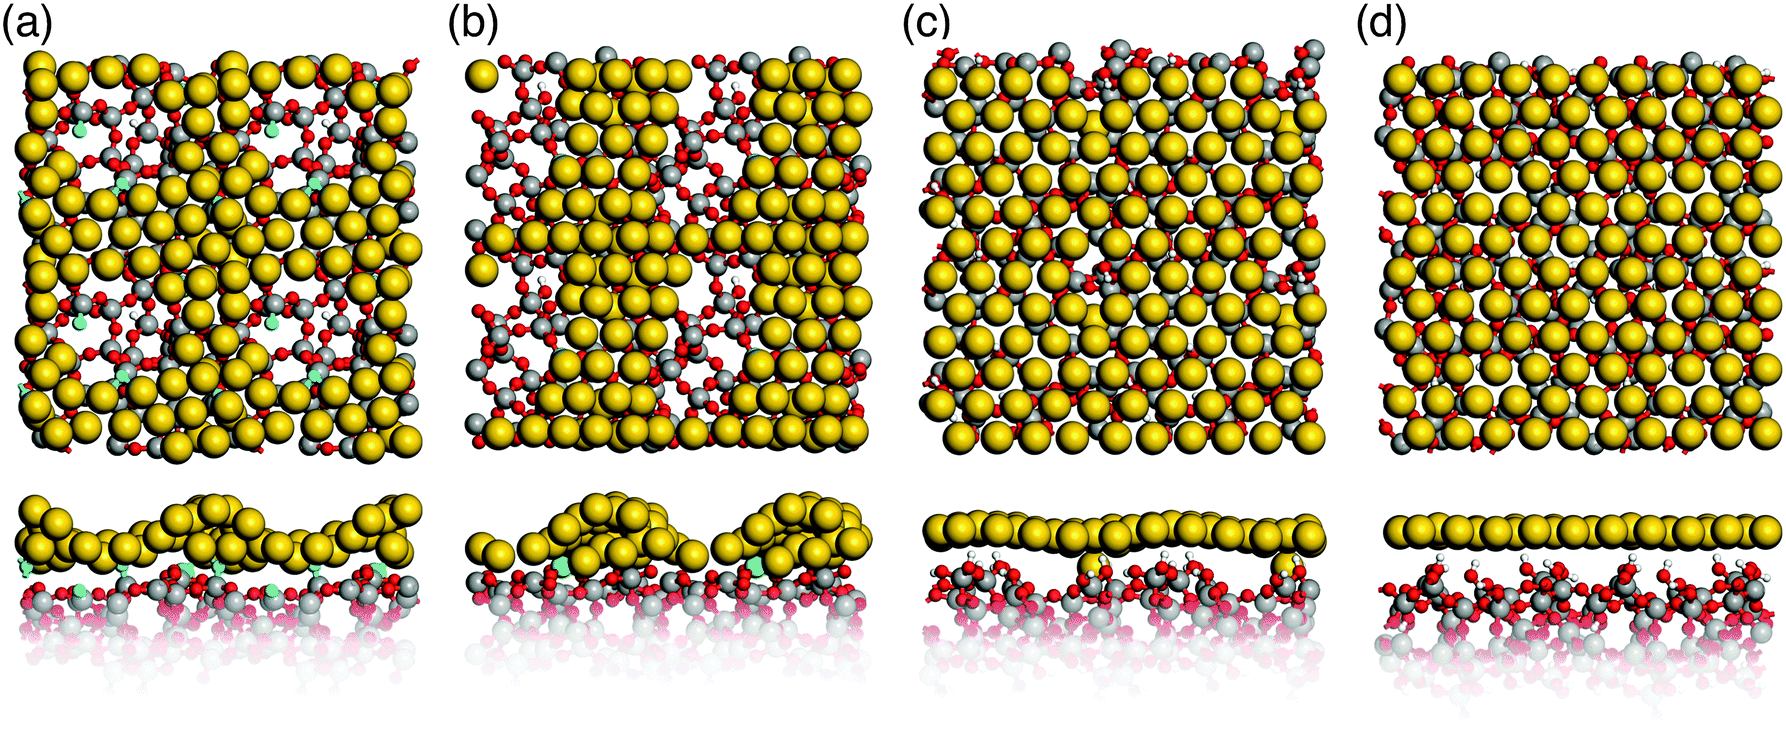 | ||
| Fig. 6 Top and side view of gold-coated silica glass after simulated ab initio annealing. (a) and (b) Hydroxyl-free surface models S1 and S2 with gold agglomerates; (c) and (d) hydroxylated surface models hS1 and hS2 with a closed gold monolayer (Si: grey, O: red, H: white, Au: yellow, Si3: green, NBOs: blue). | ||
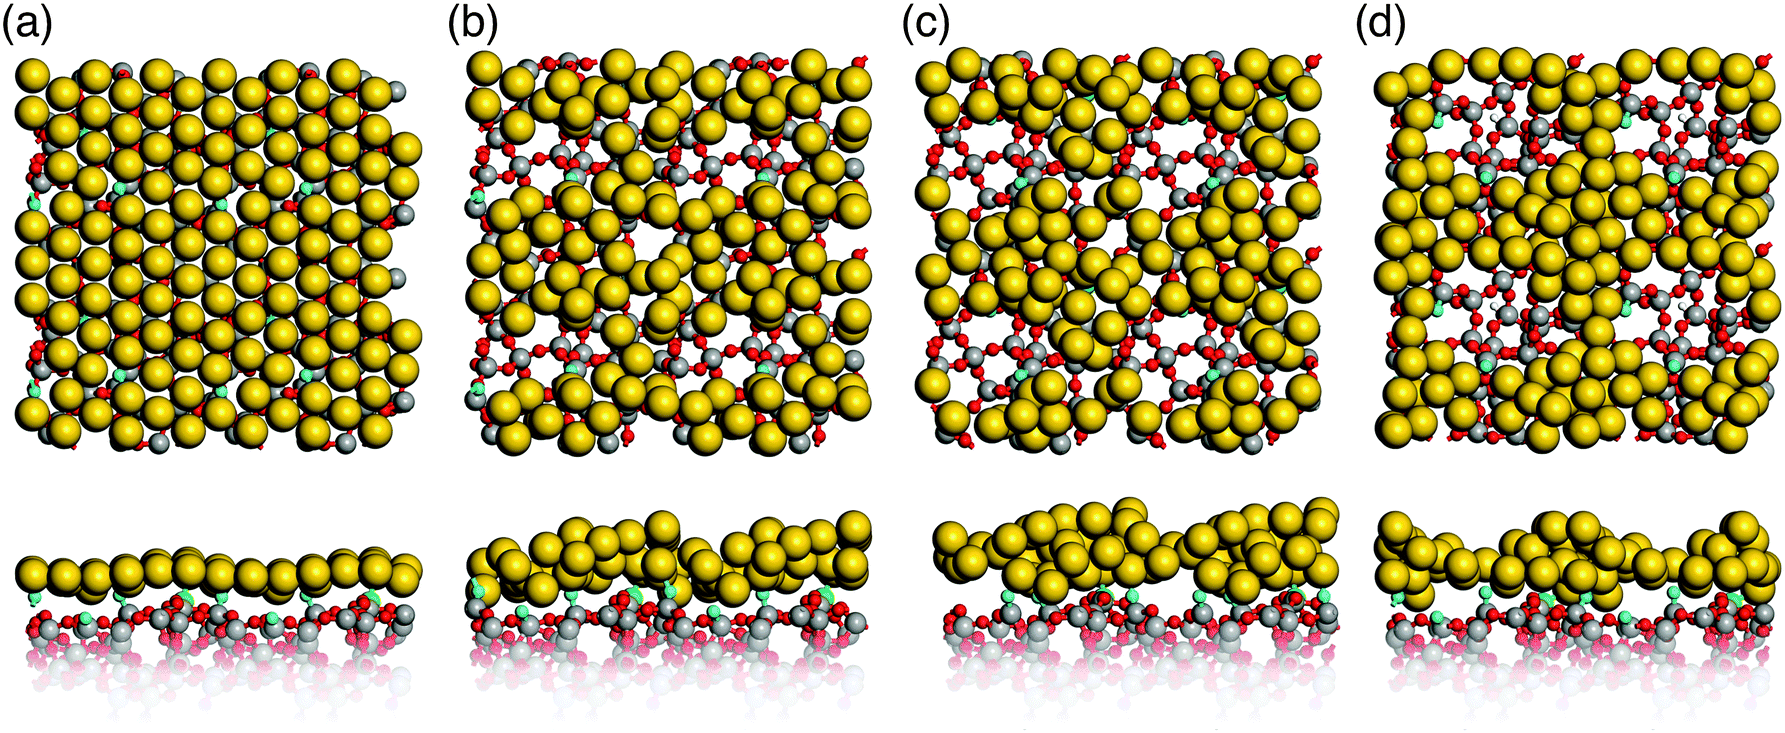 | ||
| Fig. 7 Snapshots of the MD trajectory for simulated annealing of an Au monolayer on the S1 glass surface model: (a) 1400 K, (b) 1350 K, (c) 1300 K, and (d) 900 K (Si: grey, O: red, Au: yellow, Si3: green, NBOs: blue). | ||
Our results are supported by experimental18 and theoretical19 data. Seguini et al.18 found that ultrathin Au films (0.5 to 6 nm thickness) deposited at room temperature on amorphous SiO2 by means of e-beam evaporation spontaneously aggregate, forming nanoparticles without any additional thermal treatment. In addition, rapid Au agglomeration on hydroxyl-free (0001) α-quartz surfaces has also been found by Kuo et al.19 using MD simulations employing interatomic potential functions.
In contrast to hydroxyl-free surfaces, simulated annealing of a gold monolayer on hydroxylated surface models hS1 and hS2 leaves its structure virtually unchanged within the simulation time (see Fig. 6c and d). This finding is consistent with the observed prolonged incubation times for agglomeration of thin Au layers on hydroxylated silica glass surfaces.14,17 In light of our results, it appears that this behavior can be attributed to the absence of nucleation centers in the form of surface defects, as they are saturated on hydroxylated surfaces.
Table 5 shows calculated adhesion energies of the final Au layers on the hydroxyl-free and hydroxylated glass surface models along with the corresponding dispersion contributions. For hydroxyl-free models S1 and S2 the calculated adhesion energies are 40.2 and 33.3 kJ (mol Au)−1, respectively. The dispersion energy contribution to the adhesion energies of 35% on average is quite significant. In the case of hydroxylated models hS1 and hS2 the adhesion energies of 13.5 and 10.8 kJ (mol Au)−1, respectively, are substantially lower and consist almost entirely of the dispersion contribution. The calculated Au adhesion energies per area, 200 and 160 kJ (mol nm2)−1 for hS1 and hS2, respectively, are in a good agreement with the experimental value of 216 kJ (mol nm2)−1 measured for gold films on hydroxylated silica glass surfaces.15
| Hydroxylated | Hydroxyl-free | |||
|---|---|---|---|---|
| hS1 | hS2 | S1 | S2 | |
| E ad | 13.5 (200) | 10.8 (160) | 40.2 (594) | 33.3 (492) |
| E dis | 11.9 (176) | 10.4 (154) | 12.7 (188) | 12.8 (190) |
To our best knowledge, the present study represents the first investigation of the behavior of Au layers on realistic models of vitreous silica surfaces using ab initio methods. Previous theoretical investigations were limited to one Au atom or an Au dimer interacting with various models of the silica surface. However, the reactivity of a single Au atom and small Aun clusters for n < 5 is significantly higher than that of larger clusters or two-dimensional Au layers.53–56 In line with our findings for the hydroxylated glass surface, the DFT calculations of Del Vitto et al.20 using cluster models of amorphous silica and periodic models of an all-silica edingtonite surface found very weak binding energies of less than 10 kJ (mol Au)−1 for an isolated Au atom and an Au dimer interacting with bridging Si–O–Si and terminal silanol groups. A similar result has been obtained for the adsorption of an Au atom on defect-free unsupported and supported crystalline silica films.21,23 In contrast, for models of hydroxyl-free silica surfaces20,22 and defective crystalline silica films23 a very strong interaction of a single Au atom with surface defect sites has been predicted, 305–380 kJ (mol Au)−1 for Si3 and 208–300 kJ (mol Au)−1 for NBO. The interaction energy decreases significantly with increasing number of Au atoms. For Au2 the reported calculated binding energies are 93–124 kJ (mol Au)−1 for Si3 and 70–140 kJ (mol Au)−1 for NBO centers.20,22,23 Due to already mentioned high reactivity of individual Au atoms and of Au clusters these interaction energies are significantly higher than Au adhesion energies derived in the present work (cf.Table 5).
4. Conclusions
The results of our simulations demonstrate that properties of silica glass can be accurately described employing relatively small semi-amorphous periodic models. Simulation cells containing only 64 SiO2 units properly reproduce experimental structural parameters, mechanical properties and IR vibrational spectra of bulk silica glass. The validity of the glass models is further confirmed by good agreement between the calculated and the experimental number of silanol and germinal silanol groups for hydroxylated silica glass surface models constructed from the semi-amorphous cells. Ab initio MD simulations of an Au monolayer deposited on hydroxyl-free and hydroxylated glass surface models point to a substantial surface dependence of Au agglomeration (solid-state dewetting) behavior. On hydroxyl-free surfaces, Au monolayers undergo virtually instantaneous agglomeration, which is accompanied by the formation of voids exposing a bare silica glass surface. In contrast, simulated annealing of Au monolayers on hydroxylated surface models reveals a significantly higher structural stability. This points to a key role of reactive defect sites such as Si3 and NBO centers in the kinetics of solid-state dewetting processes of metals deposited on the glass surface. Such defect sites are important for initial void nucleation and formation of metal clusters. The same Au agglomeration behavior is observed for two different surface models with substantially different concentrations and locations of surface defects. This is a strong indication that our conclusion concerning the important role of defect sites in solid-state dewetting processes on the glass surface remains valid even in the case of lower concentrations of surface defects observed in experiments. In addition, the present calculations demonstrate the crucial role of appropriate inclusion of dispersion interactions in DFT simulations of metals deposited on the glass surface. For defective, hydroxyl-free glass surfaces the dispersion correction accounts for 35% of the total adhesion energy. This effect is even more dramatic for hydroxylated glass surfaces, where the adhesion energies are almost entirely due to the dispersion interactions. This finding is in line with a recent report by Ruiz Puigdollers et al.57 for metal clusters on oxide surfaces. Finally, the gold adhesion energies of 200 and 160 kJ (mol nm2)−1 calculated for hydroxylated glass surfaces are in good agreement with the experimental data.Acknowledgements
Authors gratefully acknowledge financial support from the Ministry of Education, Science and Culture of the state Thuringia through the European Regional Development Fund (project NANOSOR), the Fonds der Chemischen Industrie and the Turbomole GmbH.References
- L. Armelao, D. Barreca, G. Bottaro, A. Gasparotto, S. Gross, C. Maragno and E. Tondello, Coord. Chem. Rev., 2006, 250, 1294–1314 CrossRef CAS.
- C. Burda, X. Chen, R. Narayanan and M. A. El-Sayed, Chem. Rev., 2005, 105, 1025–1102 CrossRef CAS PubMed.
- D. Gentili, G. Foschi, F. Valle, M. Cavallini and F. Biscarini, Chem. Soc. Rev., 2012, 41, 4430–4443 RSC.
- A. L. Giermann and C. V. Thompson, J. Appl. Phys., 2011, 109, 083520 CrossRef.
- C. V. Thompson, Annu. Rev. Mater. Res., 2012, 42, 399–434 CrossRef CAS.
- L. Yao and J. He, Prog. Mater. Sci., 2014, 61, 94–143 CrossRef.
- J. Ye and C. V. Thompson, Adv. Mater., 2011, 23, 1567–1571 CrossRef CAS PubMed.
- D. Wang, R. Ji and P. Schaaf, Beilstein J. Nanotechnol., 2011, 2, 318–326 CrossRef CAS PubMed.
- M. A. Schmidt, D. Y. Lei, L. Wondraczek, V. Nazabal and S. A. Maier, Nat. Commun., 2012, 3, 1108 CrossRef PubMed.
- R. Meszaros, B. Merle, M. Wild, K. Durst, M. Göken and L. Wondraczek, Thin Solid Films, 2012, 520, 7130–7135 CrossRef CAS.
- R. Meszaros, M. Wild and L. Wondraczek, Glass Technol.: Eur. J. Glass Sci. Technol., Part A, 2013, 54, 177–184 CAS.
- R. E. Hummel, R. T. Dehoff, S. Matts-Goho and W. M. Goho, Thin Solid Films, 1981, 78, 1–14 CrossRef CAS.
- E. Jiran and C. V. Thompson, J. Electron. Mater., 1990, 19, 1153–1160 CrossRef CAS.
- E. Jiran and C. V. Thompson, Thin Solid Films, 1992, 208, 23–28 CrossRef CAS.
- J.-Y. Kwon, T.-S. Yoon, K.-B. Kim and S.-H. Min, J. Appl. Phys., 2003, 93, 3270–3278 CrossRef CAS.
- C. M. Müller and R. Spolenak, Acta Mater., 2010, 58, 6035–6045 CrossRef.
- C. M. Müller and R. Spolenak, J. Appl. Phys., 2013, 113, 094301 CrossRef.
- G. Seguini, J. Llamoja Curi, S. Spiga, G. Tallarida, C. Wiemer and M. Perego, Nanotechnology, 2014, 25, 495603 CrossRef CAS PubMed.
- C.-L. Kuo and P. Clancy, Modell. Simul. Mater. Sci. Eng., 2005, 13, 1309–1329 CrossRef CAS.
- A. Del Vitto, G. Pacchioni, K. H. Lim, N. Rösch, J.-M. Antonietti, M. Michalski, U. Heiz and H. Jones, J. Phys. Chem. B, 2005, 109, 19876–19884 CrossRef CAS PubMed.
- L. Giordano, A. Del Vitto and G. Pacchioni, J. Chem. Phys., 2006, 124, 034701 CrossRef PubMed.
- K. H. Lim, O. Zakharieva, A. M. Shor and N. Rösch, Chem. Phys. Lett., 2007, 444, 280–286 CrossRef CAS.
- U. Martinez, L. Giordano and G. Pacchioni, J. Phys. Chem. B, 2006, 110, 17015–17023 CrossRef CAS PubMed.
- A. C. T. van Duin, S. Dasgupta, F. Lorant and W. A. Goddard III, J. Phys. Chem. A, 2001, 105, 9396–9409 CrossRef CAS.
- A. C. T. van Duin, A. Strachan, S. Stewman, Q. Zhang, X. Xu and W. A. Goddard III, J. Phys. Chem. A, 2003, 107, 3803–3811 CrossRef CAS.
- S. Plimpton, J. Comp. Physiol., 1995, 117, 1–19 CrossRef CAS.
- J. P. Perdew, K. Burke and M. Ernzerhof, Phys. Rev. Lett., 1996, 77, 3865–3868 CrossRef CAS PubMed.
- P. E. Blöchl, Phys. Rev. B: Condens. Matter Mater. Phys., 1994, 50, 17953–17979 CrossRef.
- G. Kresse and D. Joubert, Phys. Rev. B: Condens. Matter Mater. Phys., 1999, 59, 1758–1775 CrossRef CAS.
- G. Kresse and J. Hafner, Phys. Rev. B: Condens. Matter Mater. Phys., 1993, 47, 558–561 CrossRef CAS.
- G. Kresse and J. Hafner, Phys. Rev. B: Condens. Matter Mater. Phys., 1994, 49, 14251–14269 CrossRef CAS.
- G. Kresse and J. Furthmüller, Comput. Mater. Sci., 1996, 6, 15–50 CrossRef CAS.
- G. Kresse and J. Furthmüller, Phys. Rev. B: Condens. Matter Mater. Phys., 1996, 54, 11169–11186 CrossRef CAS.
- H. J. Monkhorst and J. D. Pack, Phys. Rev. B: Condens. Matter Mater. Phys., 1976, 13, 5188–5192 CrossRef.
- S. Grimme, J. Antony, S. Ehrlich and H. Krieg, J. Chem. Phys., 2010, 132, 154104 CrossRef PubMed.
- X. Wu, D. Vanderbilt and D. R. Hamann, Phys. Rev. B: Condens. Matter Mater. Phys., 2005, 72, 035105 CrossRef.
- S. Baroni, S. de Gironcoli and A. Dal Corso, Rev. Mod. Phys., 2001, 73, 515–562 CrossRef CAS.
- A. P. Scott and L. Radom, J. Phys. Chem., 1996, 100, 16502–16513 CrossRef CAS.
- C. T. Kirk, Phys. Rev. B: Condens. Matter Mater. Phys., 1988, 38, 1255–1273 CrossRef CAS.
- A. C. Wright, J. Non-Cryst. Solids, 1994, 179, 84–115 CrossRef CAS.
- J. R. G. da Silva, D. G. Pinatti, C. E. Anderson and M. L. Rudee, Philos. Mag., 1975, 31, 713–717 CrossRef CAS.
- H. F. Poulsen, J. Neuefeind, H.-B. Neumann, J. R. Schneider and M. D. Zeidler, J. Non-Cryst. Solids, 1995, 188, 63–74 CrossRef CAS.
- W. Pabst and E. Gregorová, Ceram.-Silik., 2013, 57, 167–184 CAS.
- L. T. Zhuravlev, Colloids Surf., A, 2000, 173, 1–38 CrossRef CAS.
- A. Grabbe, T. A. Michalske and W. L. Smith, J. Phys. Chem., 1995, 99, 4648–4654 CrossRef CAS.
- D. W. Sindorf and G. E. Maciel, J. Phys. Chem., 1982, 86, 5208–5219 CrossRef CAS.
- C. C. Liu and G. E. Maciel, J. Am. Chem. Soc., 1996, 118, 5103–5119 CrossRef CAS.
- B. C. Bunker, D. M. Haaland, T. A. Michalske and W. L. Smith, Surf. Sci., 1989, 222, 95–118 CrossRef CAS.
- F. L. Galeener, Solid State Commun., 1982, 44, 1037–1040 CrossRef CAS.
- A. A. Bobyshev and V. A. Radzig, Kinet. Catal., 1988, 29, 551–559 Search PubMed.
- V. A. Radzig, in Defects in SiO2 and Related Dielectrics: Science and Technology, ed. G. Pacchioni, L. Skuja and D. L. Griscom, Kluwer Academic, Dordrecht, 2000, pp. 339–370 Search PubMed.
- J. M. McCrate and J. G. Ekerdt, Chem. Mater., 2014, 26, 2166–2171 CrossRef CAS.
- M. Gao, A. Lyalin, M. Takagi, S. Maeda and T. Taketsugu, J. Phys. Chem. C, 2015, 119, 11120–11130 CrossRef CAS.
- M. Boronat, A. Leyva-Pérez and A. Corma, Acc. Chem. Res., 2014, 47, 834–844 CrossRef CAS PubMed.
- J. J. Determan, S. Moncho, E. N. Brothers and B. G. Janesko, J. Phys. Chem. C, 2014, 118, 15693–15704 CrossRef CAS.
- B. Yoon, P. Koskinen, B. Huber, O. Kostko, B. von Issendorff, H. Häkkinen, M. Moseler and U. Landman, ChemPhysChem, 2007, 8, 157–161 CrossRef CAS PubMed.
- A. Ruiz Puigdollers, P. Schlexer and G. Pacchioni, J. Phys. Chem. C, 2015, 119, 15381–15389 CrossRef.
| This journal is © the Owner Societies 2015 |