
 Open Access Article
 This Open Access Article is licensed under a Creative Commons Attribution-Non Commercial 3.0 Unported Licence
Adsorption of 2-propanol on ice probed by ambient pressure X-ray photoelectron spectroscopy†
John T.
Newberg
*a and
Hendrik
Bluhm
*b
aUniversity of Delaware, Department of Chemistry and Biochemistry, Newark, DE 19716, USA. E-mail: jnewberg@udel.edu
bChemical Sciences Division, Lawrence Berkeley National Laboratory, Berkeley, CA 94720, USA. E-mail: hbluhm@lbl.gov
First published on 18th August 2015
Abstract
The interaction of 2-propanol with ice was examined via ambient pressure X-ray photoelectron spectroscopy (APXPS), a surface sensitive technique that probes the adsorbed 2-propanol directly with submonolayer resolution. Isothermal uptake experiments were performed on vapor deposited ice at 227 K in the presence of the equilibrium water vapor pressure of 0.05 Torr and 2-propanol partial pressures ranging from 5 × 10⁻⁵ to 2 × 10⁻³ Torr. The C 1s APXPS spectra of adsorbed 2-propanol showed two characteristic peaks associated with the COH alcohol group and CMe methyl groups in a 1![[thin space (1/6-em)]](https://www.rsc.org/images/entities/char_2009.gif) :2 ratio, respectively. Coverage increased with 2-propanol partial pressure and followed first order Langmuir kinetics with a Langmuir constant of K = 6.3 × 10³ Torr−1. The 1:2 ratio of COH:CMe remained constant with increasing coverage, indicating there is no chemical reaction upon adsorption. The observed Langmuir kinetics using APXPS is consistent with previous observations of other small chain alcohols via indirect adsorption methods using, e.g., Knudsen cell and coated wall flow tube reactors.
:2 ratio, respectively. Coverage increased with 2-propanol partial pressure and followed first order Langmuir kinetics with a Langmuir constant of K = 6.3 × 10³ Torr−1. The 1:2 ratio of COH:CMe remained constant with increasing coverage, indicating there is no chemical reaction upon adsorption. The observed Langmuir kinetics using APXPS is consistent with previous observations of other small chain alcohols via indirect adsorption methods using, e.g., Knudsen cell and coated wall flow tube reactors.
1. Introduction
The processing of volatile organic carbon (VOC) compounds within environmental ices produces humic-like substances and can significantly impact the surrounding environment by affecting the oxidizing capacity of the atmosphere and contributing to secondary aerosol formation.1 There is increasing knowledge regarding the interactions of inorganic and organic vapors with ice surfaces.1–6 However, most of the experimental adsorption studies to date probe adsorption at the ice surface indirectly by monitoring the decrease of the partial pressure of the adsorbing species in the gas phase. In the present study we use ambient pressure X-ray photoelectron spectroscopy (APXPS) to probe the surface directly under steady-state adsorption–desorption conditions. APXPS is a surface sensitive tool that is chemically specific and probes the top few nanometers of a surface with submonolayer coverage sensitivity. APXPS has been used previously to investigate the interface of vapor deposited ice,7 NaCl water/ice,8 and ice in the presence of gas phase acetic acid,9 acetone,10 and NO2.11Previous alcohol adsorption studies on ice were performed using, e.g., a Knudsen cell,12 coated wall flow tube (CWFT)13–18 and Brunauer–Emmett–Teller (BET) adsorption methods.14 The alcohols investigated include methanol,12,18 ethanol,13–17 1-propanol,16 1-butanol,16 1-pentanol,16 and 1-hexanol16 at temperatures >150 K with alcohol partial pressures ranging from about 5 × 10⁻⁷ to 5 × 10⁻⁴ Torr. Submonolayer coverages of C1 to C4 alcohols were observed under these conditions with first order Langmuirian kinetics.12–18 For comparison, typical urban levels of C1 to C3 alcohols range from approximately 1 to 1400 ppb19,20 (i.e., ∼10−6 to 10−3 Torr partial pressures). Thus, the aforementioned ice adsorption studies were performed in pressure regimes indicative of “dirty” ice,21 conditions typical for ice surfaces exposed to high levels of anthropogenic emissions in urban environments.
In this study we investigate the isothermal uptake of 2-propanol on ice at 227 K with partial pressures from 5 × 10⁻⁵ to 2 × 10⁻³ Torr using APXPS. While the adsorption of a number of different alcohols on ice has been investigated under similar conditions,12–18 to our knowledge this is the first study of 2-propanol adsorption on ice. Experiments were performed at 227 K in order to compare the results of this study to previous work on different alcohols at the same temperature. Alcohol adsorption on ice is studied here by probing the adsorbed species at the ice surface directly via APXPS, thus allowing for the determination of possible reactions of the adsorbed alcohol with the ice substrate.
2. Experimental
The experiments were performed using the APXPS endstation22 at the Molecular Environmental Science beamline (11.0.2)23 at the Advanced Light Source in Berkeley, CA. Ice samples with a thickness of ∼0.5 mm were grown through condensation of water vapor onto a 3 mm diameter Cu substrate, which was temperature controlled at 227 K using a custom-built Peltier sample holder with an integrated K-type thermocouple.22 Water vapor was admitted to the APXPS measurement chamber through a precision leak valve. The water source was the vapor above liquid water (Alfa Aesar, HPLC grade) in a vacuum sealed glass bulb. For each experiment the water supply was purified with at least three freeze–pump–thaw cycles. 2-Propanol vapor was admitted through a second precision leak valve using the vapor pressure above liquid 2-propanol (Sigma-Aldrich, >99.9%) in a vacuum sealed glass bulb which was also freeze–pump–thawed three times prior to experiments. The total (water + 2-propanol) pressure in the measurement chamber was monitored using an MKS capacitance manometer pressure gauge (precision 0.01 Torr). For pure ice films the water vapor pressure in the chamber corresponded to the literature value24 for the equilibrium water vapor pressure above ice at 227 K (0.05 Torr), confirming the correctness of the pressure and temperature measurements. The partial pressure of 2-propanol was measured using a quadrupole mass spectrometer (QMS; Stanford Research Systems, RGA 200) which was attached to the preparation chamber of the APXPS system by monitoring m/z = 45. The measurement chamber and preparation chamber were connected through a variable leak valve. The calibration curve of the m/z = 45 (m45) signal (in arbitrary units) versus the partial pressure of 2-propanol in the analysis chamber is shown in the ESI† (Fig. S1). The downstream m45 QMS partial pressure signal is proportional to the square of the upstream APXPS chamber pressure, caused by the conductance of the gas flow through the leak valve restriction.25C 1s APXPS data were collected at an incident photon energy of 490 eV. The combined analyzer and beamline resolution was better than 0.2 eV. The incident photon flux density was kept to below 3 × 10¹¹ photons per mm2 to reduce the effect of beam damage, which manifests itself in the appearance of a peak at the low BE side in the C 1s spectra.10 For the experiments in this study, no significant beam-induced damage was observed.
3. Results and discussion
APXPS C 1s spectra for gas phase 2-propanol at room temperature and 2-propanol adsorbed on ice at 227 K are shown in Fig. 1. For ease of comparison of the gas phase and adsorbed spectrum the binding energy axis is aligned to zero for the peak due to the methyl groups (C1 and C3 in Fig. 1 inset). The central carbon atom (C2) for both the gas phase and adsorbed phase is shifted by 1.5 eV to a higher binding energy, a characteristic shift for an alcohol group.26 The methyl-to-alcohol C 1s intensity ratios are 2:1, as expected from the stoichiometry of the molecule. For acetone adsorption on ice10 the binding energy difference between the central carbonyl group and the terminating methyl groups (akin to C2 and C1,3 in the present case) was found to be 0.3 eV higher for the adsorbed phase compared to the gas phase. These results are in contrast to what is observed for 2-propanol, where both the gas and adsorbed phase have a similar binding energy difference of 1.5 eV between C2 and C1,3. The asymmetric broadening of the gas phase species can be attributed to the excitation of the C–H and C–O stretching modes by the emitted photoelectrons.10 In going from the gas phase to the adsorbed phase, the C 1s peaks additionally broaden. This broadening could be due to electronic interactions between the ice surface and carbon species, which would include an averaging over many different adsorption geometries with slightly different core level binding energies. However, there could also be broadening due to inhomogeneous charging at the interface of the ice surface. The extent to which each of these mechanisms contribute to broadening is difficult to assess.
 | ||
| Fig. 1 C 1s spectra of (a) gas phase 2-propanol at 0.018 Torr and (b) adsorbed 2-propanol on ice at 227 K and 2-propanol partial pressure of 0.6 mTorr. | ||
Two isothermal uptake experiments on ice were performed at 227 K with 2-propanol partial pressures ranging from 5 × 10⁻⁵ to 3 × 10⁻³ Torr. Fig. 2 shows representative spectra as a function of increasing partial pressure. The binding energies are scaled to the bulk ice 1b1 peak at 6.5 eV.27 The overall C 1s signal increases with increasing 2-propanol partial pressure due to 2-propanol adsorption. The COH:CMe alcohol-to-methyl ratio remained at 1:2 with increasing coverage, indicating that 2-propanol adsorbs intact and does not strongly react with the ice surface.
 | ||
| Fig. 2 C 1s APXPS spectra with increasing 2-propanol adsorption on ice at 227 K. | ||
A quantitative assessment of the amount of adsorbed 2-propanol as a function of partial pressure is shown in Fig. 3 for two independent uptake experiments, plotting the integrated C 1s intensity versus 2-propanol partial pressure. The non-zero C 1s intensity at the lowest 2-propanol pressures is due to the lack of a measurable m45 signal at the beginning of the adsorption experiment, below about 5 × 10⁻⁵ Torr partial pressure in the analysis chamber. The difference in the measured peak area as a function of pressure in the two isotherm experiments is attributed to a small variation in the sample-to-aperture distance and thus electron scattering by the gas phase from one uptake experiment to the next.
 | ||
| Fig. 3 Langmuir isotherms plotted as the (a) integrated C 1s 2-porpanol intensity and (b) 2-propanol coverage as a function of vapor pressure at 227 K. Solid and open symbols represent two independent experiments. Solid and dashed lines are first order Langmuir fits through the data. | ||
The smooth monotonic increase in 2-propanol intensity is indicative of Langmuirian adsorption–desorption kinetics observed previously with other alcohols adsorbed on ice.12–18 Multilayer uptake would lead to an inflection point in the uptake curve.16 Thus, the coverages are expected to be submonolayer approaching surface saturation. The lines fit through the data in Fig. 3a are first order Langmuir curves given by:
 | (1) |
 | (2) |
Fig. 4 compares the uptake of 2-propanol measured here using APXPS to CWFT studies of ethanol, 1-propanol and 1-butanol.16 To our knowledge, the paper by Sokolov and Abbatt is the only study to date that considers C3 and C4 alcohol adsorption on ice and is thus a relevant reference for the present investigation to compare to. The uptake data in the CWFT studies were reported as σ (molecules cm−2) versus p (Torr). For Fig. 4 the CWFT data (open circles) were extracted from ref. 16 using WebPlotDigitizer Version 3.8 in the reported units and then converted to coverage (ML) by dividing by the reported σsat values for each alcohol. The Langmuir fits to the data (solid lines) were generated using eqn (2) with the reported values of K = 1.22 × 10³, 3.50 × 10³ and 13.4 × 10³ Torr−1 for ethanol, 1-propanol and 1-butanol, respectively.
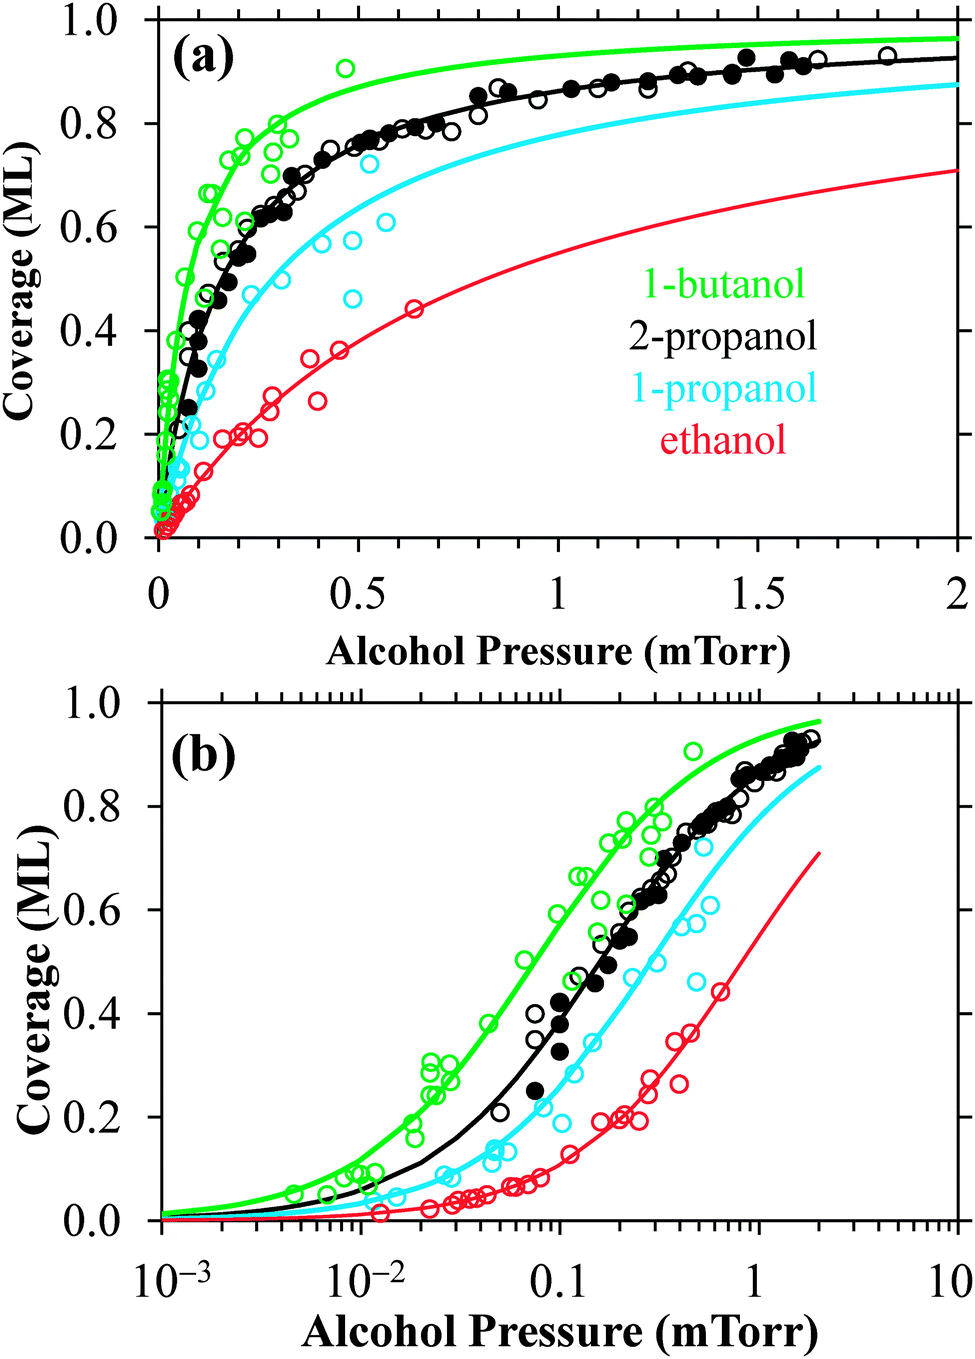 | ||
| Fig. 4 Alcohol coverage as a function of partial pressure using a (a) linear x-axis and (b) logx-axis. 2-Propanol data is from Fig. 3. 1-Butanol, 1-propanol and ethanol data are from ref. 16. Lines are first order Langmuir fits through the data. | ||
As seen from Fig. 4a (linear scale x-axis) APXPS experiments are able to probe roughly a factor of four higher alcohol partial pressures than CWFT experiments. The upper pressure limit in the CWFT experiments is determined by the potential for condensation onto the injector which is at a lower temperature than the ice surface.16 Thus, in an CWFT experiment the alcohol partial pressure must be kept significantly below the alcohol condensation point occurring at the cold injector temperature. For APXPS experiments the coldest point in the chamber is the Peltier element-cooled copper substrate which is covered by ice during the experiments.22 The APXPS 2-propanol experiments could have probed at high pressures, but were stopped near ∼0.002 Torr because the C 1s spectral intensity did not change much above this partial pressure. The ability to probe at high partial pressures allow for APXPS experiments to collect data near the adsorption saturation point, thus enabling a confident determination of σsat from the first order Langmuir fit.
Fig. 4b (log scale x-axis) shows that CWFT studies were able to probe roughly a factor of five to ten (depending on the alcohol) lower partial pressures than APXPS at a similar temperature. It should be noted that the lower pressure limit in the APXPS studies was not due to lack of C 1s signal but instead by QMS sensitivity; for example, the bottom spectrum in Fig. 2 was taken at 8 × 10⁻⁵ Torr, where there is still a significant C 1s intensity (signal-to-noise ratio of about ten), corresponding to a coverage of ∼0.2 ML.
The partial pressure detection limits for CWFT studies were reported to be in the range of 10−7 to 10−6 Torr, depending on the alcohol.16 The details of the CWFT setup28 show that the flow cell (where adsorption occurs) is separated from a QMS via two apertures and one differentially pumped stage. This allows for a direct line-of-sight from the flow cell into the QMS for detection. Assuming a detection limit near 10−10 Torr for the QMS and comparing this to the 10−5 Torr detection limit for 1-propanol (Fig. 4b, blue data), this gives a pressure differential of 105 in going from the flow cell to the mass spectrometer, mainly due to the differentially pumped stage between the two. By comparison, there is roughly a factor of five greater loss (∼5 × 10⁵) for 2-propanol detection in going from the analysis chamber in APXPS studies with a detection limit of ∼5 × 10⁻⁵ Torr, assuming as well a detection limit of 10−10 Torr at the QMS. This fivefold greater loss in alcohol detection in APXPS studies (compared to CWFT16) can be overcome by improvements of the conductance from the analysis chamber to the QMS in future APXPS measurements.
The observed value of K = 6.3 × 10³ Torr−1 at 227 K for 2-propanol suggests that the partitioning of 2-propanol is greater than that of 1-propanol (3.50 × 10³ Torr−1), but less than that of 1-butanol (13.4 × 10³ Torr−1) at 227 K. More specifically, comparing the two isomers 1- and 2-propanol, the latter appears to bind more strongly to ice. However, given that these observations are based on measurements using two different experimental techniques one should be cautious to draw any strong conclusions from this comparison. For example, APXPS experiments prepare ice surfaces through vapor deposition, while the CWFT studies in Fig. 4 freeze liquid water to generate a thin film of ice, so the influence of possible differences in the surface morphology on the observed adsorption behavior cannot be excluded.
Input from theoretical calculations will help to elucidate the reason behind the different adsorption energetics of the four molecules compared in Fig. 4. Ethanol adsorption on ice was examined using molecular dynamic (MD) simulations over the temperature range from 193 K to 223 K using the TIP4P water model.17 At submonolayer coverages, lateral H-bonding and alkyl–alkyl interactions were found to be minor. The major contribution to the total energy is ethanol–ice hydrogen bonding. At monolayer coverage and beyond lateral interactions become significant. Similar observations of strong ice–OH interactions for methanol at submonolayer coverages were found using MD (TIP4P) from 210 K to 250 K29 and Monte Carlo simulations at 200 K.30 Thus, molecular simulations indicate that the ice–OH interaction dominates the overall adsorption energetics under submonolayer conditions, consistent with a Langmuirian mechanism where lateral interactions are negligible. Computer simulations comparing the adsorption energetics of 1-propanol, 2-propanol and 1-butanol could shed light on whether the observed difference in adsorption behavior is consistent with the APXPS and CWFT observations in Fig. 4.
4. Conclusions
2-Propanol adsorption on ice was examined using ambient pressure X-ray photoelectron spectroscopy (APXPS) at an ice temperature of 227 K and alcohol partial pressures ranging from 5 × 10⁻⁵ to 2 × 10⁻³ Torr. Previously, alcohol adsorption on ice was examined using coated wall flow tube, Knudsen cell and BET adsorption techniques which probe adsorption indirectly by measuring the loss from the gas phase. APXPS offers an advantage over these techniques by probing the surface chemistry directly with submonolayer resolution. APXPS C 1s spectra of adsorbed 2-propanol show two distinct peaks with an appropriate 1:2 stoichiometry for the alcohol group and two methyl groups. The coverage of 2-propanol increased with partial pressure above the ice surface. The adsorption mechanism followed first order Langmuir kinetics, which is consistent with negligible lateral interactions between adsorbed 2-propanol molecules and strong hydrogen bonding of the alcohol OH group to the ice surface. The observed Langmuir constant of Kp = 6.3 × 10³ Torr−1 at 227 K suggests that the partitioning of 2-propanol to the ice surface is greater than 1-propanol but less than 1-butanol when compared to previous coated wall flow tube studies.16 However, given the use of two different experimental techniques to determine this difference in adsorption partitioning, additional studies and complementary molecular simulations are recommended to confirm these results.
Acknowledgements
This work was supported by the Office of Science, Biological and Environmental Research, Environmental Remediation Sciences Division (ERSD), U.S. Department of Energy under Contract No. DE-AC02-05CH11231. The ALS and the ALS-MES beamline 11.0.2 are supported by the Director, Office of Science, Office of Basic Energy Sciences, Division of Chemical Sciences, Geosciences of the U.S. Department of Energy at the Lawrence Berkeley National Laboratory under Contract No. DE-AC02-05CH11231. J.T.N. acknowledges support from NSF ANT-1019347.Notes and references
- V. F. McNeill, A. M. Grannas, J. P. D. Abbatt, M. Ammann, P. Ariya, T. Bartels-Rausch, F. Domine, D. J. Donaldson, M. I. Guzman, D. Heger, T. F. Kahan, P. Klan, S. Masclin, C. Toubin and D. Voisin, Atmos. Chem. Phys., 2012, 12, 9653 CrossRef CAS.
- C. Girardet and C. Toubin, Surf. Sci. Rep., 2001, 44, 163 CrossRef.
- J. P. Abbatt, Chem. Rev., 2003, 103, 4783 CrossRef CAS PubMed.
- T. Huthwelker, M. Ammann and T. Peter, Chem. Rev., 2006, 106, 1375 CrossRef CAS PubMed.
- J. N. Crowley, M. Ammann, R. A. Cox, R. G. Hynes, M. E. Jenkin, A. Mellouki, M. J. Rossi, J. Troe and T. J. Wallington, Atmos. Chem. Phys., 2010, 10, 9059 CrossRef CAS.
- T. Bartels-Rausch, H. Jacobi, T. Kahan, J. L. Thomas, E. Thomson, J. Abbatt, M. Ammann, J. Blackford, H. Bluhm and C. Boxe, Atmos. Chem. Phys., 2014, 14, 1587 CrossRef.
- H. Bluhm, D. Ogletree, C. Fadley, Z. Hussain and N. Salmeron, J. Phys.: Condens. Matter, 2002, 14, L227 CrossRef CAS.
- A. Krepelova, T. Huthwelker, H. Bluhm and M. Ammann, ChemPhysChem, 2010, 11, 3859 CrossRef CAS PubMed.
- A. Krepelova, T. Bartels-Rausch, M. A. Brown, H. Bluhm and M. Ammann, J. Phys. Chem. A, 2013, 117, 401 CrossRef CAS PubMed.
- D. E. Starr, D. Pan, J. T. Newberg, M. Ammann, E. G. Wang, A. Michaelides and H. Bluhm, Phys. Chem. Chem. Phys., 2011, 13, 19988 RSC.
- A. Krepelova, J. T. Newberg, T. Huthwelker, H. Bluhm and M. Ammann, Phys. Chem. Chem. Phys., 2010, 12, 8870 RSC.
- P. K. Hudson, M. A. Zondlo and M. A. Tolbert, J. Phys. Chem. A, 2002, 106, 2882 CrossRef CAS.
- A. Symington, L. M. Leow, P. T. Griffiths and R. A. Cox, J. Phys. Chem. A, 2012, 116, 5990 CrossRef CAS PubMed.
- J. P. D. Abbatt, T. Bartels-Rausch, M. Ullerstam and T. J. Ye, Environ. Res. Lett., 2008, 3, 045008 CrossRef.
- M. Kerbrat, S. Le Calve and P. Mirabel, J. Phys. Chem. A, 2007, 111, 925 CrossRef CAS PubMed.
- O. Sokolov and J. Abbatt, J. Phys. Chem. A, 2002, 106, 775 CrossRef CAS.
- N. Peybernes, S. Le Calve, P. Mirabel, S. Picaud and P. N. M. Hoang, J. Phys. Chem. B, 2004, 108, 17425 CrossRef CAS.
- A. K. Winkler, N. S. Holmes and J. N. Crowley, Phys. Chem. Chem. Phys., 2002, 4, 5270 RSC.
- G. Legreid, J. B. Lööv, J. Staehelin, C. Hueglin, M. Hill, B. Buchmann, A. S. Prevot and S. Reimann, Atmos. Environ., 2007, 41, 8409 CrossRef CAS PubMed.
- H. T. Nguyen, N. Takenaka, H. Bandow, Y. Maeda, S. T. de Oliva, M. M. Botelho and T. M. Tavares, Atmos. Environ., 2001, 35, 3075 CrossRef CAS.
- P. P. A. Malley and T. F. Kahan, J. Phys. Chem. A, 2014, 118, 1638 CrossRef CAS PubMed.
- D. F. Ogletree, H. Bluhm, E. D. Hebenstreit and M. Salmeron, Nucl. Instrum. Methods Phys. Res., Sect. A, 2009, 601, 151 CrossRef PubMed.
- H. Bluhm, K. Andersson, T. Araki, K. Benzerara, G. Brown, J. Dynes, S. Ghosal, M. Gilles, H. Hansen, J. Hemminger, A. Hitchcock, G. Ketteler, A. Kilcoyne, E. Kneedler, J. Lawrence, G. Leppard, J. Majzlan, B. Mun, S. Myneni, A. Nilsson, H. Ogasawara, D. Ogletree, K. Pecher, M. Salmeron, D. Shuh, B. Tonner, T. Tyliszczak, T. Warwick and T. Yoon, J. Electron. Spectrosc. Relat. Phenom., 2006, 150, 86 CrossRef CAS PubMed.
- W. Wagner and A. Pruss, J. Phys. Chem. Ref. Data, 2002, 31, 387 CrossRef CAS PubMed.
- J. M. Lafferty, Foundations of Vacuum Science and Technology, Wiley, New York, 1998 Search PubMed.
- J. F. Moulder, W. F. Stickle, P. E. Sobol and K. D. Bomben, Handbook of X-ray Photoelectron Spectroscopy, Physical Electronics, Inc., Eden Prairie, MN, 1995 Search PubMed.
- Y. Joseph, C. Kuhrs, W. Ranke and W. Weiss, Surf. Sci., 1999, 433, 114 CrossRef.
- S. M. Clegg and J. P. D. Abbatt, J. Phys. Chem. A, 2001, 105, 6630 CrossRef CAS.
- B. Collignon and S. Picaud, Chem. Phys. Lett., 2004, 393, 457 CrossRef CAS PubMed.
- P. Jedlovszky, L. Partay, P. N. M. Hoang, S. Picaud, P. von Hessberg and J. N. Crowley, J. Am. Chem. Soc., 2006, 128, 15300 CrossRef CAS PubMed.
Footnote |
| † Electronic supplementary information (ESI) available. See DOI: 10.1039/c5cp03821a |
| This journal is © the Owner Societies 2015 |