 Open Access Article
Magnetic susceptibility as a direct measure of oxidation state in LiFePO4 batteries and cyclic water gas shift reactors
Thomas
Kadyk
 * and
Michael
Eikerling
Simon Fraser University, Department of Chemistry, 8888 University Drive, Burnaby, BC V5A 1S6, Canada. E-mail: tkadyk@sfu.ca; Tel: +1 778 782 3699
First published on 1st July 2015
Abstract
The possibility of correlating the magnetic susceptibility to the oxidation state of the porous active mass in a chemical or electrochemical reactor was analyzed. The magnetic permeability was calculated using a hierarchical model of the reactor. This model was applied to two practical examples: LiFePO4 batteries, in which the oxidation state corresponds with the state-of-charge, and cyclic water gas shift reactors, in which the oxidation state corresponds to the depletion of the catalyst. In LiFePO4 batteries phase separation of the lithiated and delithiated phases in the LiFePO4 particles in the positive electrode gives rise to a hysteresis effect, i.e. the magnetic permeability depends on the history of the electrode. During fast charge or discharge, non-uniform lithium distributionin the electrode decreases the hysteresis effect. However, the overall sensitivity of the magnetic response to the state-of-charge lies in the range of 0.03%, which makes practical measurement challenging. In cyclic water gas shift reactors, the sensitivity is 4 orders of magnitude higher and without phase separation, no hysteresis occurs. This shows that the method is suitable for such reactors, in which large changes of the magnetic permeability of the active material occurs.
1 Introduction
When atoms change their oxidation state, their magnetic moment changes. In some cases, this can lead to significant changes in the magnetic properties of a material. One example is iron, which changes its ferromagnetic nature when it is oxidized into paramagnetic FeO (i.e. iron(II) oxide). Further oxidation to Fe3O4 (iron(II,III) oxide) makes the material ferrimagnetic and finally Fe2O3 (iron(III) oxide) is again ferromagnetic.1 This opens up the possibility to determine the oxidation state of the material via measurement of its magnetic susceptibility. This work attempts to explore this principle in two important practical example systems of chemical engineering: lithium ion phosphate (LiFePO4) batteries and cyclic water gas shift reactors (CWGSR).In CWGSR, the above mentioned transition from iron to iron oxide (usually to the FeO or Fe3O4 stage) is used as an intermediate oxygen storage for the water-gas-shift reaction (CO + H2O ↔ CO2 + H2) used for hydrogen production.2–4 The oxidation state of the reactor bed corresponds to the depletion of the catalyst, which is an important information for the operation of the reactor: when the catalyst is depleted, the reactor needs to be switched from an oxidation cycle to the reduction cycle in order to restore the catalyst. Ideally, the cycling should occur before the catalyst is completely depleted in order to avoid a breakthrough of the reactant gases.
In LiFePO4 batteries, charges are stored in the negative electrode in the form of intercalated lithium. Upon charge, lithium deintercalates, which changes the oxidation state of iron from Fe2+ in LiFePO4 to Fe3+ in delithiated FePO4 (see Appendix A). Thus, the oxidation state is directly linked to lithium content and state of charge of the battery.
The determination of the state of charge (SOC) of the battery is a major problem for battery management.5,6 On the one hand, the SOC is important information for the user in order to estimate the remaining working time of the device. It is an important psychological factor for which the term range anxiety has been coined in the context of electric vehicles. On the other hand, the knowledge of the SOC is important for the management of the battery, since many systems are sensitive to deep discharge or overcharge. These states of extremely high or too low SOC can cause irreversible damage to the battery.7
Current strategies for determining the SOC (for a review, see e.g.5,6) often suffer drawbacks:5,6 discharge tests are not applicable online; Coulomb counting needs continuous re-calibration and is sensitive to side reactions; measurement of OCV or EMF need long rest times before they can be applied; impedance spectroscopy is cost intensive and temperature sensitive; artificial neural networks need intensive training with a similar battery; Kalman filters need large computing capacities, a suitable battery model and determination of initial parameters. Therefore, an alternative, direct measure of SOC would be desireable.
One aim of the current work is to assess whether the change of the magnetic properties of a lithium ion battery during charge and discharge can be used to determine the SOC. A prominent method in literature of using the magnetic properties for the investigation of lithium ion batteries is nuclear magnetic resonance (NMR) spectroscopy. With NMR, interfacial storage mechanisms of lithium in RuO2,8 silicon9 and hard carbon electrodes10,11 were investigated. NMR was successfully used to investigate the local structure12,13 and the dynamics of lithium12,14 in battery electrodes. It was used to analyse the formation of microstructural lithium over the lifetime of the battery13,15 and the limited cyclability of Li–O2 batteries.16 Papers giving practical advise for the design of cells for NMR studies17 and the separation of resonances from the different components of the cell18 demonstrate the utility of this method.
In both CWGSR and LiFePO4 battery, the active material is a porous medium. As seen in Fig. 1, in the CWGSR the primary particles are pressed into porous pellets, which are embedded in a fixed bed reactor. In the LiFePO4 battery, primary particles form porous electrodes, which together with the electrolyte containing separator form a battery. In both cases, the challenge is to link the changes in magnetic susceptibility on the atomic level in the particle to the change in the effective susceptibility of the whole device, which is measurable from the outside. In this work, a hierarchical model for the magnetic permeability of a reactor with porous media was developed. This model describes the relationship of magnetic permeability and structure (particle size, porosity, etc.) of the device. The permeability model is general and applicable to chemical or electrochemical reactors with similar structure, like fixed bed or fluidized bed reactors, batteries, fuel cells or supercapacitors.
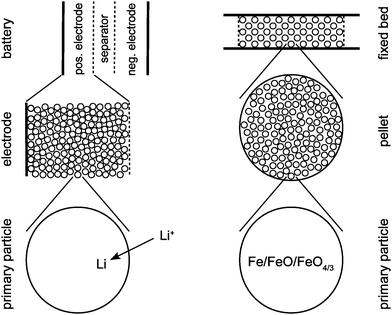 | ||
| Fig. 1 Schematic representation of the three structural scales of a LiFEPO4 battery (left) and a cyclic water gas shift reactor (right). | ||
In the next section, the permeability model is described. Next, results for permeability of a LiFePO4 battery as a function of the structure are discussed for both steady state and dynamic operation. Afterwards, the results for the CWGSR and the applicability of the method are discussed.
2 Hierarchical model for magnetic permeability of a porous reactor
As shown in Fig. 1, the model combines different scales: on the particle scale the model describes how the permeability of a single particle changes with oxidation state or SOC, respectively. On the porous medium scale, the permeability of the whole porous active medium (e.g. electrode or catalyst pellet) formed from single particles is described dependent on the porous structure (particle size, porosity etc.) of the medium. On the reactor scale both porous medium and passive components (e.g. separator and electrolyte in LiFePO4 battery or gas flow field in CWGSR) are combined to determine the permeability of the whole reactor as function of oxidation state.2.1 Particle scale
In the following section, the effective magnetic susceptibility of a single particle's active material depending of its oxidation state is described. Three different scenarios for the distribution of the oxidized phase (i.e. distribution of lithium inside the particle in LiFePO4 batteries, or the distribution of oxidized and unoxidized iron in CWGSR, respectively) are considered: first, uniform distribution of the oxidation state occurs, if intra-particle diffusion is negligible, e.g. because diffusion is faster than the reaction or intra-particle diffusion is fast compared to overall material transport in the reactor, e.g. because of the small diffusion length. This scenario is assumed for the positive carbon electrode of the LiFePO4 battery and for the CWGSR particles. The second scenario considers two distinct oxidation states in a core–shell like distribution. This can be the result of a phase separation (e.g. in LiFePO4 batteries) or oxidation of the particle with a sharp reaction front. In the third scenario, a continuous distribution of the oxidation state in the particle is considered.If the oxidized material (with permeability μh) is uniformly distributed in the host material (with permeability μo), the Maxwell-Garnet Approximation20 can be used to estimate the effective permeability of the particle material,21,22
 | (1) |
In LiFePO4 electrodes, po corresponds to the volume fraction of intercalated Li and is a function of the state-of-charge S. If the volume of the particles is assumed to be constant, it can be calculated according to
 | (2) |
 | (3) |
Two distinct oxidation states. The LiFePO4 electrode differs from intercalation electrodes in that it undergoes a phase change with the lithiated and unlithiated forms having distinct phases. This was found from X-ray diffraction (XRD) patterns of the material at various stages of lithiation.23,24 To describe this phase separation behavior, Srinivasan and Newman19 developed a shrinking core model, which was incorporated into a general model framework of a lithium battery25 and has been experimentally validated in half-cell experiments19 and full cell experiments using a natural graphite/LiFePO4 cell.26
In order to determine the effective permeability of such a core–shell structured particle, a coated sphere model21 can be used. For this model, exact results of the effective permeability are possible,
 | (4) |
| 〈μ〉 = μsps + μcpc, | (5) |
〈![[small mu, Greek, tilde]](https://www.rsc.org/images/entities/i_char_e0e0.gif) 〉 = μspc + μcps, 〉 = μspc + μcps, | (6) |
The volume fraction of LiFePO4, pLiF, is a function of the amount of inserted lithium and thus of the state-of-charge S. If the volume of the particles is assumed to be constant during intercalation (a valid assumption according to19), the volume fractions can be calculated according to
 | (7) |
 | (8) |
| pF = 1 − pLiF. | (9) |
Oxidation state gradient. In this work, continuous oxidation state gradients in the primary particles are not considered. Therefore, the approach shall only be described briefly. The determination of the oxidation state distribution in the primary particles (e.g. the distribution of Li in batteries) would require a more detailed reactor model that includes intra-particle transport, e.g. intra-particle diffusion in addition to the reaction occurring at the surface of the particle. Such transport model could be used to determine the oxidation state (or Li concentration) as a function of radius of the particle. With this, each particle radius can be seen as an infinitesimally small shell with the determined oxidation state around a core with an effective permeability. In case the transport model is solved numerically, one would obtain a discrete number of small shells. Starting from the center of the particle, the infinitesimally small shells could be added in an iterative way and in each iteration the effective permeability is determined as described in the previous section. This iteration is repeated until the particle radius is reached, giving the effective permeability of the whole particle.
2.2 Porous medium scale
The porous medium (i.e. the porous electrodes in the LiFePO4 battery or the catalyst pellets in the CWGSR) consists of primary particles, which are assumed to be electrically and thus magnetically connected to each other. Therefore, the differential effective medium approximation/Landau–Lifshitz–Looyenga (LLL) rule27 can be used.21,22 This approach starts from a homogeneous component and uses an iterative procedure. First, a small amount of the homogeneous component is replaced by the second component. Then, the resulting “effective” material is regarded as the homogeneous component for the succeeding substitution step.The LLL rule is obtained when the starting homogeneous material is the bulk medium of inclusions. If the starting material is the host matrix, the resulting equation is referred to as the differential EMT, or asymmetric Bruggeman approximation.28 The LLL equation is rigorous when the difference between the permeability of inclusions and that of the host matrix is small. It is independent of the shape of particles.
The effective permeability of the porous medium, μeffpm, obtained in this approximation is
| μeffpm = μpore + ppp((μeffpp)1/3 − (μpore)1/3)3, | (10) |
2.3 Reactor scale
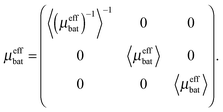
The battery is assumed to have a layered structure consisting of positive electrode, electrolyte and negative electrode. For the permeability of a layered structure, a rigorous solution exists.21 In through-plane direction, the permeability is the harmonic average of the permeabilities of the layers, | (11) |
| 〈μeffbat〉 = ppeμeffpe + psepμeffsep + peffneμeffne. | (12) |
 | (13) |
| μeffCWGSR = μgas + ppm((μeffpm)1/3 − (μgas)1/3)3. | (14) |
3 Results
The permeability model describes the permeability depending on the structure of the reactor. In the following, first the example of a LiFePO4 battery is discussed in detail. At first, equilibrium conditions are considered. After that, the influence of nonuniform lithium distribution under dynamic operation conditions is discussed. Overall, the changes in magnetic susceptibility in a LiFePO4 battery are small and challenging to measure. However, the results for the cyclic water gas shift reactor demonstrate a practically relevant example, in which the method can be easily applied.Note that for convenience, instead of permeabilities the figures show susceptibilities (χ = 1 − μ).
3.1 LiFePO4 battery: particle and electrode scales
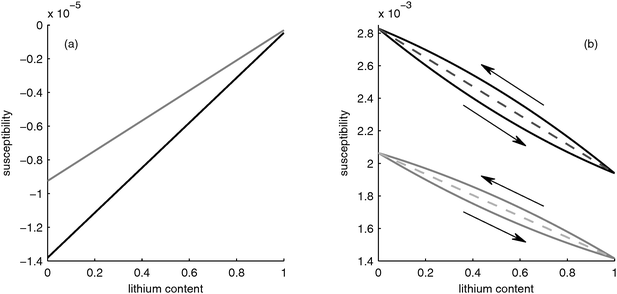
The grey curve in Fig. 2a shows the effective susceptibility of the negative electrode taking the pores filled with electrolyte into account. The effective susceptibility of the electrode is an average of the constant susceptibility of the electrolyte and the changing susceptibility of the graphite particles. Thus, the qualitative behavior of the electrode is determined by the behavior of the graphite particles.
However, as described in Section 2.1.2 lithium is not distributed uniformly inside the particles because phase separation occurs. Srinivasan19 suggested that during discharge the lithium is first incorporated into a Li-rich shell around a Li-deficient core that shrinks upon lithium insertion. If all lithium is assumed to be within a LiFePO4 shell around a FePO4 core (which would correspond to a perfect phase separation), the susceptibility of the particle behaves as depicted by the upper black curve in Fig. 2b, i.e. a slight nonlinearity occurs. On the other hand, if the electrode is charged from a fully discharged state, the Li-enriched particles are depleted from lithium, thus they have a core of LiFePO4 with a shell of FePO4 surrounding them, i.e. the phases are reversed relative to the case of discharge. This leads to a different behavior in the case of charging, as shown with the lower black curve in Fig. 2b. Thus, a hysteresis occurs, which is caused by the core–shell structure.
The effective susceptibility of the positive electrode taking into account the electrolyte-filled pores is shown by the grey curves in Fig. 2b. As in the case of the negative electrode, the porosity does not change the behavior qualitatively, i.e. the susceptibility of the electrode is determined by the susceptibility of the LiFePO4 particles.
3.2 Battery scale
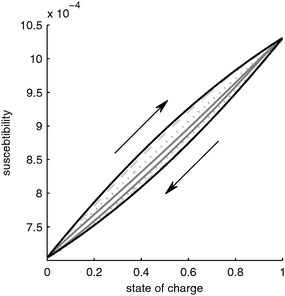
Fig. 3 shows the net susceptibility of the complete battery. The net susceptibility in through-plane direction is the harmonic average of the electrodes and the separator susceptibilities. The susceptibility of the separator is constant and the susceptibility of the negative graphite electrode is two orders of magnitude lower than that of the positive electrode (compare axes of Fig. 2a and b).With this, the susceptibility is determined mainly by the susceptibility of the material LixFePO4, i.e. by the change of the magnetic moment of the iron ions, and by the distribution of the lithium in the particle, i.e. the core–shell structure, which gives rise to a hysteresis.
Due to this hysteresis the magnetic permeability of the electrode does not depend on the SOC alone but also on the history of the electrode. Since in praxis the history of the electrode is often unknown, the determination of the SOC from the magnetic susceptibility alone would result in a significant uncertainty. For example, let us assume we would measure a susceptibility of 0.9 × 10⁻⁴. According to Fig. 3, under slow charging conditions the SOC would be between 0.55 (charging from a completely discharged battery) and 0.7 (discharging from a completely charged battery), i.e. the uncertainty would be up to 12%.
A second important practical note is that the overall change in susceptibility is very small. This makes it very challenging to measure these changes. Very sensitive instrumentation with high signal to noise ratios would be required. Together with the uncertainty due to hysteresis, this makes the practical applicability of this principle for LiFePO4 batteries questionable.
The influence of the lithium distribution on the magnetic susceptibility of the battery is shown in Fig. 3. For the case of a fully charged and fully discharged electrode, the lithium distribution is uniform, i.e. the electrode fully consists of either LiFePO4 or FePO4 particles. Thus, the lithium distribution has the biggest influence in the half-charged state. In this case, a more nonuniform Li distribution leads to a decrease of the hysteresis effect discussed in Section 3.1.2. As seen in Fig. 3, with increasing charge/discharge rate, the hysteresis disappears. A high charge/discharge rate leads to a more nonuniform lithium distribution. This results in part of the electrode being fully oxidized while another part of the electrode is fully reduced. Only a small reaction zone contains partially oxidized particles with a core–shell structure. In the fully oxidized and fully reduced parts of the electrode there is no core–shell structure of the particles and thus these parts of the electrode do not contribute to the hysteresis. Only the core–shell particles in the reaction zone determine the hysteresis. Since the reaction zone becomes narrower with higher charge/discharge rate, the portion of the electrode that has a core–shell structure diminishes and the hysteresis decreases.
3.3 Cyclic water gas shift reactor
The magnetic susceptibility of a CWGSR catalyst particle, porous pellet and reactor bed are shown in Fig. 4. It can be seen that the primary particles undergo a significant change in magnetic susceptibility during oxidation. This change is 4 orders of magnitude larger than in the case of the LiFePO4 battery described before and should be easy to measure practically. Additionally, no phase separation and thus no hysteresis occurs.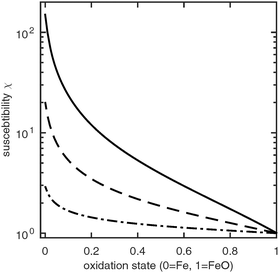 | ||
| Fig. 4 Susceptibility of a CWGSR particle (solid line), pellet (dashed line) and reactor bed (dotted line) as function of oxidation state. | ||
Qualitatively, the change in susceptibility with oxidation state is nonlinear. Upon oxidation, first a large drop in susceptibility occurs. After the particle is about 20% oxidized, the susceptibility continues to decrease approximately linearly. The same qualitative trend follows in the catalyst pellets and finally in the whole reactor bed. The overall change in susceptibility is about 149 on the particle scale; it drops to to 34 and 2 on the porous medium and reactor scale, respectively.
4 Summary and conclusions
In this work, the possibility of using the magnetic susceptibility as a direct measure of the oxidation state of a reactor with porous active material was investigated. Two specific examples were selected: a LiFePO4 battery and a cyclic water gas shift reactor. In LiFePO4 batteries, the intercalation of lithium in the negative electrode changes the oxidation state of the iron atoms; therefore the oxidation state can indicate the state-of-charge. In the cyclic water gas shift reactor, the active material acts as an oxygen storage for the reaction and the oxidation state corresponds to the oxygen level of this storage.In order to determine the change of the magnetic susceptibility with SOC or oxygen storage level, a multiscale model was used which describes the relationship between magnetic permeability and structure (particle size, porosity, lithium distribution etc.) of the reactor. In the LiFePO4 battery, it was found that the change in the susceptibility of the LiFePO4 particles on the atomic scale of the positive electrode has the largest influence on the net change of the susceptibility of the battery.
Additionally, in the particles a phase separation between lithiated and non-lithiated FePO4 occurs, which leads to a core–shell structure. The history of the electrode, i.e. whether it was charged from an uncharged state or discharged from a charged state, determines, which phase is in the core and which is in the shell. After charging, the shell consists of LiFePO4 around a FePO4 core, after discharging there is a FePO4 shell around a LiFePO4 core. This phase inversion leads to a different magnetic permeability depending on the history of the electrode, i.e. hysteresis occurs. The limiting cases for this hysteresis, namely charging from a completely discharged state and discharging from a completely charged state, were analysed.
The permeability model was coupled with an electrochemical model of a LiPePO4 electrode in order to investigate the influence of the lithium distribution in through plane direction of the electrode. Thus, the electrochemical model gives structural information depending on the operation (current density, charging time etc.) of the battery which can be used as input parameters for the permeability model.
The electrochemical model revealed the occurrence of moving reaction zones during fast charge or discharge. This reaction zone behavior leads to a decrease of the magnetic hysteresis effect because with a narrow reaction zone at high current densities only a small part of the electrode has a core–shell structure. The rest of the electrode consists of either fully oxidized or fully reduced particles which do not contribute to a hysteresis.
The model is thus insightful in terms of understanding the basic relation between magnetic properties and electrochemical processes of a battery. Practical applicability as a diagnostic method to determine the SOC is however limited. For LiFePO4 electrodes the sensitivity of the magnetic response to SOC lies in the range of 0.03% – this would require a signal-to-noise ratio of 90 dB. For other materials this requirement is expected to be significantly smaller. Additionally, the permeability depends not only on SOC but also on the history of the electrode, which is usually unknown. Thus, the discussed hysteresis leads to a high uncertainty in the determination of the SOC.
However, in cyclic water gas shift reactors, the change of susceptibility was found to be orders of magnitude larger, which allows for easy measurement. Additionally, no phase separation and thus no magnetic hysteresis occurs. This example shows that in cases, in which large changes of the magnetic nature of the active material occur, e.g. transition from ferromagnetic to paramagnetic behavior, the measurement of the magnetic susceptibility might provide insightful information about the state of the reactor.
Appendix
A Magnetic permeability of LiFePO4 and delithiated FePO4
The permeability of LiFePO4 and delithiated FePO4 can be determined from the effective magnetic moment. According to,29 the experimental magnetic moment for LixFePO4 (0 < x < 1) is in good agreement with the theoretical spin-only values for Fe3+ and Fe2+, | (15) |
| p = 2[S(S + 1)]1/2, | (16) |
The effective magnetic moment μeff is related to the Curie constant Cp,
 | (17) |
 | (18) |
B Dynamic battery model
The permeability model can describe the permeability as function of SOC in the case of uniform lithium distribution in the electrode. This assumption is valid under equilibrium conditions. However, under dynamic conditions the lithium distribution has to be taken into account. In this section, an electrochemical model of the positive electrode is developed that describes the lithium distribution dynamically during battery operation. The model includes the double layer, electrochemical reaction, ion transport in the porous electrode and electron transport in the solid phase. Lithium transport into the particle and the core–shell structure of the LixFePO4 particles are described in a simplified way. Afterwards, the resulting lithium distribution is coupled into the permeability model. Thus, the permeability of the battery under dynamic conditions can be analysed.At the surface of the particles, the following reaction occurs:
 | (19) |
 | (20) |
The boundary conditions to solve eqn (20) under galvanostatic or potentiostatic operation are
 | (21) |
 | (22) |
| ϕl(z = L, t) = ϕsep,a(t) ∀t (potentiostatic) | (23) |
The potential distribution in the solid, electron conducting phase under the assumption of electroneutrality is given by
 | (24) |
 | (25) |
| ϕs(z = 0, t) = 0 ∀t | (26) |
 | (27) |
| Δϕ = ϕs − ϕl | (28) |
| η = Δϕ − Δϕ0,ref | (29) |
 | (30) |
In this work, we use a simplified approach to describe the shrinking core behavior. It is assumed that all lithium in the particle is in a single LiFePO4 phase (in the core during charging, when Li is removed from the particle or in the shell during discharge, when Li is incorporated). The rest of the particle consists of a FePO4 phase and both phases are perfectly separated from each other. In this case, the surface of the particle consists either of FePO4 during charge or of LiFePO4 during discharge. The reaction rate is independent of surface concentration in the solid but different reaction rate constants for charge and discharge are possible. This can be described as
 | (31) |
![[k with combining tilde]](https://www.rsc.org/images/entities/i_char_006b_0303.gif) ox = ox = ![[k with combining tilde]](https://www.rsc.org/images/entities/i_char_006b_0303.gif) oxch (charging), oxch (charging), | (32) |
![[k with combining tilde]](https://www.rsc.org/images/entities/i_char_006b_0303.gif) ox = ox = ![[k with combining tilde]](https://www.rsc.org/images/entities/i_char_006b_0303.gif) oxdch (discharging). oxdch (discharging). | (33) |
 | (34) |
| rox = 0 for nLi ≥ nmaxLi. | (35) |
The model was solved using the parameters in Table 1.
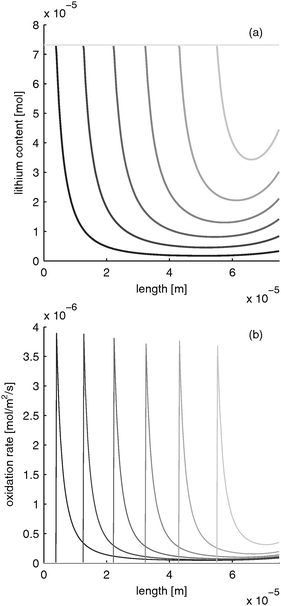
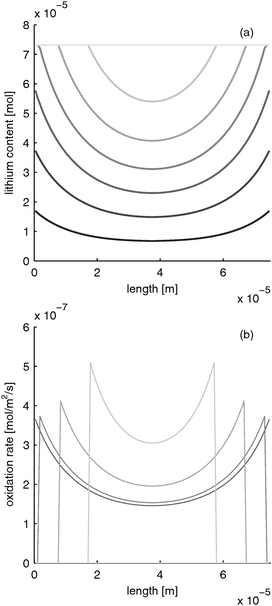
B.2.1 Limited electron conductivity. LiFePO4 has the disadvantage of poor rate performance due to its low electron conductivity (10−9 S m−1).30 Several methods are used to enhance electron conductivity: carbon coating,31 ion doping32 or nano networking.33 However, in the works of Srinivasan et al. with carbon coated particles, the electron conductivity was determined to be about 10 times lower than the electrolyte conductivity. If the electron conductivity is that low and the battery is discharged rapidly, the distribution of lithium content and reaction rate evolves as depicted in Fig. 5. The limited electron conduction from the current collector side into the electrode leads to a reduction of the electrode at the current collector side (z = 0) first. After the material in this “reaction zone” is reduced, the reaction zone moves further toward the separator side. This results in a moving reaction zone. With this, lithium is inserted from the current collector side towards the separator side of the electrode.
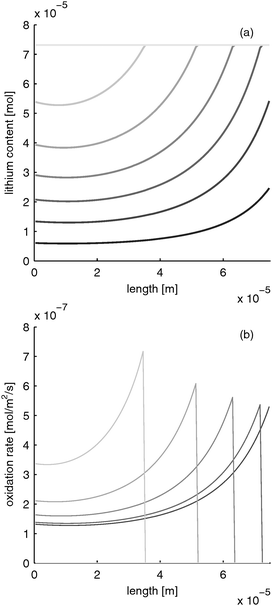
B.2.2 Limited electrolyte conductivity. If the electron conductivity could be significantly increased, the electrolyte conductivity becomes the limiting factor during rapid discharge. The distribution of lithium content and reaction rate for this scenario are shown in Fig. 6. Due to the limited ion transport from the separator into the electrode, the electrode is reduced in a small reaction zone at the separator–electrode interface first. When the material in this zone is reduced, the reaction zone moves into the electrode. Correspondingly, lithium is inserted into the electrode from the separator towards the current collector side.
B.2.3 Limited electrolyte and electron conductivity. If electron and ion conductivity are equally limited, both moving reaction zones can occur simultaneously, as shown in Fig. 7. Starting from separator and current collector side, the electrode is reduced towards the inside of the electrode. Thus, lithium is inserted in the inside part of the electrode last.
Please note that the reaction rate profiles in Fig. 5–7b show the drop of the reaction rate when the material is fully reduced as a step function. This results in a spike shape of the maximum reaction rate. These features are caused by the simplifications made in Section B.1. Nevertheless, the model is able to capture the main phenomena during electrode operation.
 | (36) |
Acknowledgements
We appreciate the discussions with the staff of Cadex Electronics Inc. and especially Joe Geofroy and Delaram Abdollazadeh and their experimental trials. Furthermore we are thankful for the financial support from the NSERC Engage Grants program.References
- C. Kittel, Introduction to Solid State Physics, John Wiley & Sons, 1986 Search PubMed.
- P. Heidebrecht, C. Hertel and K. Sundmacher, Conceptual analysis of a cyclic water gas shift reactor, Int. J. Chem. Reactor Eng., 2008, 6, A19 CrossRef.
- P. Heidebrecht and K. Sundmacher, Thermodynamic analysis of a cyclic water gas-shift reactor (CWGSR) for hydrogen production, Chem. Eng. Sci., 2009, 64(23), 5057–5065 CrossRef CAS PubMed.
- C. Hertel, P. Heidebrecht and K. Sundmacher, Experimental quantification and modelling of reaction zones in a cyclic watergas shift reactor, Int. J. Hydrogen Energy, 2012, 37(3), 2195–2203 CrossRef CAS PubMed.
- S. Piller, M. Perrin and A. Jossen, Methods for state-of-charge determination and their applications, J. Power Sources, 2001, 96(1), 113–120 CrossRef CAS.
- V. Pop, H. J. Bergveld, P. H. L. Notten and P. P. L. Regtien, State-of-the-art of battery state-of-charge determination, Meas. Sci. Technol., 2005, 16(12), R93–R110 CrossRef CAS.
- J. Vetter, P. Novak, M. R. Wagner, C. Veit, K. C. Moller, J. O. Besenhard, M. Winter, M. Wohlfahrt-Mehrens, C. Vogler and A. Hammouche, Ageing mechanisms in lithium-ion batteries, J. Power Sources, 2005, 147(1–2), 269–281 CrossRef CAS PubMed.
- E. Bekaert, P. Balaya, S. Murugavel, J. Maier and M. Menetrier, Li-6 MAS NMR investigation of electrochemical lithiation of RuO2: Evidence for an interfacial storage mechanism, Chem. Mater., 2009, 21(5), 856–861 CrossRef CAS.
- J. H. Trill, C. Q. Tao, M. Winter, S. Passerini and H. Eckert, NMR investigations on the lithiation and delithiation of nanosilicon-based anodes for Li-ion batteries, J. Solid State Electrochem., 2011, 15(2), 349–356 CrossRef CAS.
- K. Gotoh, M. Maeda, A. Nagai, A. Goto, M. Tansho, K. Hashi, T. Shimizu and H. Ishida, Properties of a novel hard-carbon optimized to large size Li ion secondary battery studied by Li-7 NMR, J. Power Sources, 2006, 162(2), 1322–1328 CrossRef CAS PubMed.
- H. Fujimoto, A. Mabuchi, K. Tokumitsu, N. Chinnasamy and T. Kasuh, (7)Li nuclear magnetic resonance studies of hard carbon and graphite/hard carbon anode for Li ion battery, J. Power Sources, 2011, 196(3), 1365–1370 CrossRef CAS PubMed.
- H. Hain, M. Scheuermann, R. Heinzmann, L. Wunsche, H. Hahn and S. Indris, Study of local structure and Li dynamics in Li4 + xTi5O12 (0 < =x < =5) using Li-6 and Li-7 NMR spectroscopy, Solid State Nucl. Magn. Reson., 2012, 42, 9–16 CrossRef CAS PubMed.
- S. Chandrashekar, N. M. Trease, H. J. Chang, L. S. Du, C. P. Grey and A. Jerschow, Li-7 MRI of Li batteries reveals location of microstructural lithium, Nat. Mater., 2012, 11(4), 311–315 CrossRef CAS PubMed.
- L. J. M. Davis, B. L. Ellis, T. N. Ramesh, L. F. Nazar, A. D. Bain and G. R. Goward, Li-6 1D EXSY NMR spectroscopy: A new tool for studying lithium dynamics in paramagnetic materials applied to monoclinic Li2VPO4F, J. Phys. Chem. C, 2011, 115(45), 22603–22608 CAS.
- R. Bhattacharyya, B. Key, H. L. Chen, A. S. Best, A. F. Hollenkamp and C. P. Grey, In situ NMR observation of the formation of metallic lithium microstructures in lithium batteries, Nat. Mater., 2010, 9(6), 504–510 CrossRef CAS PubMed.
- J. Xiao, J. Z. Hu, D. Y. Wang, D. H. Hu, W. Xu, G. L. Graff, Z. M. Nie, J. Liu and J. G. Zhang, Investigation of the rechargeability of Li–O2 batteries in non-aqueous electrolyte, J. Power Sources, 2011, 196(13), 5674–5678 CrossRef CAS PubMed.
- F. Poli, J. S. Kshetrimayum, L. Monconduit and M. Letellier, New cell design for in situ NMR studies of lithium-ion batteries, Electrochem. Commun., 2011, 13(12), 1293–1295 CrossRef CAS PubMed.
- N. M. Trease, L. N. Zhou, H. J. Chang, B. Y. X. Zhu and C. P. Grey, In situ NMR of lithium ion batteries: Bulk susceptibility effects and practical considerations, Solid State Nucl. Magn. Reson., 2012, 42, 62–70 CrossRef CAS PubMed.
- V. Srinivasan and J. Newman, Discharge model for the lithium iron-phosphate electrode, J. Electrochem. Soc., 2014, 151(10), A1517 CrossRef PubMed.
- J. C. Maxwell Garnett, Colours in metal glasses and in metallic films, Philos. Trans. R. Soc., A, 1904, 203, 385–420 CrossRef.
- S. Torquato, Random Heterogeneous Materials – Microstructure and Macroscopic Properties, Springer, 2002 Search PubMed.
- A. N. Lagarkov and K. N. Rozanov, High-frequency behavior of magnetic composites, J. Magn. Magn. Mater., 2009, 321(14), 2082–2092 CrossRef CAS PubMed.
- A. K. Padhi, K. S. Nanjundaswamy and J. B. Goodenough, Phospho-olivines as positive-electrode materials for rechargeable lithium batteries, J. Electrochem. Soc., 1997, 144(4), 1188–1194 CrossRef CAS PubMed.
- A. Yamada, Y. Kudo and K. Y. Liu, Phase diagram of Lix(MnyFe(1−y)PO4) (0 <= x, y <= 1), J. Electrochem. Soc., 2001, 148(10), A1153–A1158 CrossRef CAS PubMed.
- K. E. Thomas, J. Newman and R. M. Darling, Advances in Lithium-Ion Batteries, Kluwer Academic Publishers, 2002, ch. 12, pp. 345–392 Search PubMed.
- V. Srinivasan and J. Newman, Design and optimization of a natural graphite/iron phosphate lithium-ion cell, J. Electrochem. Soc., 2004, 151(10), A1530 CrossRef CAS PubMed.
- L. Landau and E. Lifshitz, Electrodynamics of Continuous Media, Pergamon Press, Oxford, 1960 Search PubMed.
- D. A. G. Bruggeman, Berechnung verschiedener physikalischer Konstanten von heterogenen Substanzen, Ann. Phys., 1935, 24, 636–679 CrossRef CAS PubMed.
- P. Jozwiak, J. Garbarczyk, F. Gendron, A. Mauger and C. M. Julien, Disorder in LixFePO4: From glasses to nanocrystallites, J. Non-Cryst. Solids, 2008, 354(17), 1915–1925 CrossRef CAS PubMed.
- C. S. Wang and J. Hong, Ionic/electronic conducting characteristics of LiFePO4 cathode materials – The determining factors for high rate performance, Electrochem. Solid-State Lett., 2007, 10(3), A65–A69 CrossRef CAS PubMed.
- N. Ravet, J. B. Goodenough, S. Besner, M. Simoneau, P. Hovington and M. Armand, The Electrochemical Society and the Electrochemical Society of Japan Meeting Abstracts, Honululu, HI, 1999, vol. 99–22 Search PubMed.
- S. Y. Chung, J. T. Bloking and Y. M. Chiang, Electronically conductive phospho-olivines as lithium storage electrodes, Nat. Mater., 2002, 1(2), 123–128 CrossRef CAS PubMed.
- P. S. Herle, B. Ellis, N. Coombs and L. F. Nazar, Nano-network electronic conduction in iron and nickel olivine phosphates, Nat. Mater., 2004, 3(3), 147–152 CrossRef CAS PubMed.
- C. Lin, J. A. Ritter, B. N. Popov and R. E. White, A mathematical model of an electrochemical capacitor with double-layer and faradaic processes, J. Electrochem. Soc., 1999, 146(9), 3168–3175 CrossRef CAS PubMed.
| This journal is © the Owner Societies 2015 |

