 Open Access Article
Creative Commons Attribution 3.0 Unported Licence
Thermal diffusivity measured using a single plasmonic nanoparticle†
André
Heber
a,
Markus
Selmke
b and
Frank
Cichos
*a
aUniversität Leipzig, Linnéstr. 5, 04103 Leipzig, Germany. E-mail: cichos@physik.uni-leipzig.de; Fax: +49 341 97 32598; Tel: +49 341 97 32571
bPrinceton University, Chemistry Department, Princeton, New Jersey 08544, USA
First published on 17th July 2015
Abstract
A method to measure thermal diffusivity around a single heated gold nanoparticle is presented. It is based on photothermal single particle microscopy and employs the phase delay of temperature modulation due to finite thermal diffusivity. The phase delay is detected optically averaging over the focal volume of a diffraction limited beam of light. Thermal diffusivity is extracted by comparison to electromagnetic scattering calculations of the photothermal signal. Measurements in the solid (polymer) and liquid (water) are presented and compare well with literature data. The method paves the way for extended measurements of non-diffusive and heterogeneous heat transport in complex media.
1 Introduction
The understanding of thermal transport processes has greatly benefitted from numerous methods that measure heat transfer close to surfaces or of macroscopic samples. The general principle behind these measurements is that thermal perturbation is induced and then monitored. The temporal evolution of this thermal perturbation is a reporter for thermal diffusivity. There are many different methods that implement this principle. Using the 3ω method a metallic wire acts as a heating and temperature probe at the same time.1 Other methods apply a delta-like heating by a pulsed laser to an absorbing surface2–4 or particles5,6 and then measure transient reflectance or absorption that is related to temperatures using a delayed probe laser pulse. Scanning thermal microscopy7 probes temperatures directly and measures thermal conductivities at high spatial resolution, but requires physical contact with the probe. Recently, surface plasmon resonance shifts of single gold nanoparticles have been used to quantify the average thermal conductivity at an interface.8 Macroscopic thermal lensing can be utilized to measure thermal diffusivities in solids,9 liquids and colloidal suspensions.10In this paper, we demonstrate the capabilities of quantitative single particle photothermal (PT) microscopy11–13 to assess thermal diffusivities locally within a medium using a far-field optical readout. This is not possible with most other methods apart from transient absorption,5,6 which employs picosecond pulsed lasers and thermal lensing microscopy.9 Thermal diffusivity measurements using PT microscopy will enable the study of thermal transport in samples where gold nanoparticles are already used as tracers14 or for local temperature manipulations.15
PT microscopy is a versatile method to study absorbing particles. This technique enables absorption measurements of single nanoparticles and single molecules,16 imaging14,17 as well as correlation spectroscopy, i.e. to investigate dynamics in solution.18,19 The PT contrast originates from optically excited objects that dissipate their thermal energy into the surrounding medium as heat. Around these nano-sources of heat a temperature profile is created that brings about a refractive index change due to thermal expansion. As the photothermally induced transmission change is small as compared to the overall transmission a lock-in detection scheme is put forward in which the heating laser is harmonically modulated.20 The refractive index change is detected by a continuous wave laser in transmission demodulated by a lock-in amplifier. The amplitude of the PT signal has been shown to depend on the modulation frequency of optical heating9,20–23 due to the finite thermal diffusivity. Therefore, the frequency dependence of the photothermal signal contains information on the thermal transport property of the medium surrounding the nanoparticle. This feature can be used to selectively detect absorption using just a single laser beam.23 To extract thermal diffusivity from the frequency dependence of the PT signal it has to be modelled quantitatively. Attempts have been made but have given unrealistic thermal diffusivities due to a simplified model24 or the neglect of aberrations.23 To make PT microscopy a quantitative method for the measurement of thermal diffusivities the PT signal is calculated for different modulation frequencies. The modelling starts with the calculation of the thermal transport around the harmonically heated gold nanoparticle leading to a refractive index profile. Afterwards the transmission signal of the detection laser as measured by a photodiode is determined.
2 Numerical calculations
The gold nanoparticle is excited at its plasmon resonance and dissipates the excitation energy as heat into its surrounding medium which increases the temperature locally. An analytical solution for the thermal transport of a harmonically heated sphere has recently been derived.25 It includes the heat capacity of the nanoparticle as well as interfacial thermal resistances. However, in our experiments the mentioned contributions are negligibly small. Only at modulation frequencies f larger than 10 MHz the heat capacity of the nanoparticle starts to show an effect on the temperature profiles. To see an effect on the interfacial thermal resistance modulation frequencies of more than 100 MHz have to be used. For those reasons the time dependent temperature profile ΔT(r,t) was derived in an appropriate limit based on the theory of Berto et al.25 retaining the finite particle size only | (1) |
 | (2) |
 | (3) |
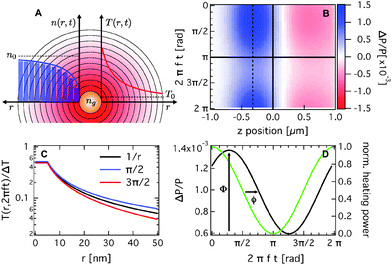
 the thermal diffusion length and α being the thermal diffusivity of the medium which is the quotient of thermal conductivity divided by the volumetric heat capacity. The thermal diffusion length characterizes how far thermal energy is transported during one modulation cycle. The term N is a small correction to the amplitude of temperature modulation and ψ(r) its phase delay in a certain distance r from the centre of the nanoparticle. Eqn (3) is slightly more accurate for finite R as compared to the temperature profile of a point source26 typically used in this context and does not contain any additional material parameters. The temperature profiles differ significantly from a purely one over distance dependence (see Fig. 1C). The temperature elevation alters the refractive index locally as
 | (4) |
The thermorefractive coefficient  quantifies the refractive index change with temperature. At an instance the gold nanoparticle is surrounded by a radially symmetric refractive index profile that is modulated in time being induced by the harmonically modulated heating laser. The situation is sketched in Fig. 1A. The PT signal depends on the exact shape of the non-absorbed detection laser beam as it averages over different ψ(r). The two laser beams are co-aligned using their scatter images and focussed by an oil-immersed objective (NA = 1.4). Their transmission is collected by a dry objective (NA = 0.8). The peak intensity of both laser beams have no displacement in any spatial dimension. The aberrations caused by the high NA objectives significantly alter the intensity distributions, which needs to be taken into account when modelling the photothermal signal.
The transmission signal of the non-absorbed laser beam as detected by a photodiode is computed utilizing a generalized Lorenz–Mie framework11,27 for the gold nanoparticle and the time-dependent temperature profile calculated using eqn (3). This step is repeated for different positions of laser foci with respect to the nanoparticle and times during the heating cycle. The results of such a calculation is displayed in Fig. 1B. The image shows the variation of the transmission signal due to the modulated heating power and the nanoparticle at each position z along the optical axis. The nanoparticle is positioned at z = 0. A dispersive lensing signature is found when moving the particle along the optical axis. This signal is on top of the transmission signal of the nanoparticle without the refractive index profile.27 For particles smaller than 3 nm in radius this contribution disappears and a pure dispersive signal due to the refractive index profile is observed. More importantly the plot in Fig. 1B is not symmetric with respect to the horizontal line. This is due to the fact that if the optical heating of the nanoparticle is turned off the thermal energy is not instantaneously dissipated into the surrounding medium. This results in a phase delay ϕ of the detected signal with respect to the optical heating. Fig. 1D shows the time dependent transmission signal when the detection laser focus and the nanoparticle are displaced by z = −320 nm which also corresponds to the solid vertical line in Fig. 1B and to about one Rayleigh range. Here the transmission signal due to the nanoparticle is extremal. Phase delay ϕ and amplitude Φ of the PT signal for each position z in Fig. 1B are determined by calculating the fundamental Fourier components of transmission profiles as in Fig. 1D.
3 Experiments
We record the PT signal for single gold nanoparticles in a polymer matrix (polydimethylsiloxan – PDMS; SYLGARD 184 from Dow Corning). Heating and detection laser are co-aligned and focussed onto single gold nanoparticles (Nanopartz, R = 5 nm). The detection power was adjusted to Pd = 1.9 mW at the wavelength λd = 635 nm and the heating power to Ph = 0.9 mW at λh = 532 nm. The transmission signal of the detection laser is recorded using a photodiode. The modulated transmission signal is analyzed using a lock-in amplifier resulting in two different components one being in-phase Φcos and the other one being out-of-phase Φsin with the modulated optical heating. The latter two correspond to the fundamental Fourier components mentioned in a paragraph before. Further details on the experimental implementation have previously been reported in ref. 11. The signal to noise ratio of the PT signal is around 40 for accumulation times of 20 μs. The relations | (5) |
| ϕ = arctan(Φsin/Φcos) | (6) |
3.1 Measurement in the solid
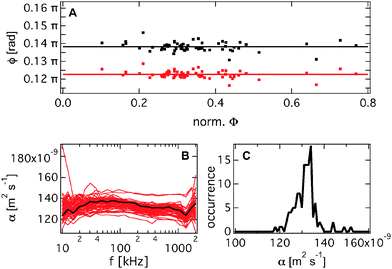
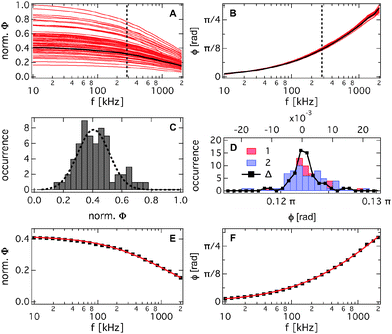
Measurement results for the normalized amplitude of 62 different R = 5 nm sized gold nanoparticles in PDMS are shown in Fig. 2A. Each data point is averaged over 0.8 s giving a SNR of approximately 104. The measurements were performed twice on every nanoparticle at modulation frequencies f between 10 kHz and 2 MHz. The amplitude of the PT signal saturates for low f and decreases with increasing frequencies (see Fig. 2A). This behaviour is observed for all particles.The recorded signal amplitudes vary significantly from particle to particle (see Fig. 2C), which can be explained by the proportionality of Φ to the particle's volume. From the standard deviation of the normalized amplitude being 40% one can conclude that the size dispersion of the nanoparticles is in the order of 12%, which is in agreement with the value given by the manufacturer being 10%.
The phase delays ϕ of different particles are shown in Fig. 2B as a function of the modulation frequency. The phase delay increases with the modulation frequency. At low modulation frequencies the temperature profiles show a one over distance dependence from the nanoparticle where only the amplitude is modulated. Therefore, the phase delay is very small. At higher f the temperature modulation is diminished and the phase delay increases. The phase delay for very high frequencies will saturate at a finite value. A temperature profile that is constant in time with a one over distance dependence is retained. At one particular modulation frequency f the spread of ϕ is much lower as compared to the spread of the normalized amplitude (see Fig. 2C and D). The variance of ϕ for all measurements is comparable to the variance in case the difference between two measurements of the same particle is taken. Therefore, we were not able to detect any heterogeneities in the sample concerning the thermal transport which is an expected result. In Fig. 2E and F the results of the numerical calculations are scaled to ϕ and Φ for one measurement. The scaling factor is directly proportional to the thermal diffusivity. The numerical results fit the experimental ones in their frequency dependence very well.
At a fixed heating power we are able to see the expected proportionality between the signal amplitude Φ and the particle's volume.11 This allows us to test whether the size dispersion has an influence on the phase delay by correlating ϕ and Φ at modulation frequencies of 284 and 355 kHz (see Fig. 3C). The Pearson correlation coefficients of about −0.2 indicate that both quantities are only weakly correlated (see Fig. 3C). The scatter of the measured phase delays and thereby of the thermal diffusivities in Fig. 2D and 3A, B stem from the positioning error of the nanoparticle in the laser foci. A positioning uncertainty of the nanoparticle in the co-aligned laser foci of 30 nm perpendicular to the optical axis and 80 nm along the latter results in a change in the phase delay of 1.5 × 10⁻² rad at f = 284 kHz corresponding to an error of 8% in the thermal diffusivity.
 | ||
| Fig. 3 (A) Phase delay plotted against the normalized amplitude at the modulation frequencies f = 284 kHz (red) and f = 355 kHz (black). The Pearson correlation coefficients are −0.16 and −0.20 respectively. The solid lines mark the average phase delays. (B) The thermal diffusivity as determined from the phase delay at every measured frequency. The black colored data set has already been discussed in detail in Fig. 2E and F. (C) Average thermal diffusivities are depicted as a histogram for every particle and measurement. The average thermal diffusivity is α = (1.3 ± 0.1) × 10−7 m2 s−1. | ||
For the determination of the thermal diffusivity the measurement of the phase delay ϕ at a single modulation frequency should in principle suffice as the phase delay is independent of the heating power and the dependence on the particle's size is negligible as compared to the statistical errors. Therefore, the thermal diffusivity is determined by comparing the experimentally determined phase delay ϕ to the calculation. The thermal diffusivity measured using this procedure is shown in Fig. 3B. Thermal diffusivities averaged over all modulation frequencies are shown as a histogram in Fig. 3C. The average thermal diffusivity is determined with (1.3 ± 0.1) × 10−7 m2 s−1. Thermal diffusivities as measured by photothermal microscopy agree well with macroscopic measurements performed in a laser flash apparatus (LINSEIS LFA 1000) giving (1.30 ± 0.02) × 10−7 m2 s−1. The thermal diffusivity still shows a small systematic dependence on the modulation frequency (see Fig. 3B) likely for the reason that the aberrations are not perfectly captured by our numerical calculations.
3.2 Measurement in the liquid
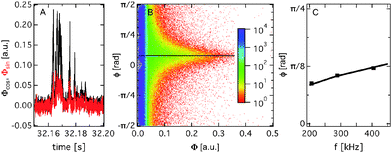
So far it has been demonstrated that PT microscopy can be extended to study thermal diffusivities in solids. In solids the two co-aligned laser beams are focussed onto an immobile particle and phase delays are recorded during frequency sweeps at the position where the PT amplitude is maximal. In solution gold nanoparticles perform Brownian motion and signal bursts are recorded whenever a particle passes the detection focus (see Fig. 4A). Therefore, gold nanoparticles (R = 30 nm in size; BBI Solutions) dissolved in water are put between two cover slips and sealed with silicon oil. The heating power is adjusted to Ph = 0.42 mW leading to a temperature increase at the particle's surface of maximal 50 K. The detection power is Pd = 1.7 mW. The focal volume is approximately 500 times smaller than the average volume occupied by a single particle ensuring single particle signals. Again the two components of the PT signal are recorded, namely the in-phase (Φcos, black) and out-of-phase (Φsin, red) components, allowing the calculation of the PT signal's phase delay and amplitude. We create 2D histograms counting the number of 20 μs time bins having a certain amplitude and phase delay as in Fig. 4B. The histogram is constructed from a 45 min long time series. The average phase delay is extracted as follows. From the histogram line profiles are taken at a particular amplitude and the average phase delay is extracted using a Gaussian fit. This procedure is repeated for all the amplitude bins. For large signal amplitudes Φ the phase delays are independent of Φ. The corresponding average phase delays are plotted for three different modulation frequencies in Fig. 4C. The phase delays allow to extract the thermal diffusivity of water with (1.4 ± 0.2) × 10−7 m2 s−1, which agrees very well with the literature value of 1.43 × 10⁻⁷ m2 s−1.4 Conclusions
We have extended photothermal microscopy to measure thermal diffusivities with gold nanoparticles of a few nanometers in radius. The presented measurements can be conducted in every existing photothermal microscopy setup and employs the phase information, which is typically neglected. Our technique will enable spatially resolved thermal transport measurements for materials previously not accessible for example of plasmonic networks.28,29 Based on these findings we will be able to measure anisotropic thermal diffusivities as well as latent heats. Heterogeneous and so far unexplored biological materials become accessible as well but future studies have to investigate the spatial resolution of the thermal diffusivity measurement in detail. A thorough understanding of the frequency dependence of the photothermal signal has recently led to the selective detection of absorbing nanoparticles using a single laser beam.23 The insights presented above can also contribute to a more detailed understanding of nanoscopic phase transitions.30,31Acknowledgements
We thank Felix Fahrnbauer for the laser flash measurements. We acknowledge financial support from the European Union and the Free State of Saxony, the DFG Forschergruppe “From Local Constraints to Macroscopic Transport” and the graduate school BuildMoNa.References
- D. G. Cahill, Rev. Sci. Instrum., 1990, 61, 802–808 CrossRef CAS PubMed.
- W. J. Parker, R. J. Jenkins, C. P. Butler and G. L. Abbott, J. Appl. Phys., 1961, 32, 1679–1684 CrossRef CAS PubMed.
- D. G. Cahill, W. K. Ford, K. E. Goodson, G. D. Mahan, A. Majumdar, H. J. Maris, R. Merlin and S. R. Phillpot, J. Appl. Phys., 2003, 93, 793–818 CrossRef CAS PubMed.
- S. Dilhaire, G. Pernot, G. Calbris, J. M. Rampnoux and S. Grauby, J. Appl. Phys., 2011, 110, 114314 CrossRef PubMed.
- O. M. Wilson, X. Hu, D. G. Cahill and P. V. Braun, Phys. Rev. B: Condens. Matter Mater. Phys., 2002, 66, 224301 CrossRef.
- J. Huang, J. Park, W. Wang, C. J. Murphy and D. G. Cahill, ACS Nano, 2013, 7, 589–597 CrossRef CAS PubMed.
- A. Majumdar, Annu. Rev. Mater. Sci., 1999, 29, 505–585 CrossRef CAS.
- K. Setoura, Y. Okada, D. Werner and S. Hashimoto, ACS Nano, 2013, 7, 7874–7885 CrossRef CAS PubMed.
- O. O. Dada, P. E. Feist and N. J. Dovichi, Appl. Opt., 2011, 50, 6336–6342 CrossRef PubMed.
- L. Rodriguez, J. F. Cárdenas-Garca and C. Costa Vera, Opt. Lett., 2014, 39, 3406–3409 CrossRef CAS PubMed.
- M. Selmke, M. Braun and F. Cichos, ACS Nano, 2012, 6, 2741–2749 CrossRef CAS PubMed.
- M. Selmke, M. Braun and F. Cichos, Opt. Express, 2012, 20, 8055–8070 CrossRef CAS PubMed.
- M. Selmke, M. Braun and F. Cichos, J. Opt. Soc. Am. A, 2012, 29, 2237–2241 CrossRef PubMed.
- D. Lasne, G. A. Blab, S. Berciaud, M. Heine, L. Groc, D. Choquet, L. Cognet and B. Lounis, Biophys. J., 2006, 91, 4598–4604 CrossRef CAS PubMed.
- M. Iwaki, A. H. Iwane, K. Ikezaki and T. Yanagida, Nano Lett., 2015, 15, 2456–2461 CrossRef CAS PubMed.
- A. Gaiduk, M. Yorulmaz, P. V. Ruijgrok and M. Orrit, Science, 2010, 330, 353–356 CrossRef CAS PubMed.
- C. Leduc, S. Si, J. Gautier, M. Soto-Ribeiro, B. Wehrle-Haller, A. Gautreau, G. Giannone, L. Cognet and B. Lounis, Nano Lett., 2013, 13, 1489–1494 CAS.
- R. Radünz, D. Rings, K. Kroy and F. Cichos, J. Phys. Chem. A, 2009, 113, 1674–1677 CrossRef PubMed.
- M. Selmke, R. Schachoff, M. Braun and F. Cichos, RSC Adv., 2013, 3, 394–400 RSC.
- S. Berciaud, L. Cognet, G. A. Blab and B. Lounis, Phys. Rev. Lett., 2004, 93, 257402 CrossRef.
- M. Harada, M. Shibata, T. Kitamori and T. Sawada, Anal. Chim. Acta, 1995, 299, 343–347 CrossRef CAS.
- D. Boyer, P. Tamarat, A. Maali, B. Lounis and M. Orrit, Science, 2002, 297, 1160–1163 CrossRef CAS PubMed.
- M. Selmke, A. Heber, M. Braun and F. Cichos, Appl. Phys. Lett., 2014, 105, 065428 CrossRef PubMed.
- S. Berciaud, D. Lasne, G. A. Blab, L. Cognet and B. Lounis, Phys. Rev. B: Condens. Matter Mater. Phys., 2006, 73, 045424 CrossRef.
- P. Berto, M. S. A. Mohamed, H. Rigneault and G. Baffou, Phys. Rev. B: Condens. Matter Mater. Phys., 2014, 90, 035439 CrossRef.
- H. S. Carslaw and J. C. Jaeger, Conduction of Heat in Solids, Oxford University Press, USA, 2nd edn, 1959 Search PubMed.
- M. Selmke and F. Cichos, J. Opt. Soc. Am. A, 2014, 31, 2370–2384 CrossRef PubMed.
- G. Baffou, P. Berto, E. Bermúdez Ureña, R. Quidant, S. Monneret, J. Polleux and H. Rigneault, ACS Nano, 2013, 7, 6478–6488 CrossRef CAS PubMed.
- P. Ben-Abdallah, R. Messina, S.-A. Biehs, M. Tschikin, K. Joulain and C. Henkel, Phys. Rev. Lett., 2013, 111, 174301 CrossRef.
- A. Heber, M. Selmke and F. Cichos, ACS Nano, 2014, 8, 1893–1898 CrossRef CAS PubMed.
- L. Hou, M. Yorulmaz, N. R. Verhart and M. Orrit, New J. Phys., 2015, 17, 013050 CrossRef CAS.
Footnote |
| † Electronic supplementary information (ESI) available. See DOI: 10.1039/c5cp02920a |
| This journal is © the Owner Societies 2015 |


