
 Open Access Article
 This Open Access Article is licensed under a Creative Commons Attribution-Non Commercial 3.0 Unported Licence
Complexes of a naphthalimide photoacid with organic bases, and their excited-state dynamics in polar aprotic organic solvents†
Tatu
Kumpulainen‡
*,
Bert H.
Bakker
and
Albert M.
Brouwer
 *
*
Van't Hoff Institute for Molecular Sciences, Faculty of Science, University of Amsterdam, P. O. Box 94157, 1090 GD Amsterdam, The Netherlands. E-mail: tatu.kumpulainen@gmail.com; a.m.brouwer@uva.nl
First published on 17th July 2015
Abstract
Complex formation and intermolecular excited-state proton transfer (ESPT) between a dihydroxy-1,8-naphthalimide photoacid and organic bases are investigated in polar aprotic solvents. First, quantum chemical calculations are used to explore the acid–base and spectroscopic properties and to identify energetically favorable complexes. The two hydroxyl groups of the photoacid enable stepwise formation of 1![[thin space (1/6-em)]](https://www.rsc.org/images/entities/char_2009.gif) :1 and 1:2 complexes. Weak bases exhibit only hydrogen-bonding interactions whereas strong bases are able to deprotonate one of the hydroxyl groups resulting in strong negative cooperativity (K1 ≫ 4K2) in the formation of the 1:2 complex. Time-resolved fluorescence studies of the complexes provide strong indications of a three-step dissociation process. The species involved in the model are: a hydrogen-bonded complex, a hydrogen-bonded ion pair, a solvent separated ion pair, and a free ion pair.
:1 and 1:2 complexes. Weak bases exhibit only hydrogen-bonding interactions whereas strong bases are able to deprotonate one of the hydroxyl groups resulting in strong negative cooperativity (K1 ≫ 4K2) in the formation of the 1:2 complex. Time-resolved fluorescence studies of the complexes provide strong indications of a three-step dissociation process. The species involved in the model are: a hydrogen-bonded complex, a hydrogen-bonded ion pair, a solvent separated ion pair, and a free ion pair.
Introduction
Photoacids, compounds with increased acidity in an electronically excited state, have enabled time-resolved studies of proton-transfer reactions.1–4 Despite the wealth of studies aimed at elucidating the early events in the dissociation process several different interpretations have been proposed in the literature.After more than half a century of research5,6 on the best-known photoacid 8-hydroxypyrene-1,3,6-trisulfonate (HPTS) the exact excited-state proton-transfer (ESPT) mechanism is still under debate. The deprotonation kinetics in H2O have been studied by several groups and the emerging ESPT scheme is governed by three time constants of ∼300 fs, ∼3 ps and ∼90 ps followed by the decay of the produced anionic species.7–18 While the authors generally agree that the fastest and slowest time components correspond to solvation dynamics and the formation of the anionic species after the ESPT reaction, respectively, the intermediate step has had several interpretations such as relaxation to an intermediate electronic state,9 a slow charge redistribution,12,13 solvation dynamics or hydrogen-bond rearrangement,14 or an additional step in the original two-step ESPT mechanism.16–18
Fayer and co-workers have studied photophysical properties and early ESPT kinetics of HPTS and closely related pyranine derivatives in water and in organic solvents (dimethylsulfoxide (DMSO) and benzene in the presence of triethylamine (TEA)).12,13 In their studies, the authors attributed the ambiguous fast process to a slow charge redistribution producing an intramolecular charge-transfer (ICT) state preceding the proton-transfer step. In DMSO, the charge redistribution exhibited two-exponential kinetics (∼2 ps and ∼13 ps) whereas in non-polar benzene (in the presence of TEA) it was proposed to take place within the excitation pulse. The ICT state was not observed in polar solvents which do not facilitate ESPT such as acetonitrile. Contrary to these findings, Jung and co-workers observed a significant increase in the dipole moments of HPTS-derived photoacids and their methylated counter parts upon excitation in the absence of ESPT indicating a substantial charge transfer.19
The overall picture is not very clear and a detailed description of the ESPT process in organic solvents is missing. Based on the results presented in this paper, we believe that the ambiguous step can be attributed to the formation of hydrogen-bonded (or contact) ion pairs preceding the full dissociation of the ions.
The two-step Eigen–Weller model, widely applied to quantitatively model the ESPT process, consists of an initial short-range proton transfer to produce the contact ion pairs followed by a diffusion controlled process resulting in formation of the free ions.20,21 The proposed three-step model contains two intermediate species, namely the hydrogen-bonded and solvent separated ion pairs.17,22,23 A simplified description of the three-step ESPT model is presented in Scheme 1, where HBC is the hydrogen-bonded complex and HBIP, SSIP and FIP are the hydrogen-bonded, the solvent separated, and the free ion pairs, respectively. Different decay pathways are also indicated in Scheme 1 including a quenching process by protons (i.e. recombination of the geminate ion pair producing ground-state neutral complex). Excitation of the ground-state hydrogen-bonded complex between the photoacid and a proton acceptor results in fast proton transfer to produce HBIP where there is a direct hydrogen bond between the two ions. In the SSIP the ions are already separated by few solvent molecules but are still held together by the Coulombic interaction. The FIP corresponds to fully solvated and dissociated ions. All of these species have been reported in the literature17,22–25 but a detailed characterization is complicated by the similarity of the spectra of the anionic species. Global analysis of the spectroscopic data over a broad spectral range can, at least partially, overcome this problem.
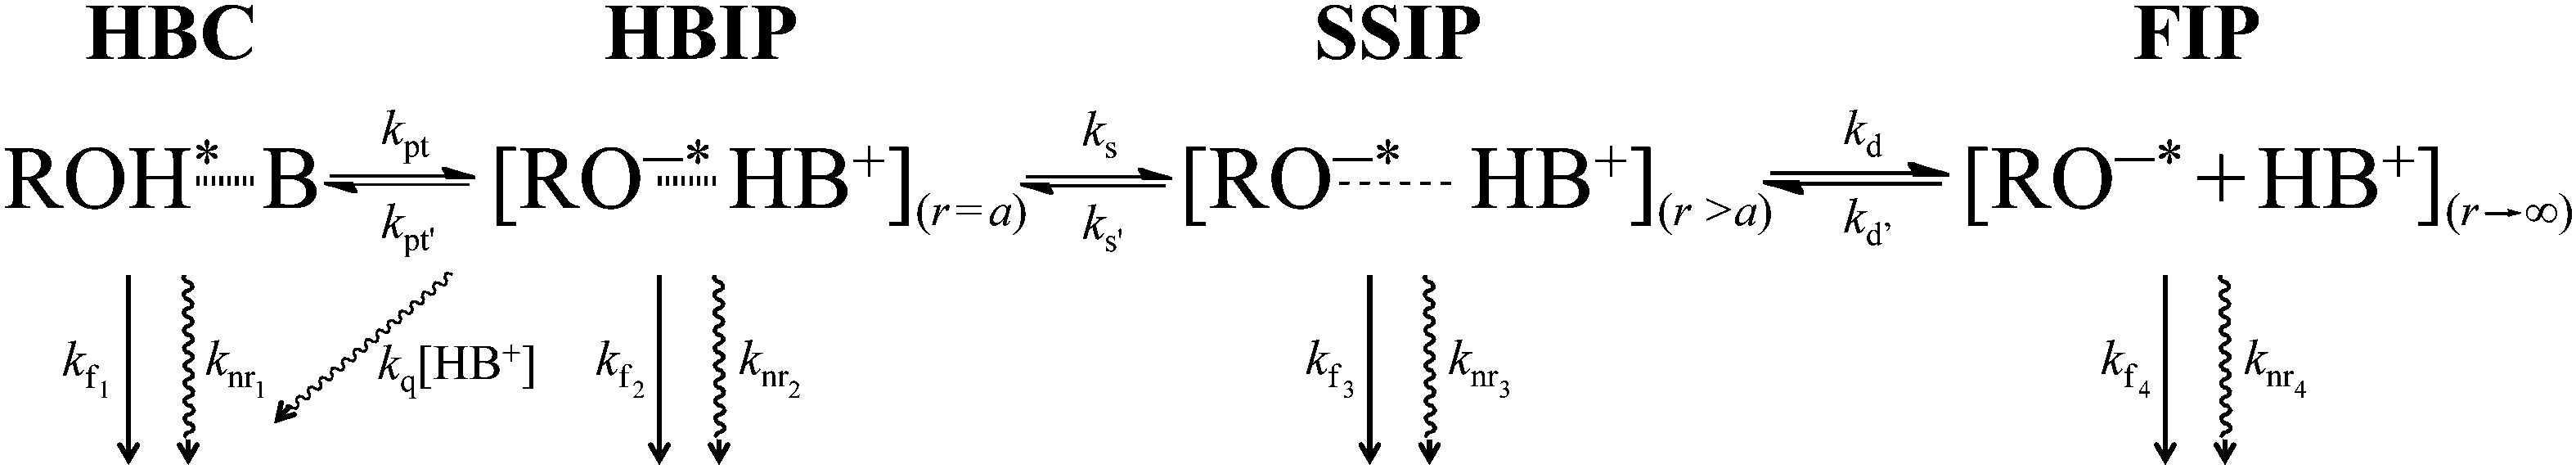 | ||
| Scheme 1 Photophysical scheme for the excited-state deprotonation and subsequent ion pair formation. HBC is the hydrogen-bonded complex and HBIP, SSIP and FIP are the hydrogen-bonded, solvent separated, and free ion pairs, respectively. kf and knr are the radiative and non-radiative rate constants, respectively, kq the proton quenching rate constant, r the distance between the ions, and a the contact distance. | ||
In a recent publication,26 we introduced a novel class of “super” photoacids27–34 based on hydroxy-substituted 1,8-naphthalimides and investigated the ESPT to solvent in aqueous solutions and in DMSO. The ESPT process in aqueous solutions was explained according to the two-step Eigen–Weller model whereas the kinetic behavior in DMSO appeared somewhat more complex. We have now modified the N-substituent to improve the solubility in organic solvents. Most aprotic organic solvents do not facilitate ESPT to the bulk solvent due to the inability of the solvent to accept and conduct protons. The ESPT can, however, be “turned on” by introducing proton acceptors such as organic bases. In this case, the proton transfer occurs in the preformed intermolecular hydrogen-bonded complexes resulting in formation of excited-state ion pairs (ESIP).22 The main goal of the present study is to investigate an intermolecular ESPT and ion pair formation in aprotic organic solvents in the presence of proton acceptors.
This paper consists of two parts. First, we will present a density functional theory (DFT) and time-dependent (TD)-DFT investigation on a simplified model photoacid, N-methyl-3,6-dihydroxy-1,8-naphthalimide (dHONI). We will investigate the effect of explicit proton acceptors, imidazole (IM) and 1,8-diazabicyclo[5.4.0]undec-7-ene (DBU), on the ground- and excited-state geometries as well as on the spectroscopic properties and identify the energetically favorable complexes. The second part includes steady-state and ps time-resolved fluorescence (TCSPC) studies on the photoacid N-butyl-3,6-dihydroxy-1,8-naphthalimide (C4-dHONI, pKa = 8.8 and pKa* ≈ −1)26 in the absence and presence of the bases. For this study, we chose polar solvents acetonitrile (MeCN, εr = 37.5) and benzonitrile (PhCN, εr = 26.0) which facilitate the excited-state dissociation of the produced ion pair in the absence of water. The bases used as proton acceptors in this case are N-methylimidazole (NMI) and DBU with pKa = 7.4 and ≈12 (conjugate acids), respectively. The compounds are shown in Chart 1.
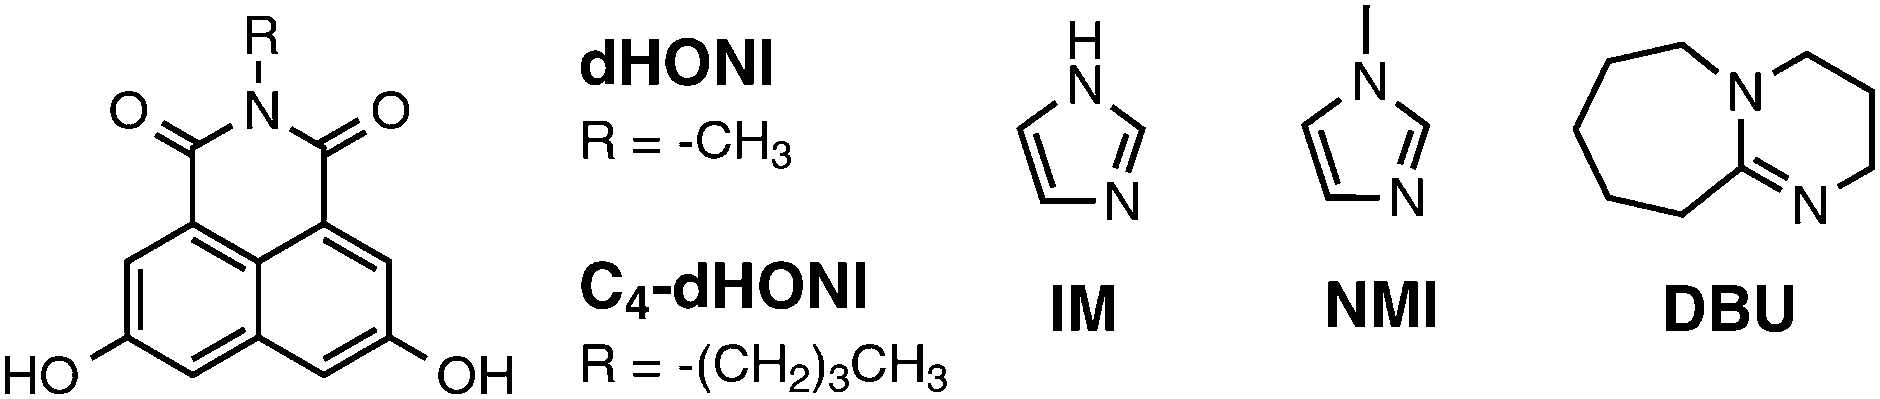 | ||
| Chart 1 Structures of the studied compounds. | ||
Experimental section
Materials
The C4-dHONI photoacid was synthesized starting from 1,8-naphthalic anhydride by sulfonation with fuming sulfuric acid to give sodium-1,8-naphthalic anhydride-3,6-disulfonate.35 The disulfonate was converted to 3,6-dihydroxy-1,8-naphthalic anhydride by reaction with molten KOH at 250 °C. Reaction of the anhydride with n-butylamine yielded the corresponding 1,8-naphthalimide C4-dHONI. The detailed synthetic procedure and characterization are given in the ESI.† All organic solvents were of spectroscopic grade (≥99.5–99.9%) and stored over 4 Å molecular sieves. MeCN was distilled from CaH2 prior to usage. The bases N-methylimidazole (≥99%) and 1,8-diazabicyclo[5.4.0]undec-7-ene (98%) were from Sigma-Aldrich and used as received.Spectroscopic measurements
Steady-state absorption and fluorescence spectra were recorded using a Shimadzu UV-2700 spectrophotometer and a SPEX Fluorolog3-22 fluorimeter, respectively. The fluorescence spectra were collected in a right-angle geometry and corrected for the spectral sensitivity of the instrument. All measurements were carried out at room temperature (21 ± 1 °C). The concentrations of the samples were 9–40 μM. Quantum yields were determined using quinine sulfate (>99%, Fluka) in 0.5 M H2SO4 (aq.) as a quantum yield standard with Φf = 0.55.36,37 The experimental setup for TCSPC is described in the ESI.†Theoretical calculations
All calculations were performed with the ADF2013.01 software38,39 using the B3LYP40–42 functional and the TZ2P43 basis set. We chose the B3LYP functional because it has been shown to produce reasonable results for 1,8-naphthalimide dyes.44,45 Secondly, B3LYP has been shown to give reliable values for proton affinities,46 complexation energies and geometries of bimolecular complexes.47,48 The conductor-like screening model (COSMO)49 was used to include solvent effects. The dielectric constant εr = 37.5 was used for MeCN.Results and discussion
DFT and TD-DFT calculations on the model compounds
First, we calculated the proton affinities of the bases and the conjugate base of the model photoacid dHONI in the gas phase and in MeCN (COSMO). The proton affinities were calculated as a negative enthalpy change (−ΔH298), i.e. the energy released, in the reaction between a proton and the bases. Briefly, the proton affinities follow a trend IM < HONI− < DBU in MeCN as predicted by their pKa values. In the gas phase HONI− has significantly higher proton affinity compared to the neutral bases most likely due to the electrostatic contribution of the negatively charged conjugate base. The calculated gas phase values of IM and DBU are in good agreement with the values presented in the literature justifying the choice of the functional and the basis set (B3LYP/TZ2P). Calculated proton affinities (Table S1, ESI†) and computational details are given in the ESI.†Optimized ground- and excited-state geometries of the 1![[thin space (1/6-em)]](https://www.rsc.org/images/entities/h3_char_2009.gif) :1 complexes
:1 complexes
The optimized electronic ground- and excited-state structures of dHONI⋯IM in MeCN are presented in Fig. 1. Those of dHONI⋯DBU are presented in Fig. S1 (ESI†). The optimized ground-state geometries agree with the expectations based on the proton affinities i.e.IM exhibits only hydrogen bonding to the –OH group whereas DBU readily deprotonates it. The dHONI⋯IM complex undergoes proton transfer to IM in the excited state demonstrated by the large changes in the bond lengths. The C–O bond of the deprotonated –OH does not have purely single or double bond character and the bond length (d = 1.29–1.30 Å) is in between those of the normal carbonyl (d = 1.22 Å) and the hydroxyl C–O (d = 1.35–1.36 Å). The dHONI⋯DBU complex exhibits only small changes upon excitation. The hydrogen bond length is slightly increased and the C–O and N–H bond lengths are slightly decreased.
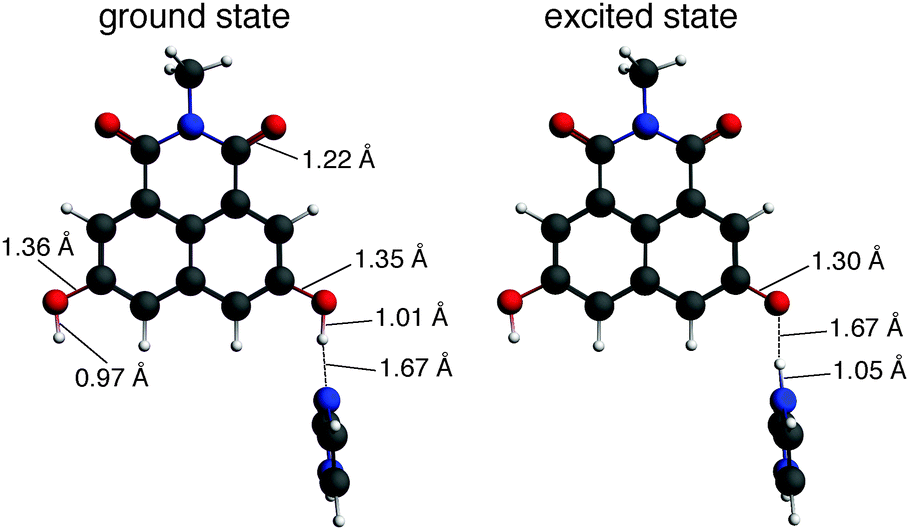 | ||
Fig. 1 Optimized ground- and excited-state geometries of dHONI⋯IM complex in MeCN with relevant interatomic distances. Representative C![[double bond, length as m-dash]](https://www.rsc.org/images/entities/char_e001.gif) O, C–O and O–H distances are shown only for the ground-state geometry (left) and are not altered upon excitation. O, C–O and O–H distances are shown only for the ground-state geometry (left) and are not altered upon excitation. | ||
Excitation of dHONI results in an intramolecular charge transfer from the hydroxyl oxygen to the aromatic system weakening the O–H bond.19,26 As a result, the optimization of the S1 state of the dHONI⋯IM complex directly leads to the deprotonated form indicating a nearly barrierless proton transfer i.e. we did not find an energy minimum for –OH⋯N in the S1 state. The barrier for the proton transfer in the excited state decreases upon increasing strength of the photoacid and eventually vanishes.50 The decreased electron density on the oxygen upon excitation also weakens the hydrogen bond to the protonated DBU as indicated by the increase in the hydrogen bond length from 1.69 Å to 1.85 Å. Similar observations have been reported in the literature.51
Calculated complexation energies
Complexation energies of ground-state complexes in MeCN were calculated as a relative electronic energy difference, ΔEelec = Eelec(products) − Eelec(reactants). The results are presented in Fig. 2.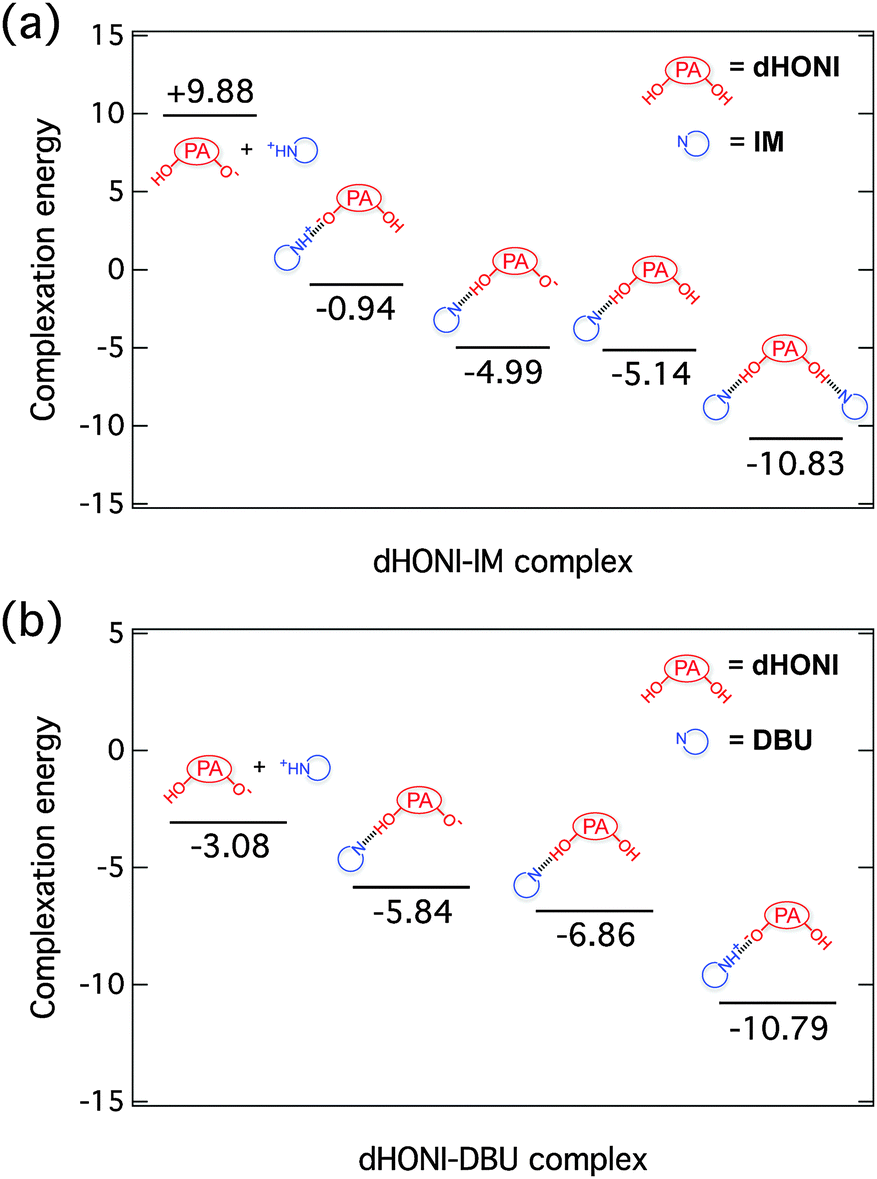 | ||
| Fig. 2 Calculated complexation energies (kcal mol−1) of different (a) dHONI⋯IM and (b) dHONI⋯DBU ground-state complexes in MeCN. | ||
The lowest energy conformation of the dHONI⋯IM complex is the hydrogen-bonded complex (HBC) in which the proton resides on dHONI. Deprotonation by IM is energetically disfavored by ∼4 kcal mol−1. Deprotonation of one hydroxyl group or hydrogen bonding of one IM does not significantly affect the complexation energy of the second IM molecule. Association in the 1:2 complex is non-cooperative and the association constants follow statistical binding i.e. K1 ≈ 4K2.52
The lowest energy conformation of dHONI⋯DBU complex is the HBC in which the proton resides on DBU. This conformation is energetically ∼4 kcal mol−1 more favorable than the HBC in which the proton resides on dHONI. Dissociation of the deprotonated complex is disfavored by ∼8 kcal mol−1 compared to the lowest energy conformation and does not occur at room temperature. Deprotonation of (or binding to)53 one hydroxyl group lowers the binding energy of the second DBU by ∼4 kcal mol−1. In this case we expect to observe negative cooperation as the first association lowers the affinity for the second association i.e. K1 > 4K2.
Effect of complexation on the spectral properties
The effect of complexation on the absorption and emission energies was investigated for neutral and anionic complexes. This allows to demonstrate the effect of 1:1 complexation (one free and one complexed –OH group) and 1:2 complexation (one deprotonated and one complexed –OH group) separately. Absorption and emission energies are given in Table 1. The experimental values are estimated from the peak maxima of the last titration points.
| Structure | λ abs (nm) | λ em (nm) | |
|---|---|---|---|
| S0 → S1 | S0 → S2 | S1 → S0 | |
| a Peak maxima in neat MeCN. b Peak maxima of the last titration points in Fig. 3(a) and 6(a). c Fitted peak maxima of HBIP (HONI−⋯IMH+) and FIP (HONI−) from the spectral deconvolution presented in Fig. 10(a). | |||
| dHONI | 395 (378)a | 380 | 433 (410)a |
| dHONI⋯IM | 406 (383)b | 385 | 546 |
| dHONI⋯DBU | 424 | 386 | 565 |
| HONI−⋯IMH+ | 482 | 387 | 545 (564)c |
| HONI−⋯DBUH+ | 511 (470)b | 385 (388)b | 564 |
| HONI− | 542 | 388 | 573 (686)c |
| IM⋯dHONI⋯IM | 409 | 399 | 541 |
| IM⋯HONI− | 443 | 401 | 569 |
| DBU⋯HONI− | 541 | 412 | 564 |
Initial complexation to the first –OH group lowers the S0 → S1 transition energy. The magnitude of the red shift is proportional to the extent of the proton translocation along the hydrogen bond (and thus the basicity of the proton acceptor), uncomplexed neutral and anionic forms of dHONI being the extremes. The S0 → S2 energies are only slightly decreased (∼6 nm) upon initial complexation and are almost independent of the proton acceptor. Complexation of a second base (1:2 complex) or complexation of a base to the –OH group of the anion mainly shifts the S0 → S2 transition. Again, the magnitudes of the red shifts are proportional to the basicity of the proton acceptors. The calculated emission energy of the free anion is overestimated by ∼0.36 eV compared to the fitted peak maxima of the FIP (see Fig. 10). This is attributed to an improper description of the excited-state with strong ICT character by the functional and basis set used (B3LYP/TZ2P).
The effect of complexation on the absorption energies can be rationalized from the frontier orbitals. The S0 → S1 transition mainly originates from the HOMO → LUMO transition and the S0 → S2 from the HOMO−1 → LUMO transition. In the symmetric neutral form the two transitions are very close in energy and the orbitals are symmetric.26 Upon complexation the molecule becomes asymmetric and the HOMO and the HOMO−1 orbitals are more localized on one or the other substituent. Therefore the change in the proton translocation affects mainly one of the transition energies.
Summary of the computational results
Experimentally relevant findings of the quantum chemical calculations in MeCN can be summarized in the following key points:(i) IM exhibits only hydrogen bonding in the ground state whereas DBU deprotonates dHONI. NMI is expected to behave similarly to IM.
(ii) Optimization of the S1 state of all complexes relaxes to deprotonated form where the proton resides on the base.
(iii) NMI is expected to exhibit non-cooperativity (K1 ≈ 4K2) and DBU negative cooperativivity (K1 > 4K2) in the formation of the 1:2 complexes.
(iv) The first binding event red shifts mainly the S0 → S1 transition and the second binding event the S0 → S2 transition.
Spectral and kinetic parameters in neat solvents
First, we characterized standard spectral and kinetic parameters in neat solvents. The parameters are summarized in Table 2. Example absorption and emission spectra are presented in Fig. 3 and 5, respectively.| Solvent | λ maxA (nm) |
![[small nu, Greek, tilde]](https://www.rsc.org/images/entities/i_char_e0e1.gif) maxA (cm−1)
maxA (cm−1) |
ε max (M−1 cm−1) | λ maxf (nm) |
maxf (cm−1) |
ΔStokes (cm−1) |
Φ f (%) | τ f (ns) | τ 0 (ns) | k f (s−1) | k f (s−1) | k nr (s−1) |
|---|---|---|---|---|---|---|---|---|---|---|---|---|
| a Calculated from lifetime and quantum yield. b Calculated with Strickler–Berg relation.54 | ||||||||||||
| MeCN | 378 | 26500 |
11100 ± 200 |
410 | 24300 |
2180 | 30.7 ± 0.6 | 5.3 ± 0.1 | 17.2 | 5.8 × 10⁷ | 6.0 × 10⁷ | 1.3 × 10⁸ |
| PhCN | 383 | 26100 |
11500 ± 300 |
412 | 24200 |
1960 | 35.9 ± 0.7 | 4.6 ± 0.1 | 12.9 | 7.7 × 10⁷ | 7.7 × 10⁷ | 1.4 × 10⁸ |
The steady-state spectral properties are almost identical in both solvents and similar to those of the previously characterized dihydroxy-compounds.26 The Stokes shift is slightly larger in the more polar MeCN. C4-dHONI has ∼5% higher quantum yield in PhCN attributed to the higher radiative rate constant due to the larger refractive index of the solvent. The determined radiative rate constants agree very well with the values estimated from absorption and emission spectra with the Strickler–Berg relation (see ESI†).54,55
Steady-state titration experiments
We performed steady-state titration experiments with NMI and DBU to study the complex formation and to estimate the association and/or quenching constants. Because of the two binding sites of the photoacid, the absorption spectra were analyzed using a 1:2 association model following the approach presented in ref. 56 (see ESI†). We used a global analysis over a wide spectral range as this highly improves the accuracy of the fittings and enables the construction of the absorption spectra of the individual species.52
The absorption spectra of C4-dHONI upon addition of NMI in MeCN and PhCN are presented in Fig. 3. The absorption spectra exhibit red shifts and broadening upon complexation with NMI in both solvents. The overall magnitudes of the red shift and the broadening are slightly larger in PhCN. The spectra do not exhibit perfect isosbestic points suggesting the presence of more than two species. The component spectra at the corresponding concentration (c = 30 μM) and the concentration profiles of each species as a function of NMI concentration in PhCN are presented in Fig. 4 and in MeCN in Fig. S2 (ESI†). The association constants in both solvents are given in Table 3.
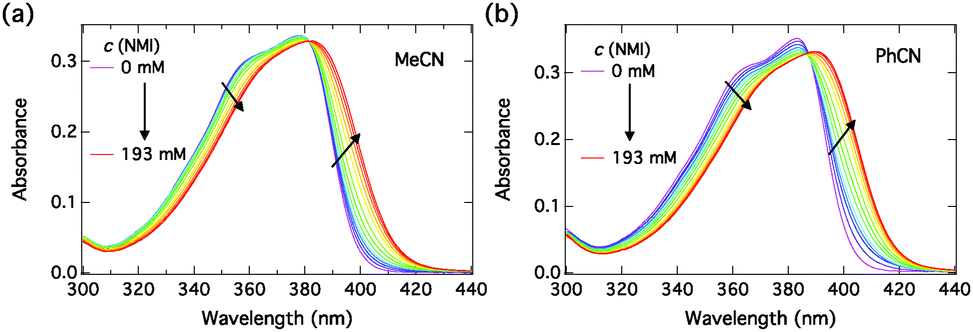 | ||
| Fig. 3 Steady-state absorption spectra of C4-dHONI (c = 30 μM) upon addition of NMI in (a) MeCN and (b) PhCN. | ||
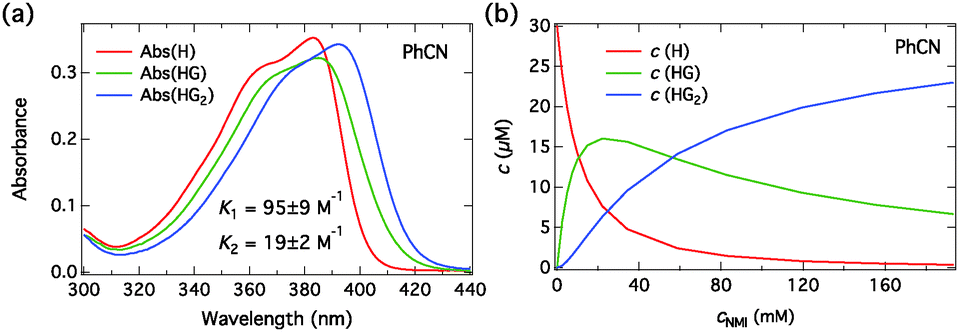 | ||
| Fig. 4 (a) Fitted absorption spectra of all the species (H, HG, HG2, H = C4-dHONI, G = base) at the total host concentration c = 30 μM and (b) the concentrations as a function of total NMI concentration in PhCN. | ||
| Solvent | Base | K 1 (M−1) | K 2 (M−1) | K (M−1) | k q (M−1 s−1) |
|---|---|---|---|---|---|
|
a Obtained from emission spectra.
b Dynamic Stern–Volmer quenching constant, KD.
c 1:1 association constant, K1.
d Concentration range too low (<1 mM) for dynamic quenching.
|
|||||
| MeCN | NMI | 58 ± 10 | 9 ± 2 | 23 ± 5b | 4.3 × 10⁹ |
| PhCN | NMI | 95 ± 9 | 19 ± 2 | 16 ± 10b | 3.5 × 10⁹ |
| MeCN | DBU | (19 ± 1) × 104 | 2300 ± 200 | (16 ± 4) × 104c |
—d |
| PhCN | DBU | (41 ± 2) × 103 | 670 ± 50 | (40 ± 8) × 103c |
—d |
The resulting component spectra are in good agreement with the DFT calculations. Initial binding of a single NMI molecule red shifts and slightly broadens the absorption due to red shifts of both the S0 → S2 and the S0 → S1 transitions. The second binding decreases the energy gap between the HOMO−1 and HOMO levels and results in a small narrowing and increased absorption at the maximum.
Next, we estimated the dynamic quenching constant, KD, from the steady-state emission spectra using Stern–Volmer analysis with combined dynamic and static quenching:57
| I0/I = (1 + KS[Q])(1 + KD[Q]), | (1) |
:2 model. The excitation wavelengths were chosen in the middle of crossing points of the absorption spectra and were 381.5 nm and 387 nm for MeCN and PhCN samples, respectively. The emission intensities were corrected for changes in the absorption factor (f = 1−10−A) to minimize errors due to changes in the amount of absorbed light and integrated over ∼30 nm around the emission maxima to minimize noise. The emission spectra in MeCN and PhCN are presented in Fig. 5. The insets show the integrated emission intensities and fittings with eqn (1). The dynamic Stern–Volmer quenching constants and quenching rate constants calculated from the lifetimes (KD = kqτ0) are given in Table 3.
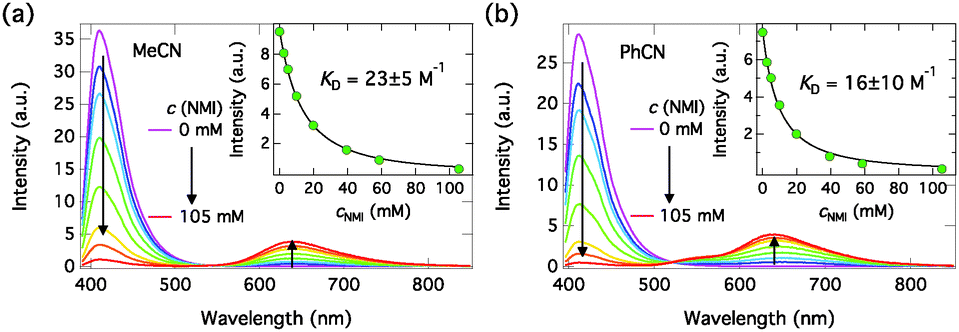 | ||
| Fig. 5 Steady-state emission spectra of C4-dHONI (c = 9 μM) upon addition of NMI in (a) MeCN (λexc = 381.5 nm) and (b) PhCN (λexc = 387 nm). The insets show the integrated emission intensities together with Stern–Volmer fittings for combined quenching, eqn (1). | ||
The emission spectra exhibit quenching of the neutral emission and appearance of a long-wavelength emission attributed to the anionic species. In PhCN, the anion emission band shows a distinct shoulder at ∼550 nm attributed to the intermediate ion pair species. The quenching of the neutral emission is well fitted with the Stern–Volmer equation for combined quenching in the low concentration range. The fit deviates from the data at higher concentrations due to the approximation of assuming 1:1 complexation as the only cause of the static quenching. In reality, the 1:2 complexation will influence the first equilibrium reducing the concentration of the free host. Therefore, the dynamic quenching constants are merely good estimates of the true values.
We performed similar titration experiments with DBU. The absorption spectra, presented in Fig. 6, exhibit drastic changes upon “complexation” with DBU. The spectra change in two clearly distinct concentration ranges: (i) at low concentrations of DBU (0–200 μM) the neutral absorption decreases without a significant red shift and a broad shoulder appears at longer wavelength; (ii) at high concentrations of DBU (0.2–17 mM) the neutral band broadens and red-shifts and the long-wavelength shoulder evolves into a distinct absorption band. The long-wavelength band is attributed to the S0 → S1 transition of the hydrogen-bonded complex in which the proton resides on DBU. Approximate isosbestic points are observed in both samples at λ ≈ 390 nm and λ ≈ 392 nm in MeCN and PhCN, respectively.
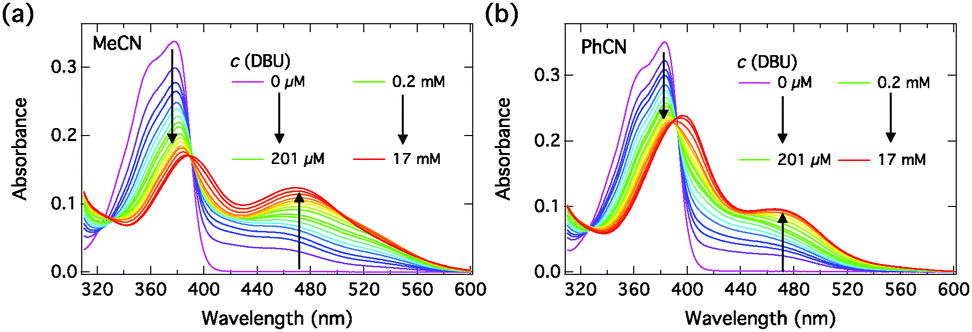 | ||
| Fig. 6 Steady-state absorption spectra of C4-dHONI (c = 30 μM) upon addition of DBU in (a) MeCN and (b) PhCN. The two distinct concentration ranges are indicated in the legend for clarity. | ||
The component spectra at the corresponding concentration (c = 30 μM) and the concentration profiles of each species as a function of DBU concentration in PhCN are presented in Fig. 7 and in MeCN in Fig. S3 (ESI†). The association constants in both solvents are given in Table 3. Again, the component spectra agree well with the DFT calculations. In this case, the two successive binding events are better distinguished due to large differences in the spectral properties and the association constants.
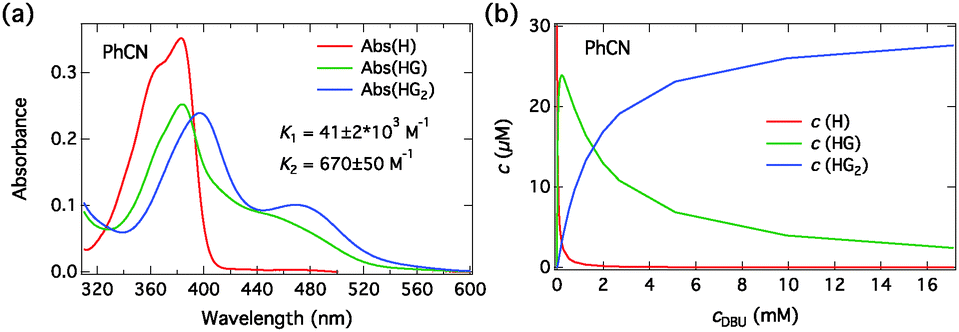 | ||
| Fig. 7 (a) Fitted absorption spectra of all the species (H, HG, HG2) at the total host concentration c = 30 μM and (b) the concentrations as a function of total DBU concentration in PhCN. | ||
Close inspection of the spectra in Fig. 6, however, shows that although the spectral evolutions upon addition of DBU in both solvents are similar, especially in MeCN some deviations from the 1:2 association model are apparent. The long-wavelength absorption seems to exhibit multiple bands. A possible explanation is that dissociation into SSIP or even FIP can occur to some extent in the ground state in the presence of a strong base (DBU) in the more polar MeCN. Therefore the fitted component spectra contain contributions from the different ground-state ion pair species. These two processes, 1:2 association and the ground-state dissociation occur simultaneously and cannot be clearly separated. Nevertheless, the 1:2 association model gives a satisfactory description of the data, and the component spectra are physically meaningful in view of the TD-DFT results.
Last, we measured the emission spectra upon addition of DBU. Excitation wavelengths were chosen at the approximate isosbestic points and were λ = 390.5 nm and λ = 392.5 nm in MeCN and PhCN, respectively, and the spectra were processed as in the case of NMI. We limited the concentration range up to ∼1 mM as this already resulted in nearly quantitative quenching of the neutral fluorescence. The emission spectra shown in Fig. S4 (ESI†) exhibit qualitatively similar behavior as upon addition of NMI. Due to the low concentration of DBU dynamic quenching is negligible and we analyzed the data with a 1:1 association model (see ESI†). This allowed us to estimate K1 from the emission data. The 1:1 association constants, shown in Table 3, agree well with the first association constant of the 1:2 model.
All the association and quenching constants are listed in Table 3. The models used describe the data very well and the component spectra agree well with the experimental data and the DFT calculations and are physically meaningful. NMI exhibits non-cooperative (statistical) binding i.e. K1 ≈ 4K2 in both solvents. DBU, on the other hand, exhibits strong negative cooperative binding i.e. K1 ≫ 4K2. The observed behavior is also predicted by the calculated complexation energies.
Time-resolved fluorescence of the complexes
The decays of the complexes were measured at relatively high NMI or DBU concentrations to maximize the amount of the ground-state complex. The decays were monitored between 410 and 650 nm in the presence of NMI (c = 200 mM) and fitted globally with a five-exponential model. The decays in the presence of DBU (c = 250 μM) were monitored between 560 and 650 nm and fitted globally with a three-exponential model. The decay associated spectra (DAS) were constructed as described in the ESI.† The excitation wavelength was λexc = 360 nm in the presence of NMI. λexc = 460 nm was used for the DBU samples, corresponding to the excitation of the anionic species. The DAS in the presence of NMI and DBU in MeCN and PhCN are presented in Fig. 8 and 9, respectively. The fitting results are given Table 4. Represenative decay traces are shown in Fig. S5–S8 (ESI†).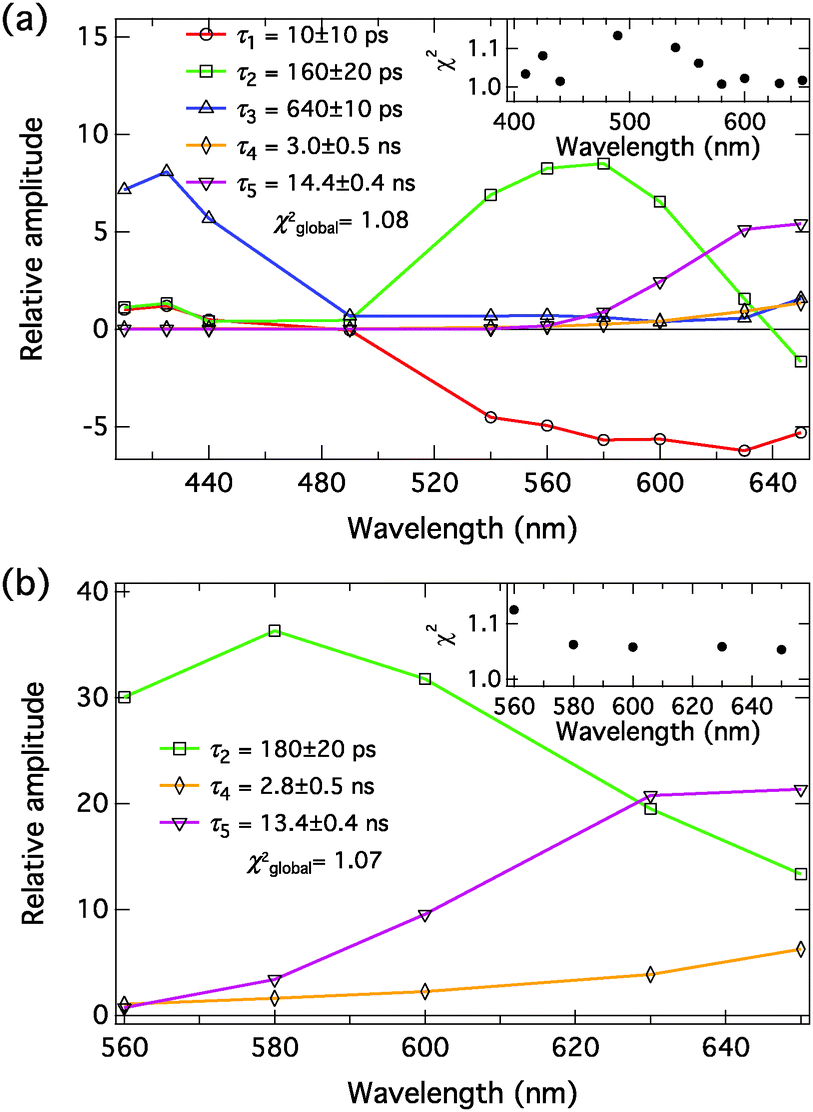 | ||
| Fig. 8 Decay associated spectra of C4-dHONI (c = 40 μM) in MeCN in the presence of (a) 200 mM of NMI (λexc = 360 nm) and (b) 250 μM of DBU (λexc = 460 nm). The insets show the individual χ2-values at each wavelength. The time constants in (b) are given the same labels as the corresponding ones in (a). | ||
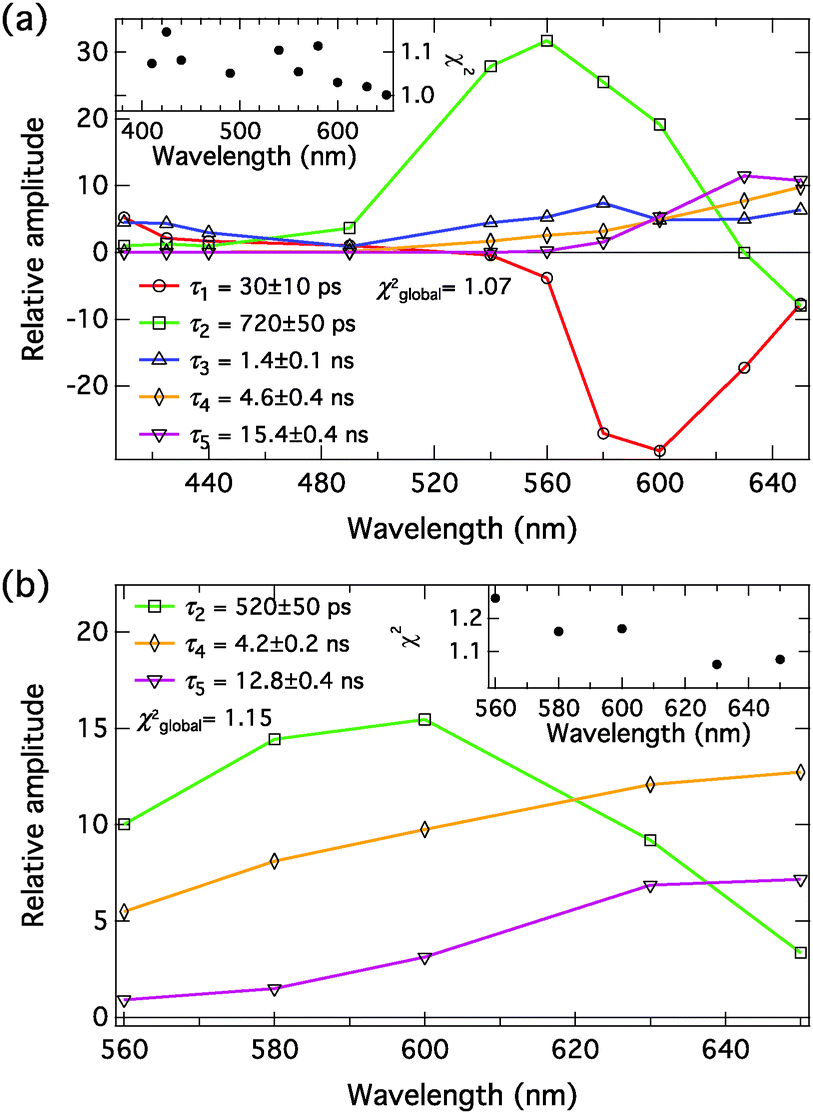 | ||
| Fig. 9 Decay associated spectra of C4-dHONI (c = 40 μM) in PhCN in the presence of (a) 200 mM of NMI (λexc = 360 nm) and (b) 250 μM of DBU (λexc = 460 nm). The insets show the individual χ2-values at each wavelength. The time constants in (b) are given the same labels as the corresponding ones in (a). | ||
| Solvent | Base | τ 1 (ps) | τ 2 (ps) | τ 3 (ns) | τ 4 (ns) | τ 5 (ns) | χ 2glob |
|---|---|---|---|---|---|---|---|
| a c NMI = 200 mM. b c DBU = 250 μM. | |||||||
| MeCN | — | — | — | 5.3 ± 0.1 | — | — | 1.14 |
| MeCN | NMI | 10 ± 10 | 160 ± 20 | 0.64 ± 0.01 | 3.0 ± 0.5 | 14.4 ± 0.4 | 1.08 |
| MeCN | DBU | — | 180 ± 20 | — | 2.8 ± 0.5 | 13.4 ± 0.4 | 1.07 |
| PhCN | — | — | — | 4.6 ± 0.1 | — | 1.17 | |
| PhCN | NMI | 30 ± 10 | 720 ± 50 | 1.4 ± 0.1 | 4.6 ± 0.4 | 15.4 ± 0.4 | 1.07 |
| PhCN | DBU | — | 520 ± 50 | — | 4.2 ± 0.2 | 12.8 ± 0.4 | 1.15 |
The compound exhibits versatile excited-state dynamics in the presence of proton acceptors in both solvents. The results, both in the presence of NMI and DBU, are consistent with the excited-state ion pair formation (i.e. three-step deprotonation model) presented in Scheme 1. In the presence of 200 mM NMI, the samples contain a mixture of free C4-dHONI (minute amount) and the hydrogen-bonded 1:1 and 1:2 complexes, the latter being dominant in both solvents. In our multi-exponential model, we do not discriminate between the 1:1 and 1:2 complexes and will simply call them hydrogen-bonded complex (HBC). The excitation of the HBC results in fast proton rearrangement to form the hydrogen-bonded ion pair (HBIP), in which the proton resides on NMI and is directly hydrogen bonded to the hydroxyl oxygen. This decay is seen as a positive amplitude in the neutral spectral range and a negative amplitude in the anion region in both solvents (red component in Fig. 8(a) and 9(a), τ1 = 10 ps in MeCN and 30 ps in PhCN). Most of the anionic species are produced in this step.
The HBIP decays further to solvent separated ion pairs (SSIP). This is seen as a positive amplitude both in the neutral and anion regions (green component in Fig. 8(a) and 9(a), τ2 = 160 ps in MeCN and 720 ps in PhCN). The positive amplitude in the neutral region is due to a small population of the HBC, formed by reverse proton transfer (kpt′ in Scheme 1). In the SSIP the produced ion pair is assumed to be separated by few solvent molecules but is still held together by Coulomb interaction. In addition, this component shows a small negative amplitude at the red edge of the spectral range supporting the sequential kinetic model. The decay of the HBIP is much faster in MeCN due to the higher polarity and lower viscosity of the solvent resulting in faster separation of the HBIP.
The SSIP (orange component in Fig. 8(a) and 9(a), τ4 = 3.0 ns in MeCN and 4.6 ns in PhCN) can undergo a diffusion-controlled separation to yield the free ion pairs (FIP) (purple component in Fig. 8(a) and 9(a), τ5 = 14.4 ns in MeCN and 15.4 ns in PhCN), which are the main emitting species in the anion region in both solvents. The diffusion-controlled separation is faster and the yield of the FIP is higher in MeCN. This is again attributed to the lower viscosity and higher polarity of MeCN.
The decays in both solvents exhibit a fifth component (blue component in Fig. 8(a) and 9(a), τ3 = 640 ps in MeCN and 1.4 ns in PhCN), which is attributed to a dynamically quenched emission of the free C4-dHONI by NMI. The quenching rate constants can be calculated from the quenched and unquenched lifetimes and the concentration of the quencher (NMI). The quenching rate constants are kq = 6.9 × 10⁹ M−1 s−1 and 2.5 × 10⁹ M−1 s−1 in MeCN and PhCN, respectively. The values agree reasonably well with those determined from the steady-state titration experiments (Table 3). This component also shows an unexpected positive amplitude in the anion region. It is well known that small imperfections of the data or the model can give rise to spurious mixing of the components in multi-exponential decays. In this case the decay times τ2, τ3 and τ4 are relatively close, especially in PhCN. In a separate fit of the long-wavelength region (600–650 nm) with a four-exponential model, the blue component τ3 is not needed to account for the time profiles (Fig. S9 and S10, ESI†). Therefore, the positive amplitude of τ3 in the anion region in the full five-component model is considered a minor artefact.
The assignment of the different fluorescent species is further supported by the measurements in the presence of DBU. In this case, the initially excited species is the ground-state HBIP (λexc = 460 nm). The DAS, presented in Fig. 8(b) and 9(b), show components attributed to the HBIP, SSIP and FIP (same color coding as with NMI). The decay times (see Table 4) and the spectral features of these components are similar to those measured in the presence of NMI upon excitation of the HBC. In this experiment the HBIP (green component in Fig. 8(b) and 9(b), τ2 = 180 ps in MeCN and 520 ps in PhCN) does not exhibit a negative amplitude at the red edge of the measured wavelength range. This is attributed to a larger spectral overlap between the HBIP and the separated anions. The proton translocation along the hydrogen bond is larger in the DBU complex which according to the calculations is expected to red shift the emission spectrum (Table 1). Secondly, as discussed before, partial dissociation (HBIP ⇌ SSIP) possibly occurs already in the ground-state complexes. In this case, the SSIP is formed directly upon excitation without any negative amplitude.
In order to connect the time-resolved and steady-state emission spectra, we decomposed the steady-state emission spectra of C4-dHONI in the presence of NMI (last titration points in Fig. 5) into different spectral components. Fittings with a sum of Gaussian functions in the wavenumber domain allows for separation of the overlapping emission bands.22,24 The decomposed spectra are presented in Fig. 10. In both solvents, three Gaussian functions were required to fit the long-wavelength emission band. The three bands are attributed to the three ion pair species. In MeCN, relatively good fit was already achieved with two Gaussian functions because of the small contribution of HBIP to the total emission. In both solvents, SSIP has the largest contribution to the total emission. In PhCN, the amplitude of HBIP is much higher than in MeCN which is due to the much slower decay (τ2) in PhCN. The relative contribution of FIP is much higher in MeCN in agreement with the TCSPC measurements. The fitting parameters are summarized in Table S2 (ESI†). The intensities of the bands cannot be directly compared to the relative amplitudes of the DAS in Fig. 8 and 9. This is because in the DAS positive and negative amplitudes cancel each other in the case of spectral overlap. The overlap is clearly evident in the decomposed spectra.
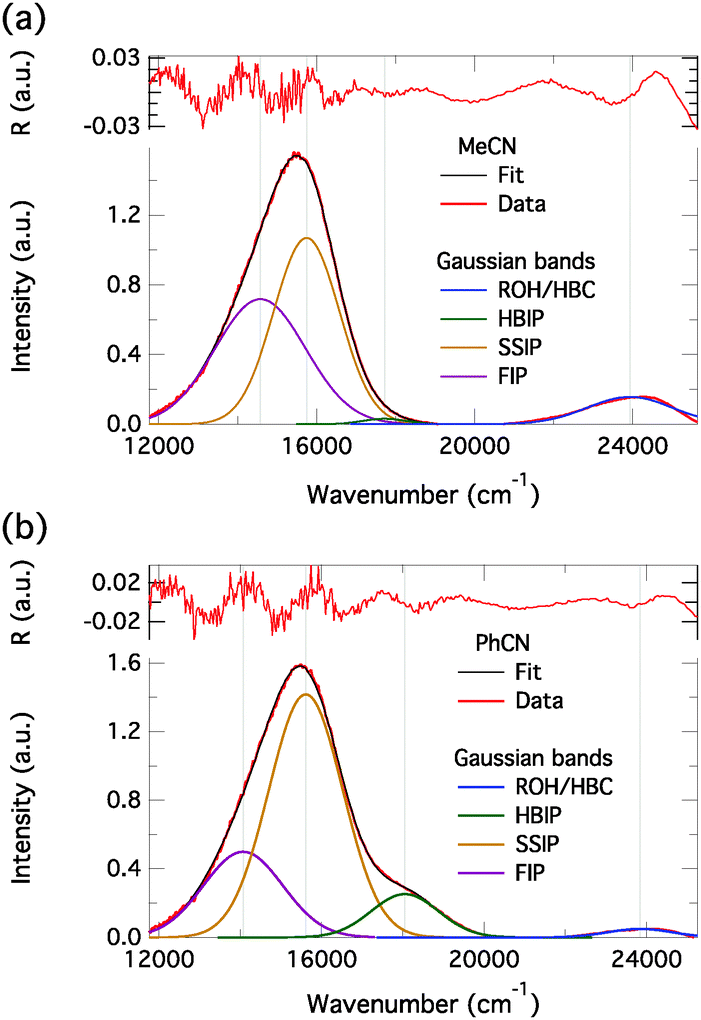 | ||
| Fig. 10 Decomposed emission spectra of C4-dHONI in the presence of NMI in (a) MeCN and (b) PhCN. The residuals are shown on top. The three long-wavelength emission bands are attributed to the three ion pair species as indicated in the legends. | ||
An alternative explanation for the emitting anionic species could be the presence of 1:1 and 1:2 complexes. This, however, can be excluded based on the relative concentrations of the complexes at the base concentrations used. The 1:2 complex is the main species in the presence of NMI whereas the 1:1 complex dominates in the presence of DBU. In MeCN the relative amplitudes of the components attributed to the SSIP and FIP are independent of the base used. In PhCN, the SSIP has slightly higher amplitude in the presence of DBU.
The observed decay times cannot be directly related to the rate constants presented in Scheme 1. The initial relaxation, τ1, is mainly determined by the forward and backward rates of the deprotonation step (kpt and kpt′ in Scheme 1, respectively).17 A more polar solvent enhances the deprotonation increasing the forward rate resulting in faster decay. The decay of the initially relaxed state, τ2, is mainly dictated by the forward rate constant of the solvent separation step (ks) and is faster in more polar and less viscous MeCN.
Intermolecular ESPT in organic solvents
Fluorescence spectroscopy appears to be very sensitive towards the proton translocation during the ESPT and subsequent dissociation. Based on the literature, transient absorption and IR spectroscopies cannot always distinguish all the intermediate species.9–15 Secondly, most of the studies are aimed at looking at the decay of the neutral form (usually two-exponential) and appearance of the anionic form whereas a detailed analysis of the decay of the anionic species is required for observation of all the species. The proton transfer is directly coupled to the extent of the intramolecular charge transfer and is therefore reflected in the emission spectrum. A larger extent of ICT results in stronger stabilization of the excited-state anion, decreasing the emission energy. Observation of the ICT as a separate process on a ps time scale seems however unlikely. Recent DFT and TD-DFT calculations have also shown that the ICT takes place instantaneously upon excitation but increases in magnitude upon proton translocation.50We believe that the described deprotonation model is not unique to the studied system and could be generalized to other excited-state proton-transfer reactions. The time constants of the different steps are strongly coupled with the solvent properties such as proton conductivity, polarity and viscosity. Most proton-transfer studies are done in water which has very high polarity and uniquely high proton conductivity due to the Grotthuss hopping mechanism.58 This complicates the detection of the intermediate species due to the extremely fast timescales of the initial processes. Secondly, some of the intermediate states are not necessarily populated above a spectroscopic detection limit. For example, the hydrogen-bonded ion pair can undergo a concerted proton rearrangement after which the proton is already separated by several water molecules without populating the solvent separated ion pair or the initial deprotonation takes place via the proton hopping mechanism to directly produce the solvent separated ion pair. Therefore studies in organic solvents are indispensable in studying the early events in the ESPT reactions. In this case the solvent does not conduct protons and the dissociation is dictated by a much slower diffusion process. The rates of the different processes can be further tuned by changing the solvent properties such as polarity and viscosity.22,24 Interestingly, excitation of the deprotonated DBU complex results in dissociation kinetics similar to those of the NMI complex. This clearly demonstrates that photoacids can be also used to study the dissociation process after the initial proton transfer.
Conclusions
We have studied the complex formation and intermolecular proton-transfer reactions between a dihydroxy naphthalimide photoacid and organic bases in organic solvents. Quantum chemical calculations and spectroscopic investigations enabled detailed characterization of the ground- and excited-state acid–base equilibria.Our results, both computational and experimental, show that weak bases will only hydrogen-bond to the hydroxyl groups whereas strong bases are able to deprotonate one of them but remain hydrogen bonded to the –O−. Association constants for 1:1 and 1:2 complexes with weak base (NMI) exhibit non-cooperative binding (K1 ≈ 4K2) whereas deprotonation of one hydroxyl group by a strong base (DBU) results in negative cooperative binding and lowers the association constant for the second binding event (K1 > 4K2).
The magnitude of the proton shift along the hydrogen-bond coordinate influences both the absorption and emission spectra. Full dissociation takes place in the excited state in polar solvents demonstrated by the increased red shift of the emitting anionic species. The decreased electron density on the deprotonated hydroxyl group in the excited state lowers the Coulombic barrier for the dissociation and enables the escape of the protonated base. In less polar PhCN, the emission spectrum of the anionic species exhibits a distinct high-energy shoulder which is attributed to the intermediate species in the deprotonation process. Time-resolved fluorescence studies confirm the three-step deprotonation model already proposed for other photoacids both in water and in organic solvents.16–18,22,23 In the first step, fast short-range proton rearrangement takes place producing the hydrogen-bonded ion pair, where the proton resides on the basic nitrogen of the proton acceptor. The ion pair is further solvated by few solvent molecules in the second step resulting in the solvent separated ion pair. The last diffusion-controlled step involves overcoming of the Coulombic barrier and full dissociation into the free ion pair. The dynamics of the dissociation process are the same regardless of the structure of the ground-state complex i.e. whether the proton resides on the photoacid or the base before the excitation. We believe that the described three-step deprotonation model is not unique to the studied system and could be generalized for other proton-transfer reactions.
Acknowledgements
This research was financially supported by the Netherlands Organisation for Scientific Research (NWO).References
- J. F. Ireland and P. A. H. Wyatt, Adv. Phys. Org. Chem., 1976, 12, 131–221 CrossRef CAS.
- L. G. Arnaut and S. J. Formosinho, J. Photochem. Photobiol., A, 1993, 75, 1–20 CrossRef CAS.
- A. Douhal, F. Lahmani and A. H. Zewail, Chem. Phys., 1996, 207, 477–498 CrossRef CAS.
- L. M. Tolbert and K. M. Solntsev, Acc. Chem. Res., 2002, 35, 19–27 CrossRef CAS PubMed.
- T. Förster, Z. Elektrochem., 1950, 54, 531–535 Search PubMed.
- A. Weller, Z. Phys. Chem., 1958, 17, 224–245 CrossRef CAS.
- E. Pines and D. Huppert, Chem. Phys. Lett., 1986, 126, 88–91 CrossRef CAS.
- E. Pines, D. Huppert and N. Agmon, J. Chem. Phys., 1988, 88, 5620–5630 CrossRef CAS PubMed.
- T.-H. Tran-Thi, T. Gustavsson, C. Prayer, S. Pommeret and J. T. Hynes, Chem. Phys. Lett., 2000, 329, 421–430 CrossRef CAS.
- T.-H. Tran-Thi, C. Prayer, P. Millié, P. Uznanski and J. T. Hynes, J. Phys. Chem. A, 2002, 106, 2244–2255 CrossRef CAS.
- M. Rini, B.-Z. Magnes, E. Pines and E. T. J. Nibbering, Science, 2003, 301, 349–352 CrossRef CAS PubMed.
- D. B. Spry and M. D. Fayer, J. Chem. Phys., 2007, 127, 204501 CrossRef CAS PubMed.
- D. B. Spry and M. D. Fayer, J. Chem. Phys., 2008, 128, 084508 CrossRef CAS PubMed.
- O. F. Mohammed, J. Dreyer, B.-Z. Magnes, E. Pines and E. T. J. Nibbering, ChemPhysChem, 2005, 6, 625–636 CrossRef CAS PubMed.
- O. F. Mohammed, D. Pines, J. Dreyer, E. Pines and E. T. J. Nibbering, Science, 2005, 310, 83–86 CrossRef CAS PubMed.
- D. B. Spry, A. Goun and M. D. Fayer, J. Phys. Chem. A, 2007, 111, 230–237 CrossRef CAS PubMed.
- P. Leiderman, L. Genosar and D. Huppert, J. Phys. Chem. A, 2005, 109, 5965–5977 CrossRef CAS PubMed.
- R. Gepshtein, P. Leiderman, L. Genosar and D. Huppert, J. Phys. Chem. A, 2005, 109, 9674–9684 CrossRef CAS PubMed.
- C. Spies, B. Finkler, N. Acar and G. Jung, Phys. Chem. Chem. Phys., 2013, 15, 19893–19905 RSC.
- A. Weller, Prog. React. Kinet., 1961, 1, 187–214 CAS.
- M. Eigen, W. Kruse, G. Maass and L. De Maeyer, Prog. React. Kinet., 1964, 2, 285–318 CAS.
- L. Biczók, P. Valat and V. Wintgens, Photochem. Photobiol. Sci., 2003, 2, 230–235 Search PubMed.
- T. Kumpulainen and A. M. Brouwer, Phys. Chem. Chem. Phys., 2012, 14, 13019–13026 RSC.
- L. Biczók, P. Valat and V. Wintgens, Phys. Chem. Chem. Phys., 2001, 3, 1459–1464 RSC.
- M. S. Mehata, H. C. Joshi and H. B. Tripathi, Chem. Phys. Lett., 2002, 366, 628–635 CrossRef CAS.
- T. Kumpulainen, B. H. Bakker, M. Hilbers and A. M. Brouwer, J. Phys. Chem. B, 2015, 119, 2515–2524 CrossRef CAS PubMed.
- L. M. Tolbert and J. E. Haubrich, J. Am. Chem. Soc., 1994, 116, 10593–10600 CrossRef CAS.
- C. Clower, K. M. Solntsev, J. Kowalik, L. M. Tolbert and D. Huppert, J. Phys. Chem. A, 2002, 106, 3114–3122 CrossRef CAS.
- E.-A. Gould, A. V. Popov, L. M. Tolbert, I. Presiado, Y. Erez, D. Huppert and K. M. Solntsev, Phys. Chem. Chem. Phys., 2012, 14, 8964–8973 RSC.
- I. Presiado, N. Karton-Lifshin, Y. Erez, R. Gepshtein, D. Shabat and D. Huppert, J. Phys. Chem. A, 2012, 116, 7353–7363 CrossRef CAS PubMed.
- R. Simkovitch, N. Karton-Lifshin, S. Shomer, D. Shabat and D. Huppert, J. Phys. Chem. A, 2013, 117, 3405–3413 CrossRef CAS PubMed.
- R. Simkovitch, K. Akulov, S. Shomer, M. E. Roth, D. Shabat, T. Schwartz and D. Huppert, J. Phys. Chem. A, 2014, 118, 4425–4443 CrossRef CAS PubMed.
- R. Simkovitch, S. Shomer, R. Gepshtein, D. Shabat and D. Huppert, J. Phys. Chem. A, 2014, 118, 1832–1840 CrossRef CAS PubMed.
- B. Finkler, C. Spies, M. Vester, F. Walte, K. Omlor, I. Riemann, M. Zimmer, F. Stracke, M. Gerhards and G. Jung, Photochem. Photobiol. Sci., 2014, 13, 548–562 CAS.
- K. Dziewoński, T. Majewicz and L. Schimmer, Bull. Int. Acad. Pol. Sci. Lett., Cl. Sci. Math. Nat., Ser. A, 1936, 33–55 Search PubMed.
- W. H. Melhuish, J. Phys. Chem., 1961, 65, 229–235 CrossRef CAS.
- A. M. Brouwer, Pure Appl. Chem., 2011, 83, 2213–2228 CrossRef CAS.
- ADF2013.01; SCM, Theoretical Chemistry, Vrije Universiteit, Amsterdam, The Netherlands, 2013, http://www.scm.com Search PubMed.
- G. te Velde, F. M. Bickelhaupt, S. J. A. van Gisbergen, C. Fonseca Guerra, E. J. Baerends, J. G. Snijders and T. Ziegler, J. Comput. Chem., 2001, 22, 931–967 CrossRef CAS PubMed.
- A. D. Becke, J. Chem. Phys., 1993, 98, 5648–5652 CrossRef CAS PubMed.
- C. Lee, W. Yang and R. G. Parr, Phys. Rev. B: Condens. Matter Mater. Phys., 1988, 37, 785–789 CrossRef CAS.
- P. J. Stephens, F. J. Devlin, C. F. Chabalowski and M. J. Frisch, J. Phys. Chem., 1994, 98, 11623–11627 CrossRef CAS.
- E. van Lenthe and E. J. Baerends, J. Comput. Chem., 2003, 24, 1142–1156 CrossRef CAS PubMed.
- L. Miao, Y. Yao, F. Yang, Z. Wang, W. Li and J. Hu, J. Mol. Struct.: THEOCHEM, 2008, 865, 79–87 CrossRef CAS PubMed.
- P. Kucheryavy, G. Li, S. Vyas, C. Hadad and K. D. Glusac, J. Phys. Chem. A, 2009, 113, 6453–6461 CrossRef CAS PubMed.
- H. J. Singh and U. Mukherjee, J. Mol. Model., 2011, 17, 2687–2692 CrossRef CAS PubMed.
- M. Heshmat, A. Kazaryan and E. J. Baerends, Phys. Chem. Chem. Phys., 2014, 16, 7315–7323 RSC.
- J. Cao, T. Wu, W. Sun and C. Hu, J. Phys. Org. Chem., 2013, 26, 289–294 CrossRef CAS PubMed.
- C. C. Pye and T. Ziegler, Theor. Chem. Acc., 1999, 101, 396–408 CrossRef CAS.
- A. P. Gamiz-Hernandez, A. Magomedov, G. Hummer and V. R. I. Kaila, J. Phys. Chem. B, 2015, 119, 2611–2619 CrossRef CAS PubMed.
- Y.-H. Liu, M. S. Mehata and S.-C. Lan, Spectrochim. Acta, Part A, 2014, 128, 280–284 CrossRef CAS PubMed.
- P. Thordarson, Chem. Soc. Rev., 2011, 40, 1305–1323 RSC.
- We did not calculate the 1:2 complex with DBU because this would increase the number of atoms to 81 being computationally very expensive with the current functional and basis set.
- S. J. Strickler and R. A. Berg, J. Chem. Phys., 1962, 37, 814–822 CrossRef CAS PubMed.
- D. Toptygin, J. Fluoresc., 2003, 13, 201–219 CrossRef CAS.
- A. E. Hargrove, Z. Zhong, J. L. Sessler and E. V. Anslyn, New J. Chem., 2010, 34, 348–354 RSC.
- Principles of Fluorescence Spectroscopy, ed. J. R. Lakowicz, Sringer, New York, USA, 3rd edn, 2006 Search PubMed.
- N. Agmon, Chem. Phys. Lett., 1995, 244, 456–462 CrossRef CAS.
Footnotes |
| † Electronic supplementary information (ESI) available: Synthetic procedures, experimental information, calculated proton affinities, ground- and excited-state geometries of dHONI⋯DBU complex, and additional spectra of C4-dHONI. See DOI: 10.1039/c5cp02556g |
| ‡ Present address: Physical Chemistry Department, Sciences II, University of Geneva, 30, Quai Ernest Ansermet, 1211 Geneva, Switzerland. |
| This journal is © the Owner Societies 2015 |