 Open Access Article
Creative Commons Attribution 3.0 Unported Licence
Effects of constituent ions of a phosphonium-based ionic liquid on molecular organization of H2O as probed by 1-propanol: tetrabutylphosphonium and trifluoroacetate ions†
Takeshi
Morita
*a,
Kumiko
Miki
b,
Ayako
Nitta
a,
Hiroyo
Ohgi
a and
Peter
Westh
c
aGraduate School of Advanced Integration Science, Chiba University, Chiba 263-8522, Japan. E-mail: moritat@faculty.chiba-u.jp
bDepartment of Liberal Arts and Basic Sciences, College of Industrial Technology, Nihon University, Narashino, Chiba 275-8575, Japan
cNSM Research for Functional Biomaterials, Roskilde University, Roskilde DK-4000, Denmark
First published on 22nd July 2015
Abstract
Aqueous solutions of tetrabutylphosphonium trifluoroacetate, [P4444]CF3COO, exhibit a liquid–liquid phase transition with a lower critical solution temperature. Herein, we characterized the constituent ions, [P4444]+ and CF3COO−, in terms of their effects on the molecular organization of H2O on the basis of 1-propanol probing methodology devised by Koga et al. The resulting characterization of the hydrophobicity/hydrophilicity is displayed on a two-dimensional map together with previous results, for a total of four cations and nine anions of typical ionic liquid (IL) constituents. The results indicate that [P4444]+ is the most significant amphiphile with strong hydrophobic and equally strong hydrophilic contributions among the group of constituent cations of ILs studied so far. The hydration number for [P4444]+ was evaluated to be nH = 72, which is three times larger than that of a typical imidazolium-based cation, [C4mim]+. Self-aggregation of [P4444]+ was found to occur in an aqueous solution of [P4444]CF3COO above 0.0080 mole fraction of the IL.
Introduction
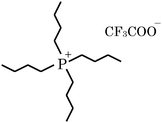
Ionic liquids (ILs) have gained considerable attention as they have radically changed the concept of the nature of liquids.1–5 ILs consisting entirely of ions have been increasingly proposed as alternatives to conventional organic solvents. Recent studies have focused on mixed systems composed of ILs and other molecular liquids, rather than neat ILs, for use as functional materials.6–12 In particular, thermoresponsive phase behaviour of aqueous solutions of ILs has been extensively investigated in relation to phase transitions with lower critical solution temperatures (LCSTs)6,12,13 as well as upper critical solution temperatures (UCSTs).13a,c,d,m,14A UCST behaviour is understandable; a strong attraction in terms of enthalpy between species would cause phase separation at low temperatures, while at higher temperatures the total entropic effect drives the system to a random mixture. This transition is caused because the mixing entropic contribution in the mixing Gibbs energy generally becomes more dominant as the temperature (T) increases. Since the enthalpy–entropy compensation is operative particularly in aqueous solutions, the temperature could tip the balance of ΔmixH and TΔmixS terms, where ΔmixH and ΔmixS are the change of the mixing enthalpy and entropy, respectively. However, an LCST behaviour is not as simple to explain. The present aqueous solution of [P4444]CF3COO exhibits LCST-type phase behaviour with the critical point at 29.2 °C and 0.025 mole fraction of the IL.7 The chemical structure of [P4444]CF3COO is shown in Fig. 1.
It has been suggested that LCST behaviour depends on the balance of hydrophilicity and hydrophobicity of the IL constituent ions. Kohno et al.15 reported that LCST-type phase behaviours of aqueous solutions of ILs strongly depend on the “hydrophilicity” of each constituent cation and anion. Their analysis was based on a one-dimensional scale with hydrophilicity and hydrophobicity at the extreme ends. The miscibility of imidazolium-based ILs with water was evaluated from estimated partition coefficients in octanol–water systems.16,17 The origin of LCST- and UCST-type phase transitions of mixtures of thiophene with two ILs, [C4C1mim]SCN and [C4C1mim][NTf2], was investigated using NMR spectroscopy and molecular dynamics simulations by Batista et al.18
Koga et al.19–21 devised a method by which an individual ion can be characterized in terms of a two-dimensional (2D) hydrophilicity and hydrophobicity scale. This technique is known as the 1-propanol (1P)-probing methodology. By this method, “amphiphiles” with hydrophobic and hydrophilic contributions can be quantitatively assessed. Here, we applied this method to characterize the constituent ions of [P4444]CF3COO to seek a deeper insight.
A differential thermodynamic approach to characterize the effects of a solute on the molecular organization of H2O was devised by Koga et al.19 They realized that aqueous solutions consist of three composition regions in each of which the mixing scenario on the molecular level is qualitatively different. The mixing scenario is identified by the term “mixing scheme” instead of solution structure, since the word “structure” implies a stable, ordered molecular arrangement. The mixing schemes are labelled as I, II or III from the H2O-rich regions. In Mixing Scheme I, the hydrogen bonds of H2O are bond-percolated throughout the entire bulk of H2O. The transition to Mixing Scheme II from I is regarded as a loss of bond percolation when the hydrogen bond probability is reduced to the percolation threshold. The 1P-probing methodology is applicable only in the region of Mixing Scheme I.
Although the 1P-probing methodology was described in detail elsewhere,19,20 a brief description is given here. This methodology is based on the finding that, within Mixing Scheme I, the effects of separate solutes on H2O are additive.19 Thus, we study a ternary system, 1P–S–H2O, where S is the test sample whose effect on H2O is being examined. In the ternary system of 1P–S–H2O, the thermodynamic signature of 1P, HE1P1P (defined below), is evaluated. Modification to its x1P-dependence pattern due to the presence of S is used to characterize the effect of S on H2O. HE1P1P is the enthalpic 1P–1P interaction in a complex ternary system and is defined as,
| HE1P1P ≡ N(∂HE1P/∂n1P) = (1 − x1P)(∂HE1P/∂x1P), | (1) |
| HE1P ≡ (∂HE/∂n1P), | (2) |
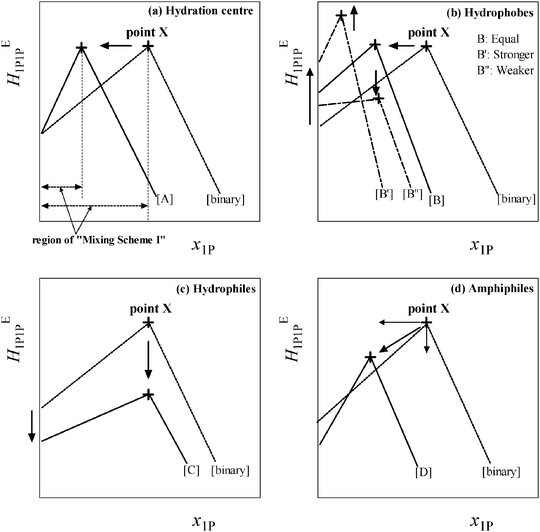
Fig. 2 shows a schematic representation of the changes in the HE1P1P pattern induced by the presence of various classes of solute, S. As shown in Fig. 2(a)–(d), the peak top is named point X, which marks the end of Mixing Scheme I. Upon addition of S, point X shifts depending on the nature of S. The shifts are in general linear to the initial mole fraction of S, x0S, within Mixing Scheme I. The slope of the westward shift (i.e. to the negative direction of x1P) of point X per unit increase in x0S is taken as the hydrophobicity index, while that towards the south (i.e. to the negative direction of the HE1P1P axis) is the hydrophilicity index.
Fig. 2(a) shows a typical change in HE1P1P for hydration centres such as in Na+ and Cl− ion pairs.22,23 Upon addition of the salt, the HE1P1P pattern is compressed to the west. This compression indicates that, upon addition of the Na+ and Cl− ion pair, the available H2O molecules for 1P to interact with are reduced. We thus interpret this westward shift to be due to hydration of the ions. From the westward shift of point X as a function of x0S, the hydration number, nH, can be evaluated for Na+ and Cl−. It must be stressed that at the starting point, x1P = 0, the value of HE1P1P remains the same even in the presence of Na+ and Cl−. This invariance and the fact that the value of HE1P1P at point X also remains the same led to the following suggestions: (1) Na+ and Cl− ions are hydrated by a number of H2O molecules, (2) the hydrating H2O molecules are unavailable to interact with 1P and (3) the bulk H2O molecules away from the hydration shells are unperturbed by Na+ and Cl− even in the presence of the ions. This finding can be utilized to characterize individual ions. For a given test ion, we chose the counter ion Na+ or Cl− and applied the 1P probing on the combined salt. Namely, we used tetrabutylphosphonium chloride, [P4444]Cl, and sodium trifluoroacetate, NaCF3COO, to characterize [P4444]+ and CF3COO−, respectively.
Fig. 2(b) shows the behaviour of the hydrophobic solute. For a solute almost equally hydrophobic as 1P such as 2-propanol24 the HE1P1P pattern shifts parallel to the west, as shown in the figure. This parallel shift is expected when compared to the case in which 1P was added as S to x0S (i.e. S = 1P). For a hydrophobe that is stronger (or weaker) than the probing 1P, such as tert-butanol25 (or ethanol26), the westward shift is greater (or lesser), reflecting a larger (or smaller) nH. This westward shift of point X indicates that a hydrophobe is hydrated by H2O molecules, making them unavailable to interact with 1P, as was the case for the hydration centre. In addition, the value of HE1P1P at point X shifts northward (or southward), reflecting the fact that the ability of tert-butanol (or ethanol) to reduce the hydrogen bond probability of bulk H2O away from the hydration shell is greater (or lesser) than 1P, as studied earlier.19 Furthermore, the hydrogen bonding within the hydration shells is more organized than it is in bulk H2O.
Fig. 2(c) shows the pattern change for the hydrophilic solute. This finding, as well as others,19 led to the interpretation that hydrophiles form hydrogen bonds directly to the existing hydrogen bond network of H2O and maintain the hydrogen bond connectivity of the network; thus, they act as impurities in the network. As such, they break the H donor/acceptor symmetry. Hence, the southward shift apparent in the figure is interpreted as a reduction of the net entropy-volume cross fluctuation.
Fig. 2(d) is for the amphiphilic solute. The effects seem to be a combination of those observed for hydrophobic and hydrophilic moieties. Their westward and southward components show contributions from hydrophobic and hydrophilic moieties, respectively. Typical IL constituent ions generally show amphiphilic responses to 1P-probing studies with strong hydrophobic and equally strong hydrophilic characteristics.27–30 These results fit into the special properties of ILs. Low melting points for ionic compounds can be related to the strength of hydrophobicity and/or hydrophilicity.20,30
With this pair of coordinates, the characterization of each species, including individual constituent ions, is displayed on a 2D map of hydrophobicity/hydrophilicity.
Experimental
Titration calorimetry for 1P probing
Tetrabutylphosphonium chloride, [P4444]Cl, (Aldrich, >98%) was used as the sample for characterization of the cation, [P4444]+. Sodium trifluoroacetate, NaCF3COO, (Sigma-Aldrich, >96%) was used as the sample for that of CF3COO−. Deionized H2O was prepared using a Milli-Q system (Millipore), with a resulting resistivity of 18.2 MΩ cm. Stock solutions were prepared using the purified H2O and the salts from freshly opened bottles. 1-Propanol (1P) (Sigma-Aldrich, Chromasolv for HPLC 99.9+%) was used as supplied. Due care was exercised not to contaminate the 1P with moisture from the atmosphere. The excess partial molar enthalpy, HE1P, was determined using a TAM III semi-isothermal titration calorimeter (TA Instruments, New Castle, USA) at 25.0 °C ± 0.0001 °C and in the dynamic correction mode.31–33 A 1 mL stainless steel container was used as the cell. The initial volume of the sample solution was set at 750 μL and the exact amount was determined gravimetrically. The volume and duration of each titration of 1P were set at 10 μL and 10 s, respectively. The injection volume per titration was calibrated to 9.9483 μL and was used to calculate the concentration. The ratio of titrant over titrand was on the order of 10−2 and was well within the acceptable range for approximation of the differentiation. The interval of injection was set at 30 min. The averaged uncertainty of the titration measurements was estimated to be ±0.03 kJ mol−1.Electric conductivity
The IL, [P4444]CF3COO, was synthesized and used for conductivity measurements. It was prepared by direct neutralization of aqueous tetrabutylphosphonium hydroxide solutions with trifluoroacetic acid. After evaporation, the product was added to a dichloromethane/water biphasic system and the resulting mixture was washed several times with distilled water. The required [P4444]CF3COO was dissolved in dichloromethane phase, and was dried in vacuum for 24 h at 60 °C prior to use. The structure and purity were confirmed by 1H NMR spectroscopy. The procedure of the synthesis has been described elsewhere in detail.7The electric conductivity of the aqueous solution was measured using an electrical conduction metre with automatic temperature compensation (Hanna instruments, DiST4). The measured concentration range was from 0.001127 to 0.04610 mole fraction of the IL.
Results and discussion
The data of HE1P are deposited as Table S1 of the ESI,† and are plotted in Fig. 3. A sigmoidal increase in HE1P with an inflection point is evident as long as x0S is appropriate for performing the 1P-probing methodology. As shown in Fig. 3, the x1P-dependence pattern of HE1P changes more rapidly for S = [P4444]Cl with increasing x0S than it does for S = NaCF3COO. The inflection point seems to disappear at x0S = 0.011 for S = [P4444]Cl and at x0S = 0.055 for S = NaCF3COO. To see this behaviour more clearly, we took the derivative of HE1P with respect to x1P.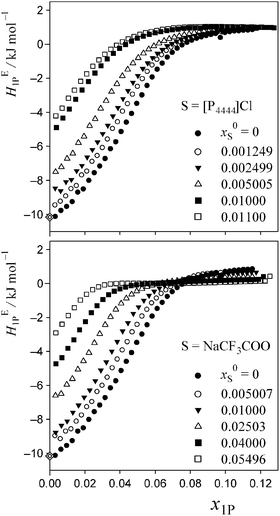 | ||
| Fig. 3 Excess partial molar enthalpy, HE1P, of 1P in 1P–S–H2O at 25 °C and given initial salt concentration, x0S. Diamonds represent HE1P in dilute solution, as reported by Wadso et al.35 | ||
Evaluation of HE1P1P from HE1P data
With a good set of raw HE1P data with an averaged uncertainty of ±0.03 kJ mol−1 and small increments in x1P, the raw HE1P data themselves were used to calculate the derivative on the far right of eqn (1). In general, a numerical derivative directly using two neighbouring data points causes large noise, especially in applications with raw experimental data. In the present study, we originally utilized a differential method based on eqn (3) for calculation of the partial molar quantities with higher-order derivatives. We approximate the slope of the tangent at the i-th point as the weighted average of the slopes of the two adjacent arcs; one between the (i − 1)-th and i-th data points and another between the i-th and (i + 1)-th data points.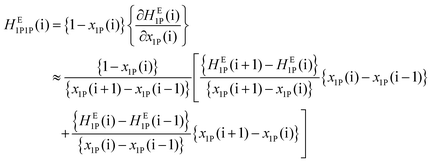 | (3) |
Certainty in evaluation of the partial molar quantities with higher-order derivatives is of particular importance in the present study. Fig. 4(a)–(c) show comparisons of HE1P1P determined using eqn (3) and that determined using other evaluation methods. Fig. 4(a) shows comparison between the HE1P1P pattern obtained using eqn (3) and that evaluated by the graphical method normally exercised. As shown in Fig. 4(b), combination of eqn (3) and the graphical evaluation shows improvement especially in the pre-peak region. The point X evaluated by the HE1P1P pattern corresponds to each other regardless of the method. Fig. 4(c) shows comparison between eqn (3) and simple derivative using two neighbouring data points. As mentioned above, the calculation using eqn (3) is superior to the simple derivative using two alternating data points with regard to noise reduction, as shown in Fig. 4(c). Therefore, it is concluded that the calculation based on eqn (3) is the most certain for evaluation of partial molar quantities with higher-order derivatives in the present data set. Thus, calculation based on eqn (3) was utilized here for evaluation of HE1P1P, leading to determination of the hydrophobicity and hydrophilicity indices.
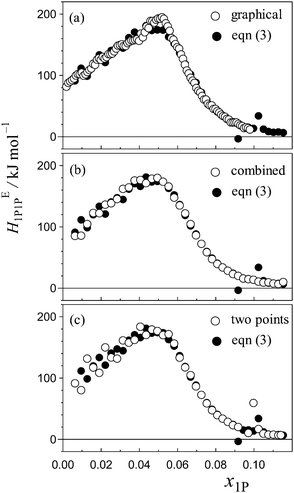 | ||
| Fig. 4 Comparison of HE1P1P pattern for the binary (1-propanol–H2O) mixture calculated based on differentiation using eqn (3) (solid circles) with those using other evaluation methods (open circles); (a) typical graphical evaluation normally exercised for 1P-probing studies,34 (b) combination of calculation using eqn (3) and graphical evaluation, (c) simple derivative using two data points with δx1P ≈ 0.006. | ||
Hydrophobicity/hydrophilicity obtained from the HE1P1P pattern
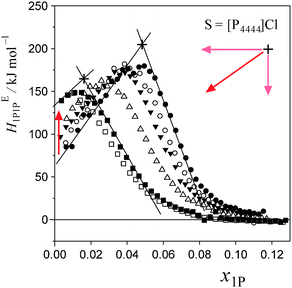
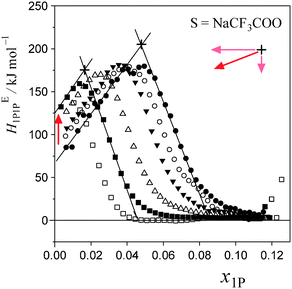
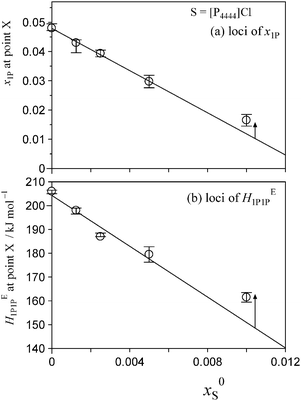
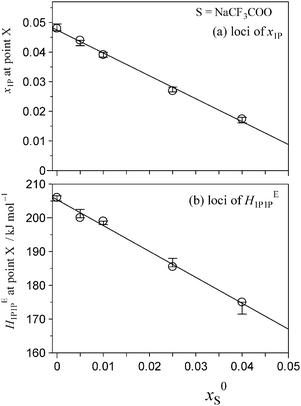
Fig. 5 and 6 show the patterns of resulting HE1P1P for S = [P4444]Cl and S = NaCF3COO, respectively. The peak top of HE1P1P appears at 0.049 of x1P for binary (1-propanol–H2O) mixture.19 The peak top shifts to the west (direction of smaller x1P) as x0S increases. Point X nearly disappears at x0S = 0.0110 for S = [P4444]Cl and x0S = 0.0550 for S = NaCF3COO, qualitatively indicating that the hydrophobicity of [P4444]Cl is much larger than that of NaCF3COO. The starting point of HE1P1P at x1P = 0 shifts to the north (direction of larger HE1P1P) with increasing x0S. This northward shift also corresponds to the strong hydrophobicity of [P4444]+. For NaCF3COO, the equivalent shift at x1P = 0 is lesser.The degrees of the shifts are plotted in Fig. 7 and 8. The slopes of x1P loci shown in Fig. 7(a) and 8(a) yielded the hydrophobicity indices and hydration numbers, nH. The contribution from counter ions (Na+ or Cl−) was corrected by subtraction in the evaluation. The slopes of the HE1P1P loci in Fig. 7(b) and 8(b) directly correspond to the hydrophilicity indices in the present evaluation. The hydrophilicity indices of the counter ions of Na+ and Cl− used in the present study are equal to zero, since these ions are classified as the hydration centre. As mentioned in Introduction, hydration centres such as Na+ and Cl− unperturb the bulk H2O molecules away from the hydration shells around the ions. Hydrophobicity/hydrophilicity indices and hydration numbers of [P4444]+ and CF3COO− are listed in Table 1.
| Ion | Class | Hydrophobicity | n H | Hydrophilicity (kJ mol−1) | Applicable x0S range | Aggregationb | Ref. |
|---|---|---|---|---|---|---|---|
| a Hydration number evaluated from the loci of point X. b Aggregation observed in the region of Mixing Scheme I. | |||||||
| Cations | |||||||
| [P4444]+ | Amphiphile | −3.49 | 72 | −5337 | <0.012 | x 0S > 0.0080 | This work |
| [C2mim]+ | Amphiphile | −0.39 | 7 | −1970 | <0.024 | None | 20, 21 and 29 |
| [C4mim]+ | Amphiphile | −1.31 | 26 | −3227 | <0.029 | x 0S > 0.013 | 20, 21 and 27 |
| [C4C1mim]+ | Amphiphile | −1.85 | 37 | −6760 | <0.018 | x 0S > 0.0060 | 20, 21 and 29 |
| Anions | |||||||
| CF3COO− | Hydrophobe | −0.49 | 10 | −767 | <0.055 | None | This work |
| CH3COO− | Hydrophobe | −0.22 | 3.7 | 0 | <0.05 | None | 20, 21 and 36 |
The results indicate that [P4444]+ is an amphiphile with strong hydrophobic and equally strong hydrophilic contributions. [P4444]+ forms a large hydration shell with a hydration number of nH = 72, which is three times larger than that of typical imidazolium-based cation 1-butyl-3-methylimidazolium, [C4mim]+.27 The value of a hydration number for CF3COO− was found to be nH = 10. On the basis of earlier findings in 1P-probing studies on a series of carboxylates,36 one H2O molecule out of the 10 H2O molecules should be used for hydration of the –COO− side and the remaining 9.0 H2O molecules for the fluoroalkyl group, –CF3. This hydration number is much larger than that of the alkyl group in CH3COO−; the hydration number for –CH3 in CH3COO− is estimated to be 2.7.36 The fact that the fluoroalkyl group is a stronger hydrophobe than the alkyl group could be related to this finding;37 an aqueous solution of the CF3COO− salt of [P4444]+ shows LCST, and that of the CH3COO− salt does not.
Self-aggregation behaviour of [P4444]+
As shown in Fig. 7, the induced changes at x0S = 0.010 for S = [P4444]Cl depart from the linear relationship defined in the lower x0S region. This departure shifts to the upper side beyond the data error in the present evaluation. This departure hints the self-aggregation of the kind found in imidazolium-based ILs. For [C4C1mim]Cl29 and [C4mim]Cl,27 similar plots are seen that show a break in the slopes at x0S = 0.006 and 0.014, respectively. For aqueous solutions of [C4mim]BF4, this similar behaviour was interpreted as self-aggregation of cations through NMR spectroscopy,38 electric conductivity,39–41 small-angle neutron scattering,41,42 density,43 speed of sound43 and surface tension.39,41 Thus, we suggest that departure of the induced change at x0S = 0.010 for the case shown in Fig. 7 could also be caused by self-aggregation of [P4444]+.For further investigation of this issue, electric conductivity measurements were conducted for the aqueous solutions of [P4444]CF3COO. The obtained conductivity was converted to molar conductivity according to the Kohlrausch empirical relation.44Fig. 9 shows the isotherm of the molar conductivity as a function of the square root of IL concentration. The linear portion represents the usual behaviour of ionic solutions in the dilute region. This linearity seems to start to deviate at  (mmol L−1)1/2, which corresponds to a mole fraction of 0.0080. The fact that the conductivity shows deviation from the usual behaviour at xIL = 0.0080 suggests that [P4444]CF3COO dissociates into its constituent ions in the dilute region and aggregation of [P4444]+ begins at a mole fraction of approximately 0.0080, as the case for imidazolium-based ILs. Considering the larger hydrophobicity (hydration number) of [P4444]+ compared to those of [C4mim]+ and [C4C1mim]+, the breakpoint (or aggregation) of [P4444]+ might be expected at a much lower concentration; however, this was not observed. This discrepancy could be related to the difference in the aggregation mechanisms of imidazolium-based and phosphonium-based cations. The imidazolium ions have an ionic head and alkyl tail, while phosphonium-based ions have an ionic centre and four alkyl tails extending in random directions. Wang et al. suggested that the aggregation aspect of [P4444]CF3COO in aqueous solution can be described in terms of microemulsion-like aggregation at the mesoscale level in higher concentration ranges near the critical point.45
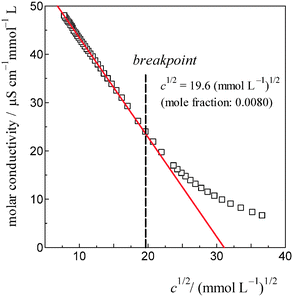 | ||
| Fig. 9 The isotherm of electric conductivity for aqueous solutions of [P4444]CF3COO based on the Kohlrausch empirical relation.42 The break point was estimated to be c1/2 = 19.6 (mmol L−1)1/2 for [P4444]CF3COO, corresponding to a 0.0080 mole fraction of the IL. | ||
2D map of hydrophobicity/hydrophilicity
Fig. 10 shows the 2D map of hydrophobicity/hydrophilicity for [P4444]+ and CF3COO−. In the map, H2O defines the origin (0,0). 1-Propanol used as the probe is necessarily plotted at (−1,0). Relative to these points, ions with greater hydrophobic contributions spread to the west (negative horizontal direction) and those with greater hydrophilic contributions spread to the south (negative vertical direction). A total of four cations and nine anions of typical IL constituents are plotted in Fig. 10. The cations20,21 are [C2mim]+, [C4mim]+, [C4C1mim]+ and the present [P4444]+. The anions20,21,30 are Cl−, CH3COO−, Br−, BF4−, [OTf]−, PF6−, [NTf2]− and the present CF3COO−. As evident from Fig. 10, [P4444]+ shows the most significant amphiphilicity, with strong hydrophobic and equally strong hydrophilic contributions, among the constituent cations of the ILs studied. Furthermore, the IL constituent ions are located farther from the origin than are the typical inorganic small ions. Our recent study on normal ions (i.e. non-IL forming ions) shows that anions are located farther from the origin than cations.46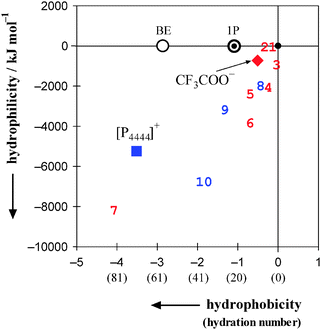 | ||
| Fig. 10 2D map of hydrophobicity/hydrophilicity for typical constituent ions of ionic liquids. Values in parentheses on the horizontal axis denote hydration numbers. H2O is located at the origin (0,0) and the probing 1P is located at (−1,0). The square and the diamond represent the present results for [P4444]+ and CF3COO−, respectively. Seven other constituent anions20,21,30 and three cations20,21 are shown together; 1: Cl−, 2: CH3COO−, 3: Br−, 4: BF4−, 5: [OTf]−, 6: PF6−, 7: [NTf2]−, 8: [C2mim]+, 9: [C4mim]+, 10: [C4C1mim]+. An aqueous solution of 2-butoxyethanol (abbreviated as BE) exhibits an LCST below 50 °C.50,51 See text for discussion. | ||
Kohno et al.15 took advantage of the phase separation of IL–H2O systems and estimated the H2O content in the IL phase. They then determined the hydration number per mole of IL and defined it as the hydrophilicity of the IL. They concluded that the LCST behaviour strongly depended on the evaluated “hydrophilicity” indices. We point out that their hydrophilicity concept is based on the H2O content in the IL-rich situation. In the 1P probing, hydrophilicity is only a part of the effects of the ion in question to H2O in the water-rich region, the other part being hydrophobicity. Saita et al.47 suggested another one-dimensional scale based on salt effects of test ions fixed as [P4444]+ or CF3COO− counter ion on the LCST of [P4444]CF3COO−H2O system. It is concluded that changes in the critical temperatures of IL–H2O systems are clearly related to the “hydrophilicity” of the target ions.
In the present 1P-probing methodology, the hydration number of the species in question is evaluated from “hydrophobicity” index. The hydrophobicity is defined on the basis of hydration of the solute with H2O molecules, namely the formation of the hydration shell in water-rich region. Hydrophile in the 1P probing is defined as a solute that forms hydrogen bonds directly to the existing hydrogen bond network of H2O, discussed in detail in Introduction. As shown in Fig. 10, the typical constituent ions are classified as “amphiphiles” with strong hydrophobic and equally strong hydrophilic contributions. Thus, the present two-dimensional scale covers the ranking of “hydrophilicity” from the one-dimensional scale and might lead to a deeper understanding on the effects of molecular organization of H2O.
Conclusions
The constituent ions of [P4444]CF3COO were characterized in terms of their effects on the molecular organization of H2O using the 1P-probing methodology. A differential method based on the weighted average of two slopes was utilized to calculate HE1P1P. The most significant amphiphile among the IL constituent cations studied was [P4444]+, which had strong hydrophobic and equally strong hydrophilic contributions. The hydration number was evaluated to be nH = 72, which was the largest value among the group of cations. Characterization of CF3COO− confirmed that it was a hydrophobe with a hydration number of nH = 10, out of which one H2O molecule hydrated the –COO− side and the remaining 9.0 H2O molecules the fluoroalkyl group, –CF3. The self-aggregation behaviour of [P4444]+ in the aqueous solution of [P4444]CF3COO was revealed above 0.0080 mole fraction of the IL.It is suggested that the formation of the large hydration shell around [P4444]+ evaluated in the present study causes loss in excess entropy of mixing. Hence, this entropic loss must have bearing to the present LCST behaviour as mentioned in Introduction. Koga et al. sorted out the occurrence of phase separation with an LCST as well as a UCST in terms of signs of HEii and SEii, the third derivative of GE in the binary solute(i)–H2O system.19,48 Although their argument was based on a necessary but not sufficient condition, it was applied to the [C4mim]BF4–H2O system and the HEii and SEii for i = [C4mim]BF4 was found to be negative, which is appropriate for the UCST at 4 °C and xi = 0.07.49 For the present case, however, since we have not yet determined HEi and SEi for i = [P4444]CF3COO, we will postpone the detailed discussions about the occurrence of LCST for aqueous solution of the present IL. As shown in Fig. 10, 2-butoxyethanol (BE) was found to form an analogously large hydration shell around the molecule, nH = 58,23 and the aqueous solution of BE exhibits the LCST below 50 °C.50,51
Acknowledgements
We would like to express deepest appreciation to Dr Y. Koga at the University of British Columbia for his discussion about the 1P-probing experiment and critical reading of the manuscript. We are deeply grateful to Prof. H. Ohno, Dr Y. Kohno and Dr S. Saita at Tokyo University of Agriculture and Technology for preparation of the ionic liquid used in this study, measurements of the electric conductivity and fruitful discussion. T.M. is grateful to Prof. K. Nishikawa for cooperation of the experiment. This work was partially supported by Grant-in-Aid for Scientific Research (JSPS KAKENHI) (No. 24550009). T.M. thanks MEXT, Japan, for Grants for Excellent Graduate Schools for the financial support for his stay at Roskilde University.Notes and references
- J. S. Wilkes and M. J. Zaworotko, J. Chem. Soc., Chem. Commun., 1992, 965 RSC.
- T. Welton, Chem. Rev., 1999, 99, 2071 CrossRef CAS PubMed.
- J. F. Wishart and E. W. Castner, Jr., “The Physical Chemistry of Ionic Liquids” (Editorial for Special Issue), J. Phys. Chem. B, 2007, 111, 4639.
- N. V. Plechkova and K. R. Seddon, Chem. Soc. Rev., 2008, 37, 123 RSC.
- P. Wasserscheid and T. Welton, Ionic Liquids in Synthesis, Wiley-VCH, Weinheim, 2nd edn, 2008 Search PubMed.
- K. Fukumoto and H. Ohno, Angew. Chem., Int. Ed., 2007, 46, 1852 CrossRef CAS PubMed.
- Y. Kohno, H. Arai, S. Saita and H. Ohno, Aust. J. Chem., 2011, 64, 1560 CrossRef CAS.
- Y. Kohno and H. Ohno, Chem. Commun., 2012, 48, 7119 RSC.
- T. V. Hoogerstraete, B. Onghena and K. Binnemans, J. Phys. Chem. Lett., 2013, 4, 1659 CrossRef CAS.
- A. J. L. Costa, M. R. C. Soromenho, K. Shimizu, J. M. S. S. Esperança, J. N. C. Lopes and L. P. N. Rebelo, RSC Adv., 2013, 3, 10262 RSC.
- W. Li and P. Wu, Polym. Chem., 2014, 5, 5578 RSC.
- Y. Kohno, S. Saita, Y. Men, J. Yuan and H. Ohno, Polym. Chem., 2015, 6, 2163 RSC.
- (a) H. Glasbrenner and H. Weingärtner, J. Phys. Chem., 1989, 93, 3378 CrossRef CAS; (b) S. A. Buckingham, C. J. Garvey and G. G. Warr, J. Phys. Chem., 1993, 97, 10236 CrossRef CAS; (c) H. Weingärtner, M. Kleemeier, S. Wiegand and W. Schröer, J. Stat. Phys., 1995, 78, 169 CrossRef; (d) M. Kleemeier, W. Schröer and H. Weingärtner, J. Mol. Liq., 1997, 73–74, 501 CrossRef; (e) Z.-L. Xie and A. Taubert, ChemPhysChem, 2011, 12, 364 CrossRef CAS PubMed; (f) Y. Kohno and H. Ohno, Aust. J. Chem., 2012, 65, 91 CrossRef CAS; (g) Y. Kohno, Y. Deguchi and H. Ohno, Chem. Commun., 2012, 48, 11883 RSC; (h) S. Saita, Y. Kohno, N. Nakamura and H. Ohno, Chem. Commun., 2013, 49, 8988 RSC; (i) Y. Tsuji and H. Ohno, Chem. Lett., 2013, 42, 527 CrossRef CAS; (j) T. Ando, Y. Kohno, N. Nakamura and H. Ohno, Chem. Commun., 2013, 49, 10248 RSC; (k) Y. Fukaya and H. Ohno, Phys. Chem. Chem. Phys., 2013, 15, 4066 RSC; (l) Y. Fukaya and H. Ohno, Phys. Chem. Chem. Phys., 2013, 15, 14941 RSC; (m) S. Saita, Y. Mieno, Y. Kohno and H. Ohno, Chem. Commun., 2014, 50, 15450 RSC; (n) Y. Deguchi, Y. Kohno and H. Ohno, Chem. Lett., 2015, 44, 238 CrossRef CAS.
- (a) J. E. L. Dullius, P. A. Z. Suarez, S. Einloft, R. F. de Souza and J. Dupont, Organometallics, 1998, 17, 815 CrossRef CAS; (b) P. J. Dyson, D. J. Ellis and T. Welton, Can. J. Chem., 2001, 79, 705 CrossRef CAS; (c) C. A. Cerdeiriña, J. Troncoso, C. P. Ramos, L. Romani, V. Najdanovic-Visak, H. J. R. Guedes, J. M. S. S. Esperança, Z. P. Visak, M. Nunes da Ponte and L. P. N. Rebelo, Ionic Liquids III A, in Fundamentals, Progress, Challenges, and Opportunities, ed. R. Rogers and K. R. Seddon, ACS Symp. Ser., 2005, ch. 13, vol. 901, p. 175 Search PubMed; (d) P. Nockemann, B. Thijs, S. Pittois, J. Thoen, C. Glorieux, K. V. Hecke, L. V. Meervelt, B. Kirchner and K. Binnemans, J. Phys. Chem. B, 2006, 110, 20978 CrossRef CAS PubMed; (e) Y. Fukaya, K. Sekikawa, K. Murata, N. Nakamura and H. Ohno, Chem. Commun., 2007, 3089 RSC; (f) P. Nockemann, K. Binnemans, B. Thijs, T. N. Parac-Vogt, K. Merz, A.-V. Mudring, P. C. Menon, R. N. Rajesh, G. Cordoyiannis, J. Thoen, J. Leys and C. Glorieux, J. Phys. Chem. B, 2009, 113, 1429 CrossRef CAS PubMed.
- Y. Kohno and H. Ohno, Phys. Chem. Chem. Phys., 2012, 14, 5063 RSC.
- U. Domańska, E. Bogel-Łukasik and R. Bogel-Łukasik, Chem. – Eur. J., 2003, 9, 3033 CrossRef PubMed.
- L. Ropel, L. S. Belvèze, S. N. V. K. Aki, M. A. Stadtherr and J. F. Brennecke, Green Chem., 2005, 7, 83 RSC.
- M. L. S. Batista, L. I. N. Tomé, C. M. S. S. Neves, E. M. Rocha, J. R. B. Gomes and J. A. P. Coutinho, J. Phys. Chem. B, 2012, 116, 5985 CrossRef CAS PubMed.
- Y. Koga, Solution Thermodynamics and Its Application to Aqueous Solutions: A Differential Approach, Elsevier, Amsterdam, 2007, and references are cited in this textbook Search PubMed.
- Y. Koga, Phys. Chem. Chem. Phys., 2013, 15, 14548 RSC.
- Y. Koga, J. Mol. Liq., 2015, 205, 31 CrossRef CAS PubMed.
- P. Westh, H. Kato, K. Nishikawa and Y. Koga, J. Phys. Chem. A, 2006, 110, 2072 CrossRef CAS PubMed.
- Y. Koga, P. Westh, K. Nishikawa and S. Subramanian, J. Phys. Chem. B, 2011, 115, 2995 CrossRef CAS PubMed.
- J. Hu, W. M. Chiang, P. Westh, D. H. C. Chen, C. A. Haynes and Y. Koga, Bull. Chem. Soc. Jpn., 2001, 74, 809 CrossRef CAS.
- K. Miki, P. Westh and Y. Koga, J. Phys. Chem. B, 2005, 109, 19536 CrossRef CAS PubMed.
- T. Morita, P. Westh, K. Nishikawa and Y. Koga, J. Phys. Chem. B, 2012, 116, 7328 CrossRef CAS PubMed.
- K. Miki, P. Westh, K. Nishikawa and Y. Koga, J. Phys. Chem. B, 2005, 109, 9014 CrossRef CAS PubMed.
- H. Kato, K. Nishikawa and Y. Koga, J. Phys. Chem. B, 2008, 112, 2655 CrossRef CAS PubMed.
- H. Kato, K. Miki, T. Mukai, K. Nishikawa and Y. Koga, J. Phys. Chem. B, 2009, 113, 14754 CrossRef CAS PubMed.
- T. Morita, A. Nitta, K. Nishikawa, P. Westh and Y. Koga, J. Mol. Liq., 2014, 198, 211 CrossRef CAS PubMed.
- E. Calvet and H. Prat, Recent Progress in Microcalorimetry, Pergamon Press, Oxford, 1963 Search PubMed.
- K. R. Loblich, Thermochim. Acta, 1994, 231, 7 CrossRef.
- B. Löwen, S. Schulz and J. Seippel, Thermochim. Acta, 1994, 235, 147 CrossRef.
- M. T. Parsons, P. Westh, J. V. Davies, C. Trandum, W. M. Chiang, E. G. M. Yee and Y. Koga, J. Solution Chem., 2001, 30, 1007 CrossRef CAS.
- I. Wadso and R. N. Goldberg, Pure Appl. Chem., 2001, 73, 1625 CrossRef CAS.
- T. Kondo, Y. Miyazaki, A. Inaba and Y. Koga, J. Phys. Chem. B, 2012, 116, 3571 CrossRef CAS PubMed.
- Private communication.
- T. Singh and A. Kumar, J. Phys. Chem. B, 2007, 111, 7843 CrossRef CAS PubMed.
- J. Bowers, C. P. Butts, P. J. Martin, M. C. V. Gutierrez and R. K. Heenan, Langmuir, 2004, 20, 2191 CrossRef CAS.
- J. Wang, H. Wang, S. Zhang, H. Zhang and Y. Zhao, J. Phys. Chem. B, 2007, 111, 6181 CrossRef CAS PubMed.
- N. V. Sastry, N. M. Vaghela and V. K. Aswal, Fluid Phase Equilib., 2012, 327, 22 CrossRef CAS PubMed.
- L. Almásy, M. Turmine and A. Perera, J. Phys. Chem. B, 2008, 112, 2382 CrossRef PubMed.
- M. Tariq, F. Moscoso, F. J. Deive, A. Rodriguez, M. A. Sanroman, J. M. S. S. Esperança, J. N. C. Lopes and L. P. N. Rebelo, J. Chem. Thermodyn., 2013, 59, 43 CrossRef CAS PubMed.
- A. G. Avent, P. A. Chaloner, M. P. Day, K. R. Seddon and T. Welton, J. Chem. Soc., Dalton Trans., 1994, 3405 RSC.
- R. Wang, W. Leng, Y. Gao and L. Yu, RSC Adv., 2014, 4, 14055 RSC.
- T. Morita, P. Westh, K. Nishikawa and Y. Koga, J. Phys. Chem. B, 2014, 118, 8744 CrossRef CAS PubMed.
- S. Saita, Y. Kohno and H. Ohno, Chem. Commun., 2013, 49, 93 RSC.
- Y. Koga, J. Phys. Chem., 1996, 100, 5172 CrossRef CAS.
- H. Katayanagi, K. Nishikawa, H. Shimozaki, K. Miki, P. Westh and Y. Koga, J. Phys. Chem. B, 2004, 108, 19451 CrossRef CAS.
- C. M. Ellis, J. Chem. Educ., 1967, 44, 405 CrossRef CAS.
- M. D'Angelo, G. Onori and A. Santucci, Chem. Phys. Lett., 1994, 220, 59 CrossRef.
Footnote |
| † Electronic supplementary information (ESI) available. See DOI: 10.1039/c5cp02329g |
| This journal is © the Owner Societies 2015 |

