 Open Access Article
Surface-modified CAU-10 MOF materials as humidity sensors: impedance spectroscopic study on water uptake†
Alexander
Weiss
a,
Nele
Reimer
b,
Norbert
Stock
b,
Michael
Tiemann
a and
Thorsten
Wagner
 *a
*a
aUniversity of Paderborn, Faculty of Science, Department Chemistry, Warburger Str. 100, 33098 Paderborn, Germany. E-mail: thorsten.wagner@upb.de; Fax: +05251 60 3423; Tel: +05251 60 2486
bChristian Albrechts University Kiel (CAU), Institute of Inorganic Chemistry, Max-Eyth-Straße 2, 24118 Kiel, Germany
First published on 13th July 2015
Abstract
Metal–organic frameworks (MOFs) are crystalline microporous materials with tunable chemical and physical properties. By combining various metal clusters with different interconnecting organic linkers, the pore structure, crystallinity, as well as the surface properties can be modified. In the present work, modification of the organic linker molecules is utilized to synthesize CAU-10 type MOFs with variable affinity of the pore surface to water. In principle, this should influence the accessibility of the pores for water vapor and therefore offer a tool to control its sorption properties. For a deeper understanding we studied the water sorption characteristics and compared the results to the conductive and dielectric properties studied by impedance spectroscopy. Spectra in a wide frequency range from 1 mHz to 1 MHz were recorded. Data analysis is performed using the Havriliak–Negami model. The MOFs are also tested as sensitive layers for capacitive humidity sensing by correlating the change in permittivity of the materials with the amount of physisorbed water. Such an MOF-based sensor was tested with respect to environmental monitoring and compared to a commonly used commercial humidity sensor.
Introduction
Metal–organic frameworks (MOFs) are highly porous structures whose surface areas can achieve values up to 7000 m2 g−1.1 MOFs consist of metal ion clusters (acting as knots) and interconnecting organic linkers. One of their main advantages is the high tunability that can be obtained by combining various metals with different linkers. More than 10![[thin space (1/6-em)]](https://www.rsc.org/images/entities/char_2009.gif) 000 structures with different properties are known to date. This fact makes them a promising class of materials for various applications such as gas storage, heat exchange, separation, catalysis, and sensing. The latter can be realized by a wide range of transducer mechanisms ranging from optical (e.g., luminescence2,3 or colour change4), over mechanical (e.g., coating of quartz-crystal microbalances5 or microcantilevers6), to electronic mechanisms.
000 structures with different properties are known to date. This fact makes them a promising class of materials for various applications such as gas storage, heat exchange, separation, catalysis, and sensing. The latter can be realized by a wide range of transducer mechanisms ranging from optical (e.g., luminescence2,3 or colour change4), over mechanical (e.g., coating of quartz-crystal microbalances5 or microcantilevers6), to electronic mechanisms.
Due to the multiplicity of sensing mechanisms and target gases there are only a few reports concerning the conducting and dielectric properties of MOFs in the presence of water vapour. The focus is, however, on either screening of different MOFs for impedimetric gas sensing abilities in general7 or testing new material synthesis for sensing applications.8 To the best of the author's knowledge there is no study on systematic optimization of the MOF sensing layers and the operating mode for humidity sensing as presented in this work. We also cover the range below 1 Hz in the measurements since lower frequencies enhance the response to humidity.7,8 Even though low frequencies are less suitable for fast sensing devices, this allows a more comprehensive analysis of MOF impedance spectra.
The understanding of electric system response in combination with water sorption measurements is a crucial factor on the way to reliable resistive-type or capacitive-type humidity sensors, which represent the most popular among all humidity sensing mechanisms. The polymers that are commonly used for this purpose cannot be operated at high temperatures (<200 °C9) and have the disadvantage of possible damage at very high relative humidity.
Experimental methods
Synthesis and characterization
In the present study three modifications of the CAU-10 MOF are compared (CAU-10-H, CAU-10-NO2, and CAU-10-OH). Parts of the functional groups are replaced by sulfonic acid groups. Synthesis was performed according to the literature.10 For the CAU-10-H0.76/(SO3H)0.24 samples (further denoted as CAU-10-H/S) the reaction temperature in the steel autoclave with a teflon inset was chosen to be 135 °C for 12 h with 1 h heating and cooling ramp, respectively. The syntheses of CAU-10-(NO2)0.79/(SO3H)0.21 and CAU-10-(OH)0.89/(SO3H)0.11 (further denoted as CAU-10-O/S and CAU-10-N/S) were performed in a glass reactor equipped with a screw cap and a volume of 100 mL. The reactions were performed in an oven at 120 °C for 12 h with 2 h heating and cooling ramp, respectively. The resulting precipitates were filtered off, washed with water and dried in air.To determine the ratio of incorporated linker molecules, liquid 1H-NMR spectroscopy measurements were performed. The resulting compounds exhibited doping degrees of sulfonic acid groups of 23.5%, 21.3% and 10.9%, respectively, as calculated from the peak integrals.
Water sorption isotherms of powder samples were recorded using a BEL JAPAN INC Belsorpmax instrument. To guarantee the stability of the modified MOF frameworks one sample was again characterized after pellet pressing. Prior to each measurement the samples were activated at 200 °C over night under vacuum (10−2 kPa).
Sample preparation
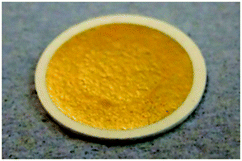
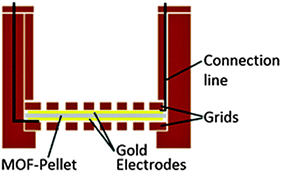
To measure the capacitance of the MOFs, a plate capacitor geometry was chosen. 100 mg of the powder samples were pressed to pellets with a diameter of 13 mm and 0.5 mm thickness. The pressure was 35.8 MPa for CAU-10-H/S and CAU-10-O/S, and 57.2 MPa for CAU-10-N/S. In order to create mechanically stable electrodes which are permeable to gases and vapor, the pellets were coated with layers of gold by thermal vapor deposition on both sides. The size of these electrodes was chosen as 11 mm to prevent short-circuits at the edges (Fig. 1). This setup avoids capacitance changes due to electrode displacement, as occasionally observed when rigid metal electrodes are only pressed on top of the pellet. The gold layer thickness was adjusted to 80 nm utilizing a quartz crystal microbalance. This thickness guarantees sufficient conductivity on the rough pellet surface and provides gaps and cracks to allow gases to diffuse through the system at the same time. Conductivity of the electrodes was confirmed by measuring the surface resistance. The electrodes were connected utilizing a cylindrical custom-built sample holder, which allows gases to flow through the pellet and is an improved development of earlier studies11 (Fig. 2).Measurement system
Defined atmospheres were provided by a gas mixing system consisting of two mass flow controllers. One stream delivered dry synthetic air, whereas the second one was humidified by allowing it to flow through a washing bottle with pure water. A mixing ratio of 0![[thin space (1/6-em)]](https://www.rsc.org/images/entities/char_2009.gif) :
:![[thin space (1/6-em)]](https://www.rsc.org/images/entities/char_2009.gif) 1 (0% dry air, 100% humidified air) corresponds to an absolute humidity of ca. 26 g m−3 at room temperature (27 °C). The mixture was transferred to a tube containing the sample holder. Impedance spectra were recorded using a Solartron SI1260 frequency response analyzer (FRA). A simple setup was used for the first screening in the range from 10 Hz to 1 MHz (Fig. 3a, for details see also ref. 12). The sample was connected in a 4-point-arrangement to minimize effects from the connection lines.
1 (0% dry air, 100% humidified air) corresponds to an absolute humidity of ca. 26 g m−3 at room temperature (27 °C). The mixture was transferred to a tube containing the sample holder. Impedance spectra were recorded using a Solartron SI1260 frequency response analyzer (FRA). A simple setup was used for the first screening in the range from 10 Hz to 1 MHz (Fig. 3a, for details see also ref. 12). The sample was connected in a 4-point-arrangement to minimize effects from the connection lines.
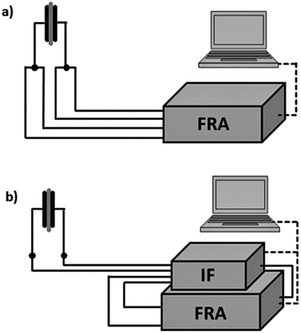 | ||
| Fig. 3 Set-up (a) in 4-point-arrangement with only the FRA and (b) enhanced with dielectric interface for highly ohmic sample conditions. | ||
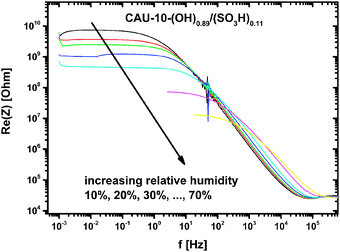
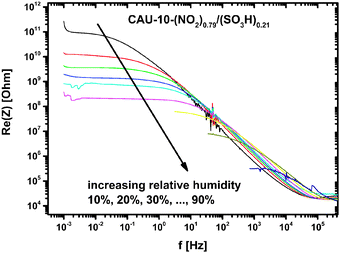
The screening measurements showed that the samples exhibited very high resistance values at low frequencies when exposed to air with r.h. values lower than 30%.12 To overcome the induced low signal-to-noise ratio the system was enhanced by a ‘Chelsea Dielectric Interface’, the function of which is two-fold. It acts as a high-impedance buffer between the sample and the FRA. Additionally, it facilitates the measurement of small currents flowing through the dielectric sample (0.1 pA). It also acts as a wide band-width current-to-voltage converter, so the FRA is set to voltage measurement in this setup (Fig. 3b). Thus, the measurement frequencies can be reduced down to the mHz order even for small capacitance.
Measurements were conducted using a sine-wave voltage with an amplitude of 500 mV. A Sensirion SHT21 served as the reference humidity and temperature sensor for the application survey. In these measurements the absolute humidity (a.h.) is calculated according to eqn (1)
 | (1) |
Results and discussion
Water vapor sorption measurements
In the following a short summary of the water sorption results is given. A more detailed interpretation has been provided in another paper by this group focused on the synthesis and screening measurements of the presented samples for humidity sensing application.12To reduce the measurement time water vapor sorption measurements were performed at 298 K on powder samples, since pellet pressing was shown to let the characteristic of the MOF unmodified (for the plot see the ESI,† Fig. S1 and S2). Compared to the unmodified samples used by Reinsch et al.13 the CAU-10-O/S sample shows the smallest change in water sorption. This result is attributed to the considerably smaller sulfonate content of this sample.
The affinity towards water is nearly the same at a pressure range lower than p/p0 = 0.05 for all samples. The slope of the isotherms is generally higher compared to the unmodified samples in this region. This response to water sorption is commonly attributed to a stronger adsorbate–adsorbent interaction, i.e. a higher water vapor affinity.14 Hydrophilic modification of the surface groups leads to an increasing affinity in water adsorption and therefore pore filling shifts to lower p/p0 values.15 The unmodified samples exhibit a very small increase below the step-like change in the region of p/p0 = 0.1–0.2.
CAU-10-N/S shows some further effects in the pressure region above p/p0 = 0.1–0.2. In good agreement with the behavior of the unmodified samples with increasing pressure its affinity towards water is clearly lower than those of the other two compounds. However, in the high-pressure region (0.8–1.0) it exhibits a steeper slope. Taking the whole range into account, the partial pressure, at which half of the maximum water uptake is reached, shifts towards higher values.
Since, according to Reinsch et al., the modification of the linker molecules has an effect on their steric orientation and thereby significantly alters the effective pore size and pore accessibility, the influence of surface chemistry cannot clearly be differentiated from that of pore size and spatial aspects. The observed hysteresis is attributed to water–MOF interaction, leading to network changes. This is particularly likely in our case because of the sulfonate modification. The relatively small hysteresis of CAU-10-H/S compared to the other samples is explained by the weaker polarity of the framework.
Impedance measurements
The recovery time for the water desorption (change from 100% r.h. to dry air) increased in the order CAU-10-H/S, CAU-10-O/S and CAU-10-N/S. This is very similar to the hysteresis behavior in the desorption branches of the sorption isotherms.
The dynamic behavior of CAU-10-N/S was analyzed by fast changes in the atmosphere from 30% to 40% r.h. However, the response time is limited by the inertia of the gas mixing system, leading to non-step-like atmospheric changes. Consequently, the t90-time can only be estimated and added up to approximately 12 minutes.
Achmann et al. also showed frequency spectra of Basolite® A100 (Al-BDC, [Al(OH)(1,4-BDC)] 1,4-BDC = 1,4-benzenedicarboxylate) at 120 °C in dry and wet N2 carrier gas which did not exhibit any RC-like behavior, potentially due to the limited frequency range (>1 Hz). They obtained responses at 1 Hz for all impedance measurement parameters (Z, Re(C), Im(Z)) that are smaller than 50%.7 Our samples, in contrast, show responses of up to 4 orders of magnitude. The measurements cover the same range of relative humidity, but were carried out at room temperature.
Due to this strong response to humidity, the measurement is very sensitive to changes in environmental conditions, such as temperature (see also section ‘Application test’). This is the limiting factor with respect to reproducibility, which is high considering only the impedance measurements.
 | (2) |
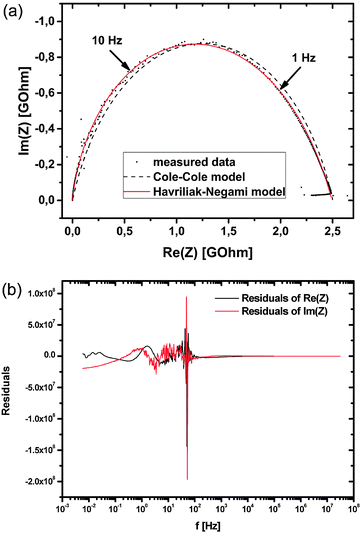
As can be seen in the Nyquist plot of an exemplary data set (Fig. 6) this Cole–Cole model approach still differs from the measured data points which show a distorted arc. Taking this asymmetry into account the data was fitted applying the Havriliak–Negami (HN) model, which represents an overlap of several semicircles with similar but not equal time constants.18 This ‘universal’ character of the HN model allows an easy comparison of measurements even with different number of involved processes.
 | (3) |
Eqn (3) reduces to the Cole–Cole model if β = 1 and to the Cole–Davidson model19 if α = 1. To fit the present data it is important to notice that β is not restricted to 0 < β < 1 as mentioned in some publications.20,21 The right restriction is obtained from Havriliak and Negami18 by setting the maximum angle between the arc and the real-part axis to 90°, leading to the expression β < 1/α. This constraint allows values of β > 1 which are necessary to fit arcs with maxima shifted to higher frequencies (lower real part). The residual plot for the exemplarily given fit in Fig. 6a is shown in Fig. 6b. As can be seen, it exhibits heteroscedasticity as well as some non-statistic contributions. However, the absolute values are rather small so that we assume the fit results are valid. The errors of the individual parameters R, Q, α and β are low (average of errors 0.663%, highest error 5.173%), so they are not graphically shown in Fig. 7–9.
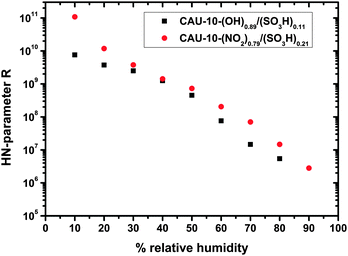 | ||
| Fig. 7 Dependence of the HN-parameter R on the relative humidity for the samples CAU-10-O/S and CAU-10-N/S. | ||
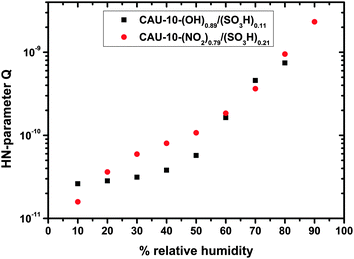 | ||
| Fig. 8 Dependence of the HN-parameter Q on the relative humidity for the samples CAU-10-O/S and CAU-10-N/S. | ||
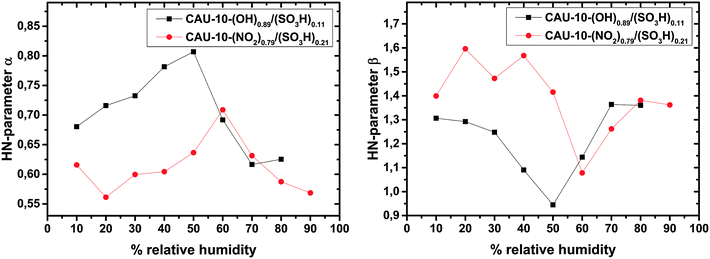 | ||
| Fig. 9 Dependence of the HN-parameters α (left) and β (right) on the relative humidity for the samples CAU-10-O/S and CAU-10-N/S. | ||
Applying the HN-model to all wide frequency range data sets yields the parameters R, Q, α and β of the MOFs for humidity between 10% and 90% r.h. As can be seen from Fig. 7 the resistance R decreases approximately exponentially with increasing humidity. This relation holds better for CAU-10-N/S, whereas CAU-10-O/S still shows a slight curvature in the logarithmic plot.
Sakai et al. reported on resistive-type humidity sensors consisting of a microporous matrix impregnated with a hydrophilic polymer containing a sulfonate function. The shape of the logarithmic impedance vs. humidity graph varied with the degree of sulfonation. It changes from convex for low sulfonation over linear to concave for high sulfonation.22 This is in good agreement with our results that show a more convex form for CAU-10-O/S, which has a two times lower sulfonate content than the CAU-10-N/S sample. Even though the two samples are different from each other with respect to their additional functionalities, this may be an indication of the special impact of the sulfonate group due to its high polarity.
The conductivity in “dry” conditions is determined from the parameter R at 10% r.h. (Fig. 7. at 0% r.h. no distinct plateau is observed, and the data cannot be fitted by this model). Taking the geometrical factors into account conductivities of 4.870 × 10⁻¹³ S cm−1 for CAU-10-N/S and 6.922 × 10⁻¹² S cm−1 for the CAU-10-O/S sample are obtained. Extrapolation of the R/r.h. plot to 0% r.h. delivers values which are smaller by up to one order of magnitude.
So far no other conductivity investigations for this particular kind of MOF can be found in the literature. However, comparison of the conductivity of our samples to other MOFs reveals that it is lower by several orders of magnitude. For example, Koboyashi et al. determined a value of 10−8 S cm−1 for Cu[Ni(pdt)2] (pdt2− = pyrazine-2,3-dithiolate).23 Talin et al. modified the conductivity of Cu3-(BTC)2 (also known as HKUST-1; BTC, benzene-1,3,5-tricarboxylic acid) by infiltrating a guest molecule into the pores, which resulted in ohmic conductivities around 10−2 S cm−1 for an otherwise insulating MOF. The charge transport is explained by the interaction of the TCNQ guest molecule with the accessible metal sites.24
The CPE parameter Q shows a behavior similar to that of R, but in the opposite direction, i.e. it increases with humidity (Fig. 8). For CAU-10-N/S the trend is approximately exponential, whereas for CAU-10-O/S the increase is a bit stronger (as opposed to the behavior which the samples show in the water sorption measurements). However, correlation of Q with the parameter R confirms that they are widely linearly independent (−0.51 for CAU-10-O/S, −0.25 for CAU-10-N/S). Therefore the selected model is not over-determined. Compared to the capacitance determined without the HN-model, the parameter Q approaches a more linear shape in the logarithmic plot, i.e. shows an exponential humidity dependence. Liu et al. specify a linear response of capacitance to changes in relative humidity for Cu-BTC, but this only applies to the special case of high frequencies (1 MHz). In principle, the dependence in that study seems to be rather exponential, as is apparent from their SI; frequency spectra to obtain more details are not shown.25
Taking a closer look at CAU-10-N/S, a nearly linear trend in water sorption measurements at a relative pressure between 0.1 and 0.8 is apparent, which is accompanied by an exponential trend in capacitance in the same range. This may be explained by a spatial dependence of the water permittivity. In the vicinity of the pore walls water molecules are more strongly attached to the surface groups, which reduces their permittivity. Paul and Paddison calculated the influence in hydrated, sulfonic acid-decorated micropores of various polymers finding a steep reduction of the permittivity. For pore wall distances smaller than ca. 0.8–0.9 nm it starts to drop from values of ca. 80 (bulk permittivity) to ca. 10.26 Taking into account that pore filling starts at the pore walls, an overlap of adsorption curve and permittivity curve may be a reason for the resulting exponential-like dependence of Q (capacitance).
The humidity dependence of the HN parameters α and β is shown in Fig. 9. For both samples the parameters are clearly correlated to each other with a Pearson product-moment correlation coefficients (PPMCC) of −0.87 for the CAU-10-O/S and −0.78 for the CAU-10-N/S sample. This may be attributable to the fact that fitting of left-skewed arcs (compare Fig. 6) requires values of β > 1 and therefore very close to the constraint β < 1/α. Both samples show qualitatively nearly the same trend, but the parameters for CAU-10-N/S deviate more strongly from 1 than those of CAU-10-O/S. This indicates a broader relaxation time distribution and/or further involved processes. It cannot be clearly determined whether this is due to the higher sulfonate content of CAU-10-N/S or due to the stronger influence of the NO2 residual group, or a combination of both effects.
In the low humidity region the trends of α and β show a narrowing of the relaxation time distribution with increasing humidity. At 50% or 60% r.h., depending on the sample, the trend develops in the opposite direction, which suggests a gradual change in conduction mechanisms. Hurd et al. reported on the conductivity change of β-PCMOF2 with dehydration. They compared their findings to the loss of proton conduction in sulfonated ionomers, because water is crucial for the Grotthus as well as for the vehicle mechanisms.16 We suggest that the critical H2O concentration for the samples investigated can be read from maxima and minima in parameters α and β, respectively.
Application test
To estimate the application potential in humidity sensing, CAU-10-N/S was further investigated in an ambient air control scenario for ca. 60 hours. CAU-10-N/S was chosen because it showed a more linear trend in the HN parameters R and Q than CAU-10-O/S.In contrast to the comprehensive analysis presented in the previous section, the aim of these application tests is to check if the data from shorter measurement cycles (and thereby higher frequencies) is sufficient for a sensing device in practice. Therefore a frequency range between 1 Hz and 30 MHz (Fig. 3, setup b) and only basic data evaluation (compare eqn (1) in ref. 12) was chosen. The sample holder was placed in a ceramic tube (length 20 cm) in the middle of a room, to avoid any potential influence of direct air flow close to the material. Additionally, a conventional temperature and humidity sensor was placed in the same tube as a reference (Sensirion SHT21).
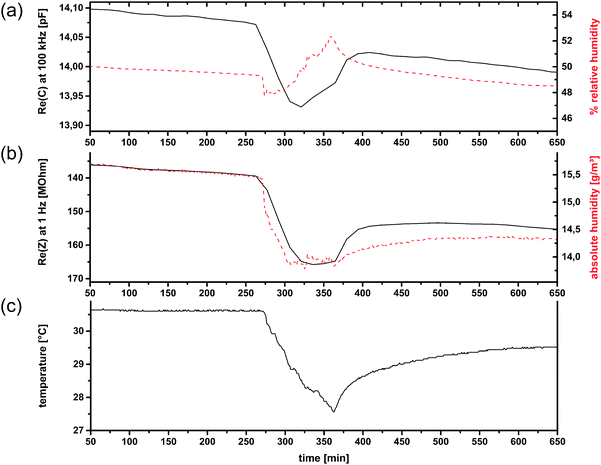
For test no. 1, which was partially already presented in ref. 12, one room window was kept slightly opened during the whole measurement to obtain a weak interchange between indoor and outdoor air. The trend of relative humidity is similar, but not equal to that of absolute humidity (a.h.), because of variations in the temperature (Fig. 10c). Among the number of possible electrical quantities, Re(Z) as well as Re(C) correspond the best with the measured humidity at first view. At points where one quantity differs from the reference measurements, the other can be utilized (Fig. 10). To obtain general statements for the correlation of humidity and electrical quantities the Pearson product-moment correlation coefficients (PPMCC) were calculated at several frequencies (1 Hz, 10 Hz, 103 Hz, 104 Hz, 105 Hz). The results can be summarized by the following statements: (i) Re(C) correlates better with relative humidity than with absolute humidity values; (ii) Re(Z) correlates better with absolute humidity than with relative humidity values; (iii) absolute humidity correlations for both quantities are better at low frequencies; (iv) relative humidity correlations for both quantities are better at high frequencies. The correlation coefficients of Re(Z) are negative and only considered as absolute values and the first two statements are stronger than the last ones, i.e. their influence on the correlation coefficient is almost 1 order of magnitude larger.
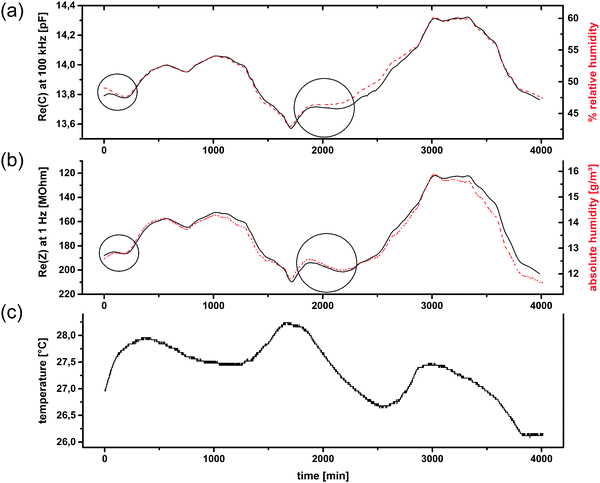 | ||
| Fig. 10 Application test no. 1 for CAU-10-N/S. Re(C) at 100 kHz compared to relative humidity (a); Re(Z) at 1 Hz (reversed scale) compared to absolute humidity (b); and temperature (c); (humidity measurands in dashed lines). (a and c are already shown in ref. 12). | ||
The correlation between Re(C) and relative humidity was expected, since many commercially available sensors are based on this principle. Water with its high electrical permittivity changes the capacitance of a porous material proportionally to its amount adsorbed in the pores. This amount mainly depends on the relative humidity. The temperature dependence of this adsorption is only weak in the temperature range in which sensors are typically operated. However, in the intervals 0–100 min and 1900–2200 min the Re(Z) correlates better with the absolute humidity a.h. (Fig. 10). A more detailed analysis of the temperature reveals that these two time intervals show the strongest temperature change (+0.00661 °C min−1 and −0.00273 °C min−1, respectively). This suggests that non-equilibrium conditions account for the effect. A potentially higher heat capacity of the MOF material would be insufficient as the only explanation, as it would act in the opposite direction for opposite temperature changes, which is not the case (not shown).
The impedance, in contrast to the capacitance, depends not only on the amount of water adsorbed, but mainly on the bonding properties of water molecules to the surface and between water clusters and layers themselves. Percolation effects or changes in mechanism as mentioned in the previous section may play a role.
The sensor response to drastic atmospheric changes was further analyzed in test no. 2. In this case both the temperature and the humidity in the room were approximately kept constant for 270 min, followed by opening a window for 30 minutes. Fig. 11(c) shows that the temperature drops until t = 360 min at a rate of −0.0457 °C min−1 during the first few minutes. The humidity trends shown on the right scales in Fig. 11(a) and (b) change soon after the window is closed at t = 300 min. The electrical quantities (left scale in Fig. 11(a) and (b)) reveal a weak correlation with relative humidity. A better correlation is observed for the absolute humidity, especially that in the case of Re(Z), which is in good agreement with the results from test no. 1.
Conclusion
CAU-10-type MOF materials with different linker molecules were investigated with respect to their electrical and dielectrical response to humidity. Frequency ranges down to 1–10 mHz are necessary for a comprehensive analysis of this kind of material. Data fitting is accomplished by the Havriliak–Negami (HN) model, which is not over-determined. It is worth mentioning that the HN parameter β is only restricted by the expression β < 1/α. Values of β > 1 are necessary to fit arcs with left shifted maxima in Nyquist plots.The DC resistance (represented by the HN parameter R) under dry conditions is significantly higher than for other reported types of MOFs. It decreases approximately exponentially with increasing humidity. The deviation from this relation may be correlated with the sulfonic acid content. R shows high sensitivity with responses up to 5 orders of magnitude over the whole humidity range.
The exponential humidity dependence of the HN parameter Q in comparison to a linear trend of the water sorption isotherms is explained by an overlap of the adsorption curve with the variation of the water permittivity near the pore wall. The HN-parameters α and β are correlated to each other to some extent and may be indicators for a change in conduction mechanism along the pore channels caused by hydration/dehydration of the sample.
Due to their thermal stability the investigated MOF materials exhibit the potential for high temperature applications. It is shown that frequencies larger than 1 Hz and basic data evaluation are sufficient for a sensing device in an ambient air control scenario. The samples already exhibit distinct responses even for small changes in conditions, although the reaction is relatively slow. Besides the expected correlation of electrical measurement parameters to relative humidity, a good correlation of Re(Z) to absolute humidity is also observed in intervals, with the strongest relative change in temperature. We suggest that non-equilibrium conditions and maybe percolation effects account for this correlation.
Author contributions
The manuscript was written through contributions of all authors. All authors have given approval to the final version of the manuscript.Acknowledgements
We acknowledge the financial support by the German Federal Ministry of Education and Research (BMBF, grant no. 13N12969) and the support of the project executing organization (VDI Technologiezentrum GmbH, Düsseldorf). This work was supported by the DFG (SPP 1362).References
- I. Senkovska and S. Kaskel, Ultrahigh porosity in mesoporous MOFs: promises and limitations, Chem. Commun., 2014, 50, 7089–7098 RSC
.
- S. Pramanik, C. Zheng, X. Zhang, T. J. Emge and J. Li, New Microporous Metal–Organic Framework Demonstrating Unique Selectivity for Detection of High Explosives and Aromatic Compounds, J. Am. Chem. Soc., 2011, 133, 4153–4155 CrossRef CAS PubMed
.
- Z. Dou, J. Yu, Y. Cui, Y. Yang, Z. Wang, D. Yang and G. Qian, Luminescent Metal–Organic Framework Films as Highly Sensitive and Fast-Response Oxygen Sensors, J. Am. Chem. Soc., 2014, 136, 5527–5530 CrossRef CAS PubMed
.
- L. Schlechte, B. Wehring, N. Klein, H. Beese, W. Grählert, S. Kaskel, Metal–Organic Frameworks as Humidity Sensor. Proceedings of the 17th ITG/GMA symposium on sensors and measurement systems, Nuremberg, 3–4 June 2014, VDE Verlag GMBH: Berlin Offenbach, Germany, 2014.
- S. T. Meek, J. A. Greathouse and M. D. Allendorf, Metal–Organic Frameworks: A Rapidly Growing Class of Versatile Nanoporous Materials, Adv. Mater., 2011, 23, 249–267 CrossRef CAS PubMed
.
- M. D. Allendorf, R. J. T. Houk, L. Andruszkiewicz, A. A. Talin, J. Pikarsky, A. Choudhury, K. A. Gall and P. J. Hesketh, Stress-Induced Chemical Detection Using Flexible Metal–Organic Frameworks, J. Am. Chem. Soc., 2008, 130, 14404–14405 CrossRef CAS PubMed
.
- S. Achmann, G. Hagen, J. Kita, I. M. Malkowsky, C. Kiener and R. Moos, Metal–Organic Frameworks for Sensing Applications in the Gas Phase, Sensors, 2009, 9, 1574–1589 CrossRef CAS PubMed
.
- Y. Zhang, Y. Chen, Y. Zhang, H. Cong, B. Fu, S. Wen and S. Ruan, A novel humidity sensor based on NH2-MIL-125(Ti) metal organic framework with high responsiveness, J. Nanopart. Res., 2013, 15, 2014 CrossRef
.
- Michell Instruments. Data Sheet H6000 capacitive humidity sensor, http://www.michell.com, downloaded 11 Feb, 2015.
- N. Reimer, B. Bueken, S. Leubner, C. Seidler, M. Wark, D. De Vos and N. Stock, Three series of sulfonic acid functionalized mixed-linker CAU-10 analogues: sorption properties, proton conductivity and catalytic activity, Chem. – Eur. J. DOI:10.1002/chem.201501502
.
- T. Wagner, S. Krotzky, A. Weiß, T. Sauerwald, C.-D. Kohl, J. Roggenbuck and M. Tiemann, A High Temperature Capacitive Humidity Sensor Based on Mesoporous Silica, Sensors, 2011, 11, 3135–3144 CrossRef CAS PubMed
.
- A. Weiss, N. Reimer, N. Stock, M. Tiemann and T. Wagner, Screening of Mixed-linker CAU-10 MOF Materials for Humidity Sensing by Impedance Spectroscopy, Microporous Mesoporous Mater., 2015 Search PubMed
, submitted.
- H. Reinsch, M. A. van der Veen, B. Gil, B. Marszalek, T. Verbiest, D. de Vos and N. Stock, Structures, Sorption Characteristics, and Nonlinear Optical Properties of a New Series of Highly Stable Aluminum MOFs, Chem. Mater., 2012, 25, 17–26 CrossRef
.
- K. S. W. Sing, D. H. Everett, R. A. W. Haul, L. Moscou, R. A. Perotti, J. Rouquerol and T. Siemieniewska, Reporting Physisorption Data for Gas/Solid Systems with Special Reference to the Determination of Surface Area and Porosity. Recommendations of IUPAC Commission on Colloid and Surface Chemistry Including Catalysis, Pure Appl. Chem., 1985, 57, 603–619 CrossRef CAS
.
- J. Canivet, J. Bonnefoy, C. Daniel, A. Legrand, B. Coasne and D. Farrusseng, Structure–property relationships of water adsorption in metal–organic frameworks, New J. Chem., 2014, 38, 3102 RSC
.
- J. A. Hurd, R. Vaidhyanathan, V. Thangadurai, C. L. Ratcliffe, I. L. Moudrakovski and G. K. H. Shimizu, Anhydrous proton conduction at 150 °C in
a crystalline metal–organic framework, Nat. Chem., 2009, 1, 705–710 CrossRef CAS PubMed
.
-
E. Barsoukov and J. R. Macdonald, Impedance Spectroscopy, Theory, Experiment, and Application, Wiley-Interscience, Hoboken, U.S.A, 2nd edn, 2005 Search PubMed
.
- S. Havriliak and S. Negami, A Complex Plane Analysis of α-Dispersions in some Polymer Systems, J. Polym. Sci., Part C: Polym. Symp., 1966, 14, 99–117 CrossRef PubMed
.
- D. W. Davidson and R. H. Cole, Dielectric Relaxation in Glycerol, Propylene Glycol, and n-Propanol, J. Chem. Phys., 1951, 19, 1484–1490 CrossRef CAS PubMed
.
- F. Alvarez, A. Alegria and J. Colmenero, Relationship between the time-domain Kohlrausch–Williams–Watts and frequency-domain Havriliak–Negami relaxation functions, Phys. Rev. B: Condens. Matter Mater. Phys., 1991, 44, 7306–7312 CrossRef
.
- K. Weron, Havriliak–Negami Response in the Framework of the continuous-time random walk, Acta Phys. Pol., B, 2005, 36, 1855–1868 CAS
.
- Y. Sakai, Y. Sadaoka and M. Matsuguchi, Humidity sensors based on polymer thin films, Sens. Actuators, B, 1996, 35–36, 85–90 CrossRef
.
- Y. Koboyashi, B. Jacobs, M. D. Allendorf and J. R. Long, Conductivity, Doping, and Redox Chemistry of a Microporous Dithiolene-Based Metal–Organic Framework, Chem. Mater., 2010, 22, 4120–4122 CrossRef
.
- A. A. Talin,
et al. Tunable Electrical Conductivity in Metal–Organic Framework Thin-Film Devices, Science, 2014, 343, 66 CrossRef CAS PubMed
.
- J. Liu, F. Sun, F. Zhang, Z. Wang, R. Zhang, C. Wang and S. Qiu,
In situ growth of continuous thin metal–organic framework film for capacitive humidity sensing, J. Mater. Chem., 2011, 21, 3775 RSC
.
- R. Paul and S. J. Paddison, A statistical mechanical model for the calculation of the permittivity of water in hydrated polymer electrolyte membrane pores, J. Chem. Phys., 2011, 115, 7762 CrossRef PubMed
.
Footnote |
| † Electronic supplementary information (ESI) available. See DOI: 10.1039/c5cp01988e |
| This journal is © the Owner Societies 2015 |

