 Open Access Article
Creative Commons Attribution 3.0 Unported Licence
Post deposition annealing of epitaxial Ce1−xPrxO2−δ films grown on Si(111)
H.
Wilkens
a,
W.
Spieß
a,
M. H.
Zoellner
b,
G.
Niu
b,
T.
Schroeder
bc and
J.
Wollschläger
*a
aFachbereich Physik, Universität Osnabrück, Barbarastr. 7, D-49069 Osnabrück, Germany. E-mail: jwollsch@uos.de
bIHP, Im Technologiepark 25, D-15236 Frankfurt(Oder), Germany
cBTU Cottbus, Institute of Physics, Konrad-Zuse-Str. 1, D-03046 Cottbus, Germany
First published on 12th March 2015
Abstract
In this work the structural and morphological changes of Ce1−xPrxO2−δ (x = 0.20, 0.35 and 0.75) films grown on Si(111) due to post deposition annealing are investigated by low energy electron diffraction combined with a spot profile analysis. The surface of the oxide films exhibit mosaics with large terraces separated by monoatomic steps. It is shown that the Ce/Pr ratio and post deposition annealing temperature can be used to tune the mosaic spread, terrace size and step height of the grains. The morphological changes are accompanied by a phase transition from a fluorite type lattice to a bixbyite structure. Furthermore, at high PDA temperatures a silicate formation via a polycrystalline intermediate state is observed.
I. Introduction
Cerium based oxides are discussed in a variety of research fields, e.g. microelectronics,1–3 catalysis4–6 or solid state fuel cells.7–9 The chemical and physical requirements for the different applications vary and are strongly dependent on the oxygen vacancy concentration. For instance, on the one hand in most electronic applications perfect structures with sharp interfaces and almost no defects are required. On the other hand in catalytic applications the reactivity and selectivity are strongly dependent on the vacancy density at the near surface region. Thus, detailed knowledge of the surface structure and morphology is mandatory to build catalysts and electronic devices with optimized performance. Here, thin film systems offer the opportunity to study these properties in a highly controlled environment using surface science techniques.10–12 Here we use High Resolution Low Energy Electron Diffraction combined with Spot Profile Analysis (SPA-LEED) to characterize structural surface properties of mixed ceria-praseodymia thin films while their bulk properties has been studied before.13Recently, Zoellner et al.13 demonstrated that epitaxial Ce1−xPrxO2−δ films can be grown on Si(111) making model studies possible. They also revealed that for low and moderate praseodymium concentration a cubic fluorite based structure is preferred while high concentrations lead to a hexagonal crystal structure. Later on it was shown that the praseodymium concentration can be used to manipulate the redox16,17 as well as the magnetic18 properties of these films. For future applications a detailed analysis of the surface properties is necessary.
However, up to now no such study is available. Hence, in the following a post deposition annealing study addressing the surface structure and morphology of these films is presented.
II. Experimental setup
The Ce1−xPrxO2−δ(111) (x = 0–1) films are grown on Si(111) following the recipe described in ref. 13. Ultrathin praseodymia buffer layers are used to suppress oxidation of the silicon substrate. The crystalline quality as well as the Ce/Pr ratio of the three investigated samples are characterized by ex situ X-ray diffraction (XRD) and photoelectron spectroscopy (XPS), respectively. All films exhibit cubic structure and stoichiometries of Ce1−xPrxO2−δ with x = 0.20, 0.35 and 0.75 are determined (data not shown). Furthermore, X-ray reflection (XRR) revealed that the thickness of the films is ≈20–25 nm (data not shown). The cubic structure of the sample with the highest praseodymium content (x = 0.75) is in contrast to the previous growth study.13 We assume that the initial hexagonal structure changes into the cubic phase due to contact with atmospheric oxygen for an elongated time comparable to results reported for pure praseodymium oxide films.14,15For the post deposition annealing (PDA) studies the samples are transferred to an ultra high vacuum chamber (base pressure 10−10 mbar) equipped with a SPA-LEED instrument and a plasma chamber (base pressure 10−7 mbar). Prior to the PDA studies the samples are exposed to an oxygen plasma for 15 min to clean their surfaces and reduce the amount of oxygen vacancies. It has been shown that rare earth oxide films reach the highest degree of oxidation using this procedure.19,20 For this purpose an in situ microwave plasma source (2.45 GHz) is used with the plasma parameters of 80 sccm gas flow, 0.26 mbar oxygen pressure and 360 W power. Following the plasma cleaning the samples are subsequently annealed for 30 min at different temperatures using resistive heating. After each annealing step the samples are cooled to room temperature and electron diffraction measurements are performed. The temperature is controlled with an infrared pyrometer.
III. Results
A. LEED pattern
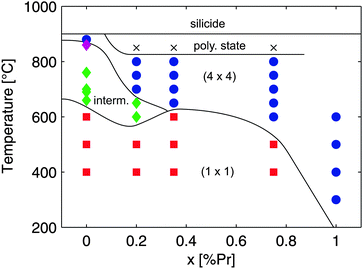
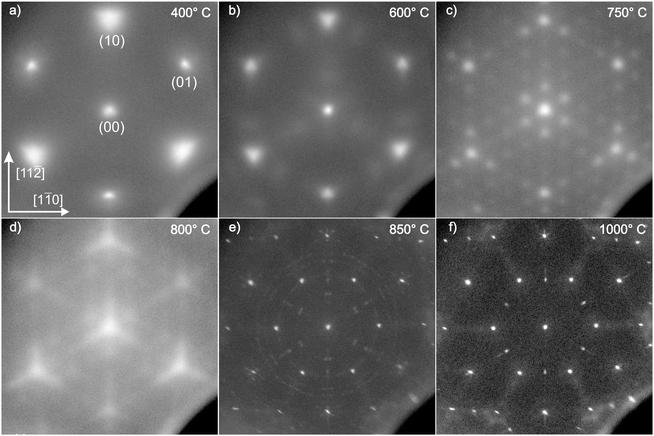
Fig. 1 shows the electron diffraction pattern of the appearing structures of the Ce0.80Pr0.20O2−δ(111)/Si(111) film after plasma cleaning. For the Ce0.65Pr0.35O2−δ and the Ce0.25Pr0.75O2−δ similar pattern are observed (data not shown). All cleaned samples exhibit a hexagonal (1 × 1) pattern with a threefold intensity distribution of the first order diffraction spots (cf.Fig. 1(a)) which is based on the ABC layer stacking sequence of the (111) oriented cubic fluorite structure.At higher PDA temperatures several superstructures appear (cf.Fig. 1 and 2) which can be attributed to ordered oxygen vacancies. The individual temperature necessary to stabilize the fully reduced bixbyite (4 × 4) surface structure shifts to lower values with increasing praseodymium concentration. This effect is based on the lowered activation energy for oxygen vacancy formation and is in good agreement with previous studies.16,21
 | ||
| Fig. 2 Surface phases against praseodymium content. The data of the pure cerium and praseodymium oxide phases are taken from ref. 24 and 33, respectively. Two ordered intermediate phases (Ce7O12 at 660 °C and Ce11O20 at 680 °C) can be found in pure cerium oxide films. The sample with the lowest Pr content shows also a weak superstructure (cf.Fig. 1(b)) and we assume a similar phase as observed for Ce7O12. Note, the data set of the pure cerium oxide films was obtained for a 250 nm film. Hence, the silicate formation at the surface may differ for thinner films. | ||
For the sample with low praseodymium content moderate temperatures (cf.Fig. 1(b)) result in a very weak superstructure which vanishes at higher PDA temperatures. Several intermediate bulk phases exist in the phase diagrams of ceria and praseodymia22 which can be stabilized in pure ceria thin film systems.23,24 Hence, we assume that this structure can be attributed to a reduced crystalline phase of the mixed oxide with low order. The samples with higher praseodymium content do not show this structure.
This fully reduced bixbyite structure dissolves if the temperature is increased to 800 °C (cf.Fig. 1(d)). In addition, streaks between the main diffraction spots become visible indicating a faceting of the surface.
At a PDA temperature of 850 °C a phase transition from the fully reduced oxide phase to a silicide phase begins (cf.Fig. 1(e)). The diffraction pattern consists of a sharp (1 × 1) structure superimposed with a strong  superstructure and is known for rare earth disilicides.25,26 Also several concentric rings emerge pointing to the formation of polycrystalline intermediate silicide structures. These structures are stable up to a PDA temperature of 1000 °C. Here, the intensity of the
  spots decreases and the polycrystalline rings vanish. In addition, a (2 × 1) pattern in combination with a very weak
  superstructure appears. The transition from the
  to the (2 × 1) pattern has also been observed in a previous study27 and was attributed to a complex surface structure. Note, these silicide transitions are independent of the Pr concentration and occur at the same temperature for all samples (cf.Fig. 2). Rather independent of composition of Ce1−xPrxO2−δ films on Si(111), it is found that the thermal stability under UHV annealing conditions is limited to temperatures below 850 °C. Therefore, the following SPA-LEED study covers only PDA steps up to 700 °C.
B. Spot profile analysis
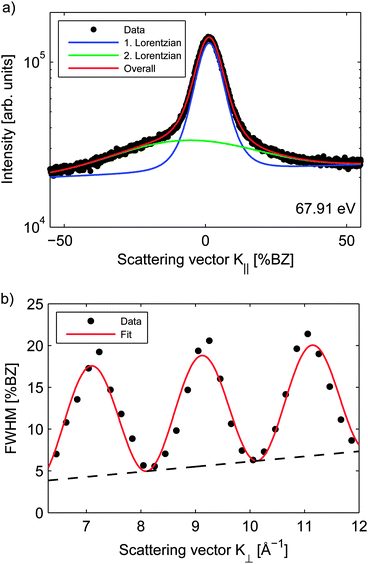
For each PDA step a detailed spot profile analysis of the specular (00) spot is performed to analyse the surface morphology. Cross-sections along the [11![[2 with combining macron]](https://www.rsc.org/images/entities/char_0032_0304.gif) ] direction are measured for different electron energies (∝K⊥2). In the following the lateral and vertical component of the scattering vector are denoted by K∥ and K⊥, respectively. For the oxide phases a sharp central peak with a broad shoulder is observed which both can be fitted with Lorentzian functions (cf.Fig. 3(a)). The shoulder is caused by surface facets28,29 and shifts laterally in k-space for different energies. The full width half maximum (FWHM) of the central peak oscillates with increasing K⊥ (cf.Fig. 3(b)) due to large terraces separated by single atomic steps. According to ref. 30 and 31 the oscillations can be described by
] direction are measured for different electron energies (∝K⊥2). In the following the lateral and vertical component of the scattering vector are denoted by K∥ and K⊥, respectively. For the oxide phases a sharp central peak with a broad shoulder is observed which both can be fitted with Lorentzian functions (cf.Fig. 3(a)). The shoulder is caused by surface facets28,29 and shifts laterally in k-space for different energies. The full width half maximum (FWHM) of the central peak oscillates with increasing K⊥ (cf.Fig. 3(b)) due to large terraces separated by single atomic steps. According to ref. 30 and 31 the oscillations can be described by | (1) |
 is necessary due to the isotropic exponentially decaying 2D correlation. Furthermore, a linear increasing offset of the FWHM can be observed due to a mosaic spread of the surface crystallites. The slope of the offset corresponds to the mean angle of the mosaic spread.
 | ||
Fig. 3 Spot profile analysis of the Ce0.65Pr0.35O2−δ sample after annealing at 400 °C for 30 min. (a) Cross section along the [11![[2 with combining macron]](https://www.rsc.org/images/entities/char_0032_0304.gif) ] direction. The central peak (blue) and the shoulder (green) are fitted with Lorentzian functions. (b) FWHM of the central peak against K⊥. The fit according to eqn (1) is in good agreement with the experimental data. ] direction. The central peak (blue) and the shoulder (green) are fitted with Lorentzian functions. (b) FWHM of the central peak against K⊥. The fit according to eqn (1) is in good agreement with the experimental data. | ||
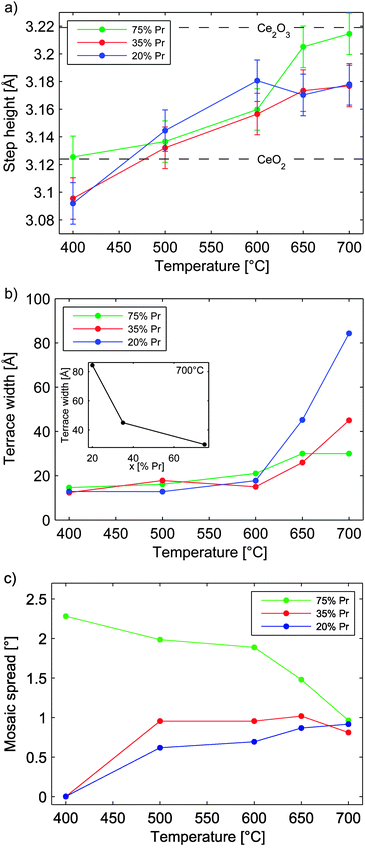
The results of the analysis are depicted in Fig. 4. For all samples the atomic step height gradually increases for higher PDA temperatures (cf.Fig. 4(a)). This behavior can be directly associated with the oxygen loss at the surface. The generation of oxygen vacancies results in the formation of Pr3+ and subsequently Ce3+ cations16 with larger ionic radii compared to Pr4+ and Ce4+, respectively, and thus in relaxation of the step edge atoms.
After growth for all samples the mean terrace width is ≈1.3 nm and stays stable until PDA temperatures above 600 °C are applied. Higher temperatures lead to a dramatic broadening of the terraces (cf.Fig. 4(b)). Here, a dependence on the praseodymium concentration can be found. The lower the concentration the larger terraces are observed. This effect is more clearly seen after PDA at 700 °C (cf.Fig. 4(b) inset).
Furthermore, the praseodymium concentration has a large impact on the mosaic spread (cf.Fig. 4(c)). Initially no mosaics are found for low and moderate praseodymium concentrations. In contrast, the sample with a high amount of praseodymium exhibits a large mosaic spread. We assume that the hex → cub transformation mentioned above is responsible for this effect since a similar increase of the mosaic spread can be observed for this transition in pure praseodymia films.32–34 With increasing PDA temperature the mosaic spread becomes larger for the samples with low and moderate praseodymium concentration while it decreases for the sample with high praseodymium concentration. All samples approach a final value of ≈0.9° for the mosaic spread.
For the silicide phases the shoulder vanishes from the Bragg peaks. Furthermore, the FWHM of the central peak shows no more oscillations indicating both a large average terrace size and a large step height distribution a large step height distribution (data not shown) making a spot profile analysis impossible.
IV. Discussion
The two dimensional diffraction pattern lead to two general conclusions. On the one hand it is shown that at least one intermediate phase with long ranged ordered oxygen vacancies exist. On the other hand a transition from a crystalline oxide state over a polycrystalline state to a crystalline silicide state is found. These findings lead to several questions addressing the phase diagram of the mixed oxides. For instance, do the intermediate phases match the known phases from the pure oxide phase diagrams? In addition, the rather complex transition to the silicide phase has to be elucidated in future studies.The spot profile analysis shows similarities to pure cerium and praseodymium oxide films grown on Si(111).32–34 The surfaces exhibit mosaics with terraces which are separated by monoatomic steps. However, the Ce/Pr ratio has a strong impact on the structure and morphology of the surfaces. A higher praseodymium content results in an increased oxygen loss at lower PDA temperatures which is in good agreement with the results of Zoellner et al.16 Thus, the Ce/Pr ratio can be used to manipulate the redox properties.
In addition, several effects on the surface morphology have to be considered. First of all the terrace size increases for higher PDA temperatures resulting in smoother surfaces on smaller scales. This effect differs from pure praseodymia films where the terrace size cannot be increased by annealing.33,34 The magnitude of the increment is directly related to the praseodymium concentration (cf.Fig. 4(b)).
In contrast, for low praseodymium content the mosaic spread of the surfaces increases with higher PDA temperatures resulting in strongly tilted crystallites and, therefore, a higher overall roughness. We assume that stress due to the expansion of the unit cell size is the reason for the formation of the mosaic spread at higher PDA temperatures.
The sample with the highest praseodymium concentration is an exception to this behavior. Here, a strong mosaic spread is observed which is lowered with increasing PDA temperatures. We assume that the initial hex → cub transformation due to the plasma treatment is the reason for this. The energy provided by the plasma is possibly not sufficient for a full rearrangement of the cation lattice through the entire film resulting in increased stress which is relieved by forming the mosaics. With increasing PDA temperature this transition is completed and the mosaic spread is lowered.
V. Summary
In this work the surface structure and morphology of epitaxial Ce1−xPrxO2−δ films are explored. It is revealed that the Ce/Pr ratio has a strong impact on the structure and morphology of the film and can be used to tune these properties for future applications. Furthermore, a complex transition to the silicide phase via a polycrystalline intermediate state is found.Acknowledgements
The authors thank the Deutsche Forschungsgemeinschaft (DFG) via grant no. WO533/16-1 and SCHR1123/4-1 for financial support.References
- A. G. Frangoul, K. B. Sundaram and P. F. Wahid, The fabrication of metal-oxide semiconductor transistors using cerium dioxide as a gate oxide material, J. Vac. Sci. Technol., B: Microelectron. Nanometer Struct.–Process., Meas., Phenom., 1991, 9, 181 CrossRef CAS.
- H. Wong, B. L. Yang, S. Dong, H. Iwai, K. Kakushima and P. Ahmet, Current conduction and stability of CeO2/La2O3 stacked gate dielectric, Appl. Phys. Lett., 2012, 101, 233507 CrossRef.
- E. Miranda, S. Kano, C. Dou, K. Kakushima, J. Suñè and H. Iwai, Nonlinear conductance quantization effects in CeOx/SiO2-based resistive switching devices, Appl. Phys. Lett., 2012, 101, 012910 CrossRef.
- A. Trovarelli, Catalytic Properties of Ceria and CeO2-Containing Materials, Catal. Rev.: Sci. Eng., 1996, 38, 439 CAS.
- A. F. Diwell, R. R. Rajaram, H. A. Shaw and T. J. Treux, The role of ceria in three-way catalysts in Catalysis Automotive Pollution Control, Elsevier, 1991, vol. 71 Search PubMed.
- G. A. Deluga, J. R. Salge, L. D. Schmidt and X. E. Verykios, Renewable Hydrogen from Ethanol by Autothermal Reforming, Science, 2004, 303, 993 CrossRef CAS PubMed.
- K. Mohan Kant, V. Esposito and N. Pryds, Strain induced ionic conductivity enhancement in epitaxial Ce0.9Gd0.1O2δ thin films, Appl. Phys. Lett., 2012, 100, 033105 CrossRef.
- Z.-P. Li, T. Mori, G. J. Auchterlonie, J. Zou and J. Drennan, Direct evidence of dopant segregation in Gd-doped ceria, Appl. Phys. Lett., 2011, 98, 093104 CrossRef.
- V. F. Solovyov, M. Gibert, T. Puig and X. Obradors, Size-dependent strain in epitaxial (001) gadolinium-doped ceria nanoislands, Appl. Phys. Lett., 2010, 97, 172503 CrossRef.
- T. Campbell, Ultrathin metal films and particles on oxide surfaces: structural, electronic and chemisorptive properties, Surf. Sci. Rep., 1997, 27, 1 CrossRef.
- R. Henry, Surface studies of supported model catalysts, Surf. Sci. Rep., 1998, 31, 231 CrossRef.
- M. Bäumer and H.-J. Freund, Metal deposits on well-ordered oxide films, Prog. Surf. Sci., 1999, 61, 127 CrossRef.
- M. H. Zoellner, P. Zaumseil, H. Wilkens, S. Gevers, J. Wollschläger, M. Bäumer, Y.-H. Xie, G. Niu and T. Schroeder, Stoichiometry structure correlation of epitaxial Ce1-xPrxO2-δ (x = 0-1) thin films on Si(111), J. Cryst. Growth, 2012, 355, 159–165 CrossRef CAS.
- T. Schroeder, P. Zaumseil, G. Weidner, Ch. Wenger, J. Dabrowski, H.-J. Müssig and P. Storck, On the epitaxy of twin-free cubic (111) praseodymium sesquioxide films on Si(111), J. Appl. Phys., 2006, 99(1), 014101 CrossRef.
- T. Weisemoeller, F. Bertram, S. Gevers, A. Greuling, C. Deiter, H. Tobergte, M. Neumann, A. Giussani, T. Schroeder and J. Wollschläger, Post deposition annealing induced transition from hexagonal Pr2O3 to cubic PrO2 films on Si(111), J. Appl. Phys., 2009, 105, 124108 CrossRef.
- M. H. Zoellner, G. Niu, J.-H. Jhang, A. Schaefer, P. Zaumseil, M. Bäumer and T. Schroeder, Temperature-Dependent Reduction of Epitaxial Ce1-xPrxO2-δ (x = 0-1) Thin Films on Si(111): A Combined Temperature-Programmed Desorption, X-ray Diffraction, X-ray Photoelectron Spectroscopy, and Raman Study, J. Phys. Chem. C, 2013, 117, 24851–24857 CAS.
- G. Niu, M. A. Schubert, F. d'Acapito, M. H. Zoellner, T. Schroeder and F. Boscherini, On the local electronic and atomic structure of Ce1-xPrxO2-δ epitaxial films on Si, J. Appl. Phys., 2014, 116, 123515 CrossRef.
- G. Niu, E. Hildebrandt, M. A. Schubert, F. Boscherini, M. H. Zoellner, L. Alff, D. Walczyk, P. Zaumseil, I. Costina, H. Wilkens and T. Schroeder, Oxygen Vacancy Induced Room Temperature Ferromagnetism in Pr-Doped CeO2 Thin Films on Silicon, ACS Appl. Mater. Interfaces, 2014, 6, 17496–17505 CAS.
- A. Schaefer, S. Gevers, V. Zielasek, T. Schroeder, J. Falta, J. Wollschläger and M. Bäumer, Photoemission study of praseodymia in its highest oxidation state: the necessity of in situ plasma treatment, J. Chem. Phys., 2011, 134, 054701 CrossRef CAS PubMed.
- S. Gevers, T. Weisemoeller, A. Schaefer, V. Zielasek, M. Bäumer and J. Wollschläger, Structure of oxygen-plasma-treated ultrathin praseodymia films on Si(111), Phys. Rev. B: Condens. Matter Mater. Phys., 2011, 83, 193408 CrossRef.
- Y. Tang, H. Zhang, L. Cui, C. Ouyang, S. Shi, W. Tang, H. Li, J.-S. Lee and L. Chen, First-Principles Investigation on Redox Properties of M-Doped CeO2 (M = Mn,Pr,Sn,Zr), Phys. Rev. B: Condens. Matter Mater. Phys., 2010, 82, 125104 CrossRef.
- G. Adachi and N. Imanaka, The Binary Rare Earth Oxides, Chem. Rev., 1998, 98, 1479–1514 CrossRef CAS.
- H. Wilkens, O. Schuckmann, R. Oelke, S. Gevers, A. Schaefer, M. Bäumer, M. H. Zoellner, T. Schroeder and J. Wollschläger, Stabilization of the ceria ι-phase (Ce7O12) surface on Si(111), Appl. Phys. Lett., 2013, 102, 111602 CrossRef.
- H. Wilkens, O. Schuckmann, R. Oelke, S. Gevers, M. Reichling, A. Schaefer, M. Bäumer, M. H. Zoellner, G. Niu, T. Schroeder and J. Wollschläger, Structural transitions of epitaxial ceria films on Si(111), Phys. Chem. Chem. Phys., 2013, 15, 18589–18599 RSC.
- L. Ming, L. Grill, M. G. Ramsey, F. P. Netzer and J. A. D. Matthew, Reactions of low coverages of Eu, Gd, Er and Pr on Si(111) - a search for 2D silicides, Surf. Sci., 1997, 375, 24–34 CrossRef CAS.
- I. Manke, H. J. Wen, A. Höhr, A. Bauer, M. Dähne-Prietsch and G. Kaindl, Formation of the CeSix/Si(111) interface, J. Vac. Sci. Technol., B: Microelectron. Nanometer Struct.–Process., Meas., Phenom., 1995, 13, 1657–1665 CrossRef CAS.
- L. Grill, M. G. Ramsey, J. A. D. Matthew and F. P. Netzer, Initial stages of praseodymium growth on Si(111): morphology and electronic structure, Surf. Sci., 1997, 380, 324–334 CrossRef CAS.
- M. Henzler, Capabilities of LEED for defect analysis, Surf. Rev. Lett., 1997, 4, 489 CrossRef CAS.
- M. Horn-von Hoegen, Growth of semiconductor layers studied by spot profile analysing low energy electron diffraction, Z. Kristallogr., 1999, 214, 684–721 CAS.
- T.-M. Lu and M. G. Lagally, Diffraction from surfaces with randomly distributed steps, Surf. Sci., 1982, 120, 47–66 CrossRef CAS.
- J. Wollschläger, Diffraction from surfaces with randomly distributed structural defects, Surf. Sci., 1995, 328, 325–336 CrossRef.
- H. Wilkens, J. Rodewald, S. Gevers, M. H. Zoellner, T. Schroeder and J. Wollschläger, Surface morphology of ultrathin hex-Pr2O3 films on Si(111), J. Phys. D: Appl. Phys., 2013, 46, 285306 CrossRef.
- S. Gevers, T. Weisemoeller, B. Zimmermann, F. Bertram, C. Deiter and J. Wollschläger, Structural phase transition of ultra thin PrO2 films on Si(111), J. Phys.: Condens. Matter, 2009, 21, 175408 CrossRef CAS PubMed.
- S. Gevers, T. Weisemoeller, B. Zimmermann, C. Deiter and J. Wollschläger, Structure and stability of cub-Pr2O3 films on Si(111) under post deposition annealing conditions, Phys. Status Solidi C, 2010, 7, 292–295 CrossRef CAS.
| This journal is © the Owner Societies 2015 |


