 Open Access Article
Creative Commons Attribution 3.0 Unported Licence
The role of surface oxygenated-species and adsorbed hydrogen in the oxygen reduction reaction (ORR) mechanism and product selectivity on Pd-based catalysts in acid media†
R.
Rahul
,
R. K.
Singh
,
B.
Bera
,
R.
Devivaraprasad
and
M.
Neergat
*
Department of Energy Science and Engineering, Indian Institute of Technology Bombay (IITB), Powai, Mumbai, 400076, India. E-mail: nmanoj@iitb.ac.in; Fax: +91 22 2576 4890; Tel: +91 22 2576 7893
First published on 13th May 2015
Abstract
Oxygen reduction reaction (ORR) is investigated on bulk PdO-based catalysts (oxides of Pd and Pd3Co) in oxygen-saturated 0.1 M HClO4 to establish the role of surface oxides and adsorbed hydrogen in the activity and product selectivity (H2O/H2O2). The initial voltammetric features suggest that the oxides are inactive toward ORR. The evolution of the ORR voltammograms and potential-dependent H2O2 generation features on the PdO catalyst suggest gradual and parallel in situ reduction of the bulk PdO phase below ∼0.4 V in the hydrogen underpotential deposition (Hupd) region; the reduction of the bulk PdO catalyst is confirmed from the X-ray photoelectron spectra (XPS) and X-ray diffraction (XRD) patterns. The potential-dependent H2O2 generation features originate due to the presence of surface oxides and adsorbed hydrogen; this is further confirmed using halide ions (Cl− and Br−) and peroxide as the external impurities.
1. Introduction
Oxygen reduction reaction (ORR) – a complex four-electron-transfer process across an electrode/electrolyte interface – has been investigated for several decades. With the advent of electrochemical energy storage and conversion devices, this reaction has become even more important since it constitutes the electrochemical process at the cathode.1 Thus, ORR has been investigated on Pt well-defined single-crystal surfaces and polycrystalline nanoparticles in both acidic and alkaline media.2–4 Oxygen gets reduced to water and peroxide as per the most accepted reaction mechanism proposed by Damjanovic et al.5 The two-electron reduction of oxygen to H2O2, parallel to the four-electron reduction to H2O, in a fuel cell decreases the cell voltage (the reversible redox potential of H2O2 is 0.7 V) because of the mixed potential. Moreover, the H2O2 that is generated can lead to reduced membrane durability.6,7 Therefore, peroxide generation features (using a rotating ring disk electrode (RRDE) technique) with Pt have gained significant attention in the recent years from both fundamental and technological viewpoints.8–14 The H2O2 generation features depend on the active site density of the electrode, catalyst layer thickness and the potential dependent ORR mechanism.13,14 Thus, Schneider et al. reported the dependence of H2O2 formation on active site density13 and Ruvinskiy et al. explained the trend in H2O2 formation with potential based on the two competing mechanisms of ORR operating parallel to each other.14The ORR activity is highly dependent on the surface cleanliness and it is affected by the adsorbed species or impurities.15–28 Effects of cations (Na+, K+, etc.), anions (ClO4−, bi-sulphate, etc.) and impurities (halides, phosphates, ammonium, CO, SO2, H2S, etc.) on ORR with platinum single-crystal and nanoparticle surfaces are well-documented in the literature.15–28 On precious metals, in the potential range of interest to ORR (∼0.0–1.0 V), the main adsorbates are the oxygenated-species and hydrogen. However, the effect of these in situ generated spectator species (Oads and OHads) and intermediates (O2ads, OOHads and H2O2ads) on ORR activity and product selectivity is not well-understood and only a few reports are available in the literature; Katsounaros et al. used a H2O2 redox reaction to establish the blocking mechanism.29,30 Otherwise, there is no way of externally introducing these species in an electrolyte media to adsorb on a catalyst surface.
Recently, due to the very high cost, stability and overpotential issues with Pt, several new catalyst formulations were investigated as possible alternatives to catalyze ORR.4,31 Among them, palladium-based catalysts are the most investigated systems.32–43 The electrochemical behavior of Pd in aqueous electrolyte is much more complex when compared to that of Pt, even though both have almost similar voltammetric features.38–40 The major differences noticed are the higher hydrogen sorption property and unique oxide formation/reduction behavior.38 The formation of pre-monolayer hydrous oxide has a significant role on the electrocatalytic property.38 Therefore, Pd presents unique potential-dependent H2O2 generation features parallel to the reduction of oxygen to water. Analysis of these features can provide insight into the role of in situ generated adsorbed species in ORR.
In this manuscript, we report on the use of PdO as a probe surface to investigate the role of surface-oxygenated species on ORR activity and product selectivity (H2O/H2O2). Fortunately, bulk Pd oxide reduction is slower than the reduction of oxygen to water and it extends to the hydrogen adsorption (Hads) region. It is confirmed that the unique ORR and peroxide evolution features with Pd is mostly associated with its higher affinity towards oxygen (in the higher potential region) and hydrogen (in the lower potential region). First, the chemical reduction of PdO in the electrochemical medium is convincingly established. The in situ reduction of bulk oxide along with parallel ORR allows deducing the role of surface oxides and the adsorbed hydrogen on ORR with Pd. The unique peroxide generation features are explained over the entire range of potential (0.0–1.0 V) relevant to ORR.
2. Experimental
2.1 Catalyst synthesis
Carbon-supported Pd and Pd3Co catalysts were synthesized using the procedure reported in the literature.44 The as-prepared Pd and Pd3Co catalysts were subjected to heat-treatment at 400 °C for 1 h in an oxygen-containing atmosphere (5% oxygen and 95% argon) to obtain palladium oxide-based catalysts.44 A brief summary of the catalyst synthesis and physical characterization is given in the ESI.† In the rest of the manuscript, the as-prepared, oxide (heat-treated in oxygen atmosphere), and electrochemically reduced catalysts are denoted as (ASP), (OXD) and (ERD), respectively.2.2 Electrochemical characterization
Catalyst ink and a thin-film electrode were prepared by following the procedure reported in the literature.8,45 The details of the catalyst ink and thin-film electrode preparation is mentioned in the ESI.† The electrochemical characterization was performed using a WaveDriver Bipotentiostat (WaveDriver 20, Bipotentiostat/Galvanostat system from Pine Instruments, USA, supported with AfterMath software installed in a Windows 7 operating system). The measurements were conducted in a standard three-electrode system at room temperature (25 °C) using an Ag/AgCl (sat. KCl) reference electrode and a Pt wire counter electrode. However, in the manuscript, all potentials are reported against the reversible hydrogen electrode (RHE). The Ag/AgCl electrode was calibrated against Pt electrode in 0.1 M HClO4 electrolyte at 25 °C and the conversion factor (from Ag/AgCl to the RHE potential scale) was +0.25 V. The ORR voltammograms and peroxide generation features of the oxide catalyst were recorded in an oxygen-saturated 0.1 M HClO4 electrolyte using a RRDE (Pine Instruments, USA) configuration. The electrode disk area was 0.196 cm2 and the ring area was 0.109 cm2. The working electrode was subjected to potential cycling from 1.05 to 0.05 V at a scan rate of 20 mV s−1 with 1600 rpm. The ring potential was held at 1.2 V; the collection efficiency of RRDE was 22%.8 To investigate the role of adsorbed impurities, voltammograms were recorded in 0.1 M HClO4 in the presence of 0.1 mM Cl−, 0.1 mM Br− ions and 4 mM H2O2.3. Results and discussion
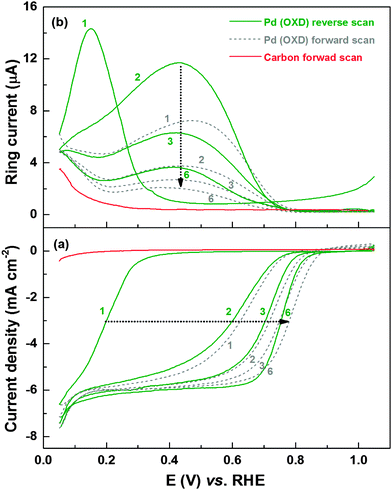
Fig. 1a shows the evolution of the ORR voltammograms of Pd (OXD) in oxygen-saturated 0.1 M HClO4 solution. Simultaneously recorded peroxide oxidation current (ring current) is shown in Fig. 1b. For comparison, the ORR voltammogram and the corresponding ring current of the carbon-support (Vulcan XC-72 without Pd) is also included. The initial reverse scan with Pd (OXD) (from 1.05 to 0.05 V) shows negligible ORR current and ring current down to ∼0.4 V; thus, the oxide catalyst is inactive toward ORR. Below 0.4 V, both these currents rise sharply. But, at potential below ∼0.15 V, the ring current decreases. In the first forward scan, the half-wave potential of ORR shifts to higher potential (∼0.6 V). The simultaneously recorded ring current decreases with potential up to 0.2 V, increases and reaches a peak maximum at ∼0.48 V and thereafter it decreases with potential till 0.8 V. At higher potentials both currents (ORR and H2O2 oxidation) are negligible. With further cycling, the half-wave potential of ORR gradually shifts to higher potentials and almost overlapping voltammograms are obtained by the fifth cycle. Concomitantly, the ring current decreases with cycling and stabilizes gradually. The final stable ORR voltammogram (with the mixed kinetic-diffusion region from 0.7 to 0.9 V and a well-defined diffusion-limited region below 0.7 V) and ring current features resemble that of the as-prepared Pd reported in the literature.46–49 The onset of ORR on carbon starts at ∼0.2 V and the ORR activity is negligible when compared to that of the carbon-supported Pd catalyst; but, there is a noticeable ring current at lower potentials. Therefore, the ring current between 0.05–0.2 V with the carbon-supported Pd-based catalysts is the sum of the contributions from carbon and the adsorbed-hydrogen interfering with ORR on Pd.2,8,9Similar ORR and ring current characteristics are observed with the Pd3Co (OXD) as well (Fig. S1, ESI†). The ring current maxima of ∼14 μA at 0.1–0.2 V are comparable with both the oxide catalysts. Thus, from the ORR voltammograms and ring current features, it is clear that the surface oxides greatly influence the ORR and its mechanism.
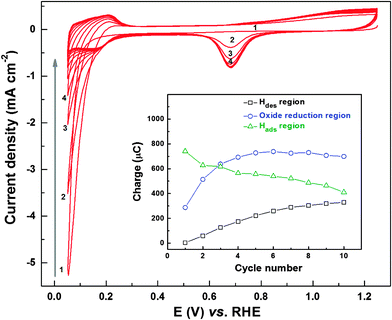
To understand the above-mentioned evolution of ORR voltammograms and ring current features, CVs of fresh Pd (OXD) catalyst were recorded in argon-saturated 0.1 M HClO4 solution (Fig. 2). These CVs of Pd (OXD) show features different from those of the as-prepared Pd catalyst (Fig. S2, ESI†). Initially, there is a high reduction current in the hydrogen underpotential deposition (Hupd) region, and the typical voltammetric features of the Pd metal in acid (hydrogen adsorption/desorption (Hads/des), the double layer, and Pd oxidation/reduction (Pdoxd/red) regions) are not well-developed. But with cycling, the reduction current in the Hupd region decreases sharply and Hdes peak builds-up gradually. The complete voltammetric features of metallic Pd are obtained in 6–8 cycles. The explanation for this behavior is reported in the literature and the complete reduction of the bulk oxide phase is caused by the adsorbed/evolved hydrogen at lower potentials in the Hupd region. Generally, the Pd/PdO redox features appear at a potential above ∼0.65 V; but with a bulk Pd (OXD) catalyst, the reduction seems to be slow and incomplete in the oxide reduction region.44 Recently, similar oxide reduction behavior of graphene oxide with potential cycling is also reported by Kar et al.; the decrease in the reduction charge was attributed to the removal of oxygenated species from the graphene oxide structure.50
Inset to Fig. 2 shows the evolution of the charge associated with Hdes, oxide reduction, and Hads regions during the potential cycling of Pd (OXD). The charge from the Hdes region increases systematically with cycling and it almost saturates after the eighth cycle. However, the charge from the oxide reduction region (∼0.6–0.9 V) increases in the first three cycles and stabilizes to a constant value (∼700 μC). On the other hand, the charge from the Hads region decreases with cycling. Thus, it can be interpreted that there are two types of reduction processes taking place with the oxide catalysts; one in the Pd/PdO redox potential range (0.6–0.9 V) and another below ∼0.4 V in the Hupd region.
Similar voltammetric features are also observed with the Pd3Co (OXD) catalyst (Fig. S3, ESI†); the only difference is that the charge (inset to Fig. S3, ESI†) due to Hads/des and Pdoxd/red is comparatively higher with Pd3Co (OXD) than that with Pd (OXD). From the CV features, it seems that the adsorbed/absorbed/evolved hydrogen is used for reduction of bulk PdO, which causes a gradual rise in Hdes charge.
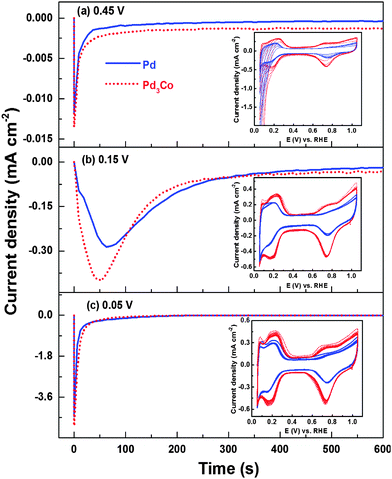
For a better understanding of the evolution of CVs and the charges from the three regions (Hads, Hdes and oxide reduction) on oxide catalysts during electrochemical cycling, the chronoamperometric responses are recorded at different potentials in 0.1 M HClO4 (Fig. 3). From the chronoamperometric responses (Fig. 3a) of Pd (OXD) and Pd3Co (OXD) at 0.45 V (i.e. outside the Hupd region of the voltammogram), the reduction charge observed is very low (when compared to that at lower potentials (Fig. 3b and c)). The subsequently recorded CVs are featureless initially resembling those of pure oxide catalysts (Fig. 2 and Fig. S3, ESI†). This indicates the incomplete reduction of Pd oxide during the chronoamperometric measurements at 0.45 V. The reduction of PdO happens gradually with the subsequent cycling to lower potential (0.05 V) and the proper voltammetric features of Pd in acid can only be observed after 5–6 cycles (inset to Fig. 3a). The chronoamperometric response recorded at 0.15 V (Fig. 3b) is broader and intense when compared to that at 0.45 V. Thus, holding the potential at 0.15 V results in faster reduction of Pd oxide. The subsequently recorded CVs (inset to Fig. 3b) show features similar to that of completely reduced palladium in acid electrolyte. Fig. 3c shows the chronoamperometric responses of Pd (OXD) and Pd3Co (OXD) at 0.05 V. The subsequently recorded CVs (inset to Fig. 3c) are comparable to that of the respective reduced catalyst. Completely developed Hupd, double layer, and Pdoxd/red regions are apparent in the CVs of both the catalysts. The sharp and intense chronoamperometric peak at 0.05 V suggests fast reduction of the PdO phase.
The reduction charge (8 mC), calculated from the chronoamperometric curves, at 0.15 V is comparable with both Pd (OXD) and Pd3Co (OXD) catalysts and it almost matches with the estimated charge required to reduce PdO (∼6 mC, assuming 2e− to reduce one PdO, for a typical PdO loading of ∼15 μg cm−2 on the disk electrode). The reduction charges at 0.05 V are 11.7 and 12 mC with Pd (OXD) and Pd3Co (OXD), respectively. This is because Pd tends to show a hydrogen evolution reaction (HER) at lower potentials51,52 and the reduction charge has contributions from both Pd oxide reduction and HER; the latter is not expected at a potential above 0.15 V. The reduction charge calculated from the chronoamperometric peaks at 0.45 V (0.36 mC) is negligible when compared to that obtained at 0.15 and 0.05 V. Thus, at 0.15 and 0.05 V complete reduction seems to happen and at 0.45 V the reduction is negligible. Thus, the initial large cathodic current (Fig. 2 and Fig. S3, ESI†) and the trends in the charges obtained from the Hdes, Hads, and oxide reduction regions of the CVs (inset to Fig. 2 and Fig. S3, ESI†) with both the oxide catalysts are attributed to the absorption/adsorption/evolution of hydrogen and the subsequent reduction of the bulk oxide in the potential range of 0.05–0.4 V.44
To test and establish the extension of oxide reduction to the Hupd region, CVs of carbon-supported Pd (ASP) were recorded in 0.1 M HClO4 solution from 0.05 V to different upper potentials (0.45 V to 1.65 V) (Fig. 4). The typical precious metal features (Hads/des (0–0.32 V); double layer (0.32–0.70 V) and Pdoxd/red (above 0.7 V)) can be observed from the CVs. Burke et al. investigated the interaction of Pd with oxygen in acidic and alkaline electrolyte and reported hydrous oxide growth, formation of species with a higher oxidation state (PdO2 and PdO3) and dissolution during potential cycling.38 The formation of pre-monolayer surface hydrous oxide species has a significant role in ORR activity and product selectivity, but, the exact nature and its influence on H2O2 formation is not well understood.38 However, in the case of PdO, the presence of bulk oxide species would significantly enhance the formation of the hydrous oxide and hence its effect is pronounced. The CVs with an upper potential limit of 0.45, 0.85, and 1.05 V show comparable Hads area. With further increase in the upper potential limit (1.25, 1.45, and 1.65 V), the Hads area increases (inset to Fig. 4). The oxide formation starts at ∼0.7 V, and with increase in the upper potential limit up to 1.3 V, there is a gradual increase in the corresponding current. This plateau in oxide formation region (1.1–1.3 V) corresponds to a monolayer oxide formation.53,54 Further increase in potential results in an exponential rise in oxide formation current. This high current is associated with multilayer oxide formation and the oxygen evolution reaction (OER) occurring on Pd.53,55,56 With increase in the upper potential limit of the CVs, there is a corresponding rise in oxide reduction current in the reverse scan and the reduction peak downshifts to lower potentials.38,53,54 With multi-layer oxide formation (above ∼1.2 V), the width of the double layer region (at potential below the oxide reduction peak) increases and it merges with the Hads region. Moreover, the Hads area increases with the upper potential limit of the CV on electrodes cycled to potential above 1.2 V. This indicates that the oxide reduction process can extend to lower potentials in the Hads region, similar to that observed with Pd (OXD) and Pd3Co (OXD) (Fig. 2 and Fig. S3, ESI†).
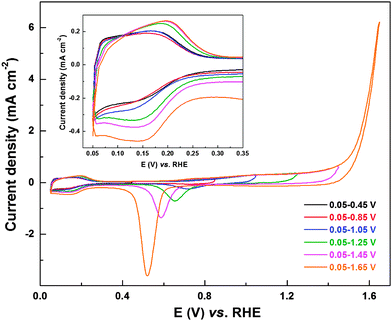 | ||
| Fig. 4 CVs of carbon-supported Pd (ASP) recorded in argon-saturated 0.1 M HClO4 at a scan rate of 20 mV s−1 with different upper potential limits; inset shows the magnified view of Hupd region. | ||
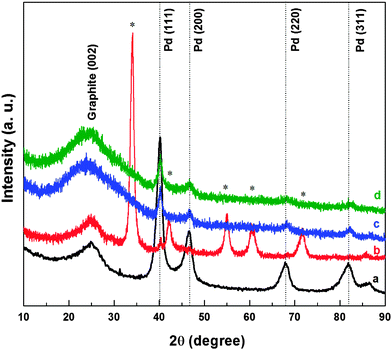
To confirm the reduction of oxides, XRD patterns of the samples were recorded after the electrochemical treatment. Fig. 5 shows the XRD patterns of carbon-supported Pd (ASP), Pd (OXD), Pd (ERD) and Pd3Co (ERD). The first broad peak at a 2θ value of ∼25° in all the XRD patterns is attributed to the graphite (002) peak of the Vulcan XC-72 carbon-support. The peaks at 40.2°, 46.7°, 68.3°, 82.6° are consistent with a face centred cubic (fcc) crystal structure of Pd corresponding to the (111), (200), (220), and (311) planes, respectively. The dotted lines indicate peak positions of standard Pd (JCPDS file No. 03-065-6174). The XRD pattern of Pd oxide matches with the standard PdO phase reported in the literature (JCPDS file No. 01-075-0584). The XRD patterns of oxide catalysts after exposure to electrochemical conditions show peaks corresponding to the fcc structure of palladium and those of the oxide phase are not apparent. Thus, it can be inferred that the bulk oxide reduction happens during the electrochemical process.
The reduction of Pd oxide in the electrochemical medium is further confirmed with X-ray photoelectron spectroscopy (XPS). Fig. 6 shows the Pd 3d core-level XPS spectra of carbon-supported Pd (ASP), Pd (OXD) and Pd (ERD) catalysts. The Pd 3d5/2 spin state of the Pd (ASP) catalyst can be deconvoluted into two peaks (Fig. 6a); the deconvolution is performed keeping the Pd 3d spin–orbit coupling constant at 5.2 eV. The peak at ∼335.6 eV can be assigned to the Pd0 valence state and that at ∼336.6 eV to Pd2+ (PdO). Similarly, the Pd 3d3/2 state of Pd (ASP) is also deconvoluted into two peaks with binding energies of ∼340.8 eV (Pd0) and ∼341.9 eV (Pd2+); these values match with those reported for metallic Pd and Pd2+ in the literature.49,57–59 The spectrum of Pd (OXD) is also fitted with two components for each spin state (Fig. 6b). The peak at ∼337.1 eV (Pd 3d5/2) is assigned to photoelectrons from the PdO phase and that at ∼337.8 eV from the PdO2 phase.60 The Pd 3d3/2 state of Pd (OXD) at ∼342.3 and ∼342.9 eV are assigned to the PdO and PdO2 phases, respectively.
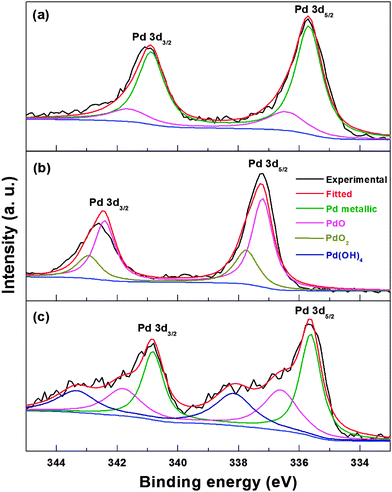 | ||
| Fig. 6 Pd 3d core-level XPS spectra of carbon-supported Pd (ASP) (a), Pd (OXD) (b), and Pd (ERD) (c). | ||
The Pd 3d peak position of PdO (Pd2+ binding energy) in the Pd (OXD) catalyst is shifted to higher value when compared to that of the Pd (ASP) (a shift of ∼0.5 eV with Pd2+ binding energy in Pd (OXD) with respect to Pd2+ in Pd (ASP)). This upshift in binding energy may be due to the difference in the nature of the PdO phase. The PdO in Pd (ASP) is in the hydrated form at the surface and that in Pd (OXD) is in the anhydrous bulk oxide form. Similar shift in binding energy of the bulk PdO phase relative to surface oxide is reported in the literature.61,62 From the XPS spectra, the oxide in Pd (OXD) is in the PdO phase (∼80%) and the remaining is PdO2 phase. The XPS spectrum of Pd (ERD) shows peaks corresponding to metallic Pd with a minor amount of PdO (Fig. 6c). It is reported in the literature that Pd forms a thin oxide layer on the surface at room temperature itself.63 Soon after the electrochemical reduction, when the Pd nanoparticles are exposed to atmospheric oxygen, a passive oxygen coverage is formed at the surface. The XPS spectrum of Pd (ERD) shows additional peaks at binding energies of ∼338.2 eV (Pd 3d5/2) and ∼343.4 eV (Pd 3d5/2) which are ∼0.4 eV higher than the PdO2 peaks observed in the Pd (OXD) samples. The binding energy of these additional peaks is attributed to the Pd(OH)4 phase; similar surface hydrated species are reported in the literature.57 These hydrated species generated in situ during the potential cycling of oxide catalysts in the electrochemical condition may be similar to that reported by Burke et al.38
Fig. S4 (ESI†) shows the O 1s core-level XPS spectra of Pd (OXD), Pd (ERD) and Pd (ASP). The binding energy of the Pd 3p3/2 falls in the range of ∼532.5 eV.57,59,62 The peak at ∼531 eV is attributed to the O2− bonded to the Pd atom. The as-prepared sample shows a minor peak at ∼531 eV which may be due to the surface oxide layer on Pd. With the electrochemically reduced sample, this peak is shifted to higher binding energy (∼531.5 eV). The peak at ∼534 eV is due to oxygen bonded to the carbon-support (COO group) and that at ∼535.6 eV is assigned to the water molecules adsorbed on the catalyst surface.
From the ORR voltammograms of oxide catalysts it can be inferred that the oxide surface is inactive and a reduced Pd surface is required for catalyzing the ORR. The in situ reduction of PdO happens parallel to the ORR and the surface coverage influences the product selectivity of the reaction; partially covered surface gives rise to higher generation of H2O2 during ORR. Most of the catalyst surface is reduced during the first reverse scan in the Hupd region and gradual reduction of the remaining oxides happens with potential cycling. Furthermore, the XPS result shows that along with the in situ reduction of oxide, the Pd(OH)4 phase is also formed on the catalyst surface; this may also contribute to the ORR product selectivity. For a better understanding of the above-mentioned phenomena, ring current features of the as-prepared and electrochemically reduced oxide catalysts (both Pd and Pd3Co) are compared with that of the well-studied platinum catalyst.
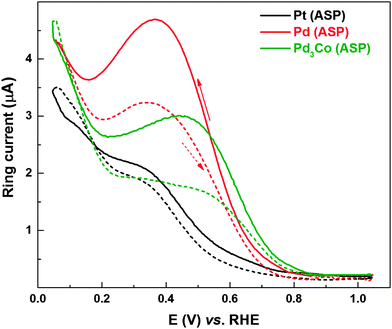
Fig. 7 shows the ring currents with Pd (ASP) and Pd3Co (ASP) catalysts subjected to electrochemical conditioning in oxygen-saturated 0.1 M HClO4; for comparison, ring current features of the as-prepared Pt is also included. On Pt, the ring current characteristics are similar to those reported in the literature.8–10,64–67 The peroxide generation features with Pt have been investigated by various groups. The ring current is quite negligible above 0.75 V and it gradually rises in the potential range of 0.65–0.35 V; and it further increases below 0.35 V. Ruvinskiy et al. explained the ring current trends by the dual path mechanism (the ‘series’ 2e− + 2e− reaction mechanism in which the adsorbed hydrogen peroxide (H2O2ads) species is a reaction intermediate operating parallel to the ‘direct’ 4e− reduction of oxygen to water).14 At a potential above ∼0.75 V, the ORR proceeds preferentially through the 4e− reduction. In the potential range of 0.75–0.35 V, the series mechanism involving the electrochemical reduction of HO2ads to form H2O2, a potential-activated step which accelerates towards lower potentials, is operating parallel to the direct dissociation mechanism.14 In the potential range of 0.3–0.05 V, as reported by Marković et al. and Schmidt et al., the rise in the ring current is attributed to active site-blocking by Hupd.2,8,9 However, from Fig. 1, it can be concluded that the carbon also contributes significantly to the ring current in the potential range of 0.05–0.2 V.
The overall ring current features of the other two catalysts (Pd and Pd3Co) are comparable to that of Pt, but the following major differences can be noticed. The highest ring current is observed with Pd and the ring current at 0.4 V (in the reverse scan) is in the order of Pd (ASP) > Pd3Co (ASP) > Pt. The hysteresis in the ring current of the catalysts is also in the same order. There is a distinguishable ring current maximum at ∼0.36 V and a minimum at ∼0.16 V with Pd-based catalysts. The order of ring current can be explained on the basis of the dependence of peroxide yield on active site density, catalyst layer thickness and adsorbed impurities on the surface. Schneider et al. reported the effect of active site density and catalyst layer thickness on the peroxide generation features.13 The probability of re-adsorption and subsequent reduction of peroxide increases with increase in active site density (catalyst loading/layer thickness), which in turn decreases the escape of H2O2 from the catalyst layer leading to lower ring current.13 Pd with a 5.1 nm particle size shows the highest ring current and Pd3Co (2.8 nm) and Pt (5 nm) show comparable ring currents (see Table S1, ESI†). With same loading (∼15 μg cm−2) of all the catalysts on the electrode, the active site density of Pd is twice that of Pt (the atomic weight of Pd and Pt is 105 and 195 g mol−1, respectively). With Pd3Co (∼2.8 nm), the active site density as well as the catalyst layer thickness will be even higher than that of Pd and Pt. Thus, the higher ring current with Pd in comparison with Pd3Co can be explained on the basis of lower active site density and catalyst layer thickness. Apart from these effects, the transition metal (Co) may also influence the peroxide generation features by changing the d-band electronic properties and therefore the specific activity of the catalyst. The higher ring current with Pd even with higher active site density and catalyst layer thickness in comparison with Pt, the ring current maxima at ∼0.36 V and minima at ∼0.16 V can be explained by invoking the existence of adsorbed surface impurities on Pd in the potential range of 0.2–0.7 V. In the case of Pd3Co, a minor shoulder peak can be observed at a potential of ∼0.45 V and the peak is not that well-defined unlike that with Pd. However, the voltammograms of both Pd and Pd3Co (Fig. S2, ESI†) show a flat double layer region (∼0.6–0.35 V); but, there is a sharper rise in their ring currents compared to that of Pt in the reverse scan. The ring currents are highest in the Hupd region; however, there is a sharp peak at 0.36 V with Pd and at 0.45 V with Pd3Co. Higher ring currents in the 0.30–0.45 V range on the Pd catalyst surface (Pt-Hupd ≈ Pd-Hupd < Pd3Co-Hupd) indicate the additional contribution to the peroxide formation by the surface blocking species in the reverse scan in addition to the Hupd. In the reverse scan of Pd, the ring current decreases somewhat below ∼0.36 V, reaches a minimum at ∼0.16 V, and increases further in the Hupd region below ∼0.16 V. The decrease in ring current (below 0.36 V in the reverse scan), which is noticeable in the case of Pd when compared to that of Pd3Co, is an indication of reduction of the blocking species (perhaps an oxide species or an adsorbed water molecule) in the Hupd region. It should also be noted that the Pd surface may have intrinsically different activity compared to that of Pt.
Ring current in the reverse scan (1.05–0.05 V) is significantly higher when compared to that in the forward scan (0.05–1.05 V). The difference between the ring currents in the forward and reverse scans (hysteresis) is more evident in the potential range of 0.2–0.70 V with Pd-based catalysts, whereas, with Pt the difference is minimal. This is ascribed to the strong hysteresis in the surface oxide formation/reduction with potential. The surface is partially covered by adsorbed-oxygenated species in the reverse scan, and a relatively oxide-free surface is available for oxygen reduction in the forward scan. Thus, blocking by the surface oxide is responsible for higher peroxide formation in the reverse scan.10 These oxides may get reduced at lower potentials in the Hupd region, and the reduced catalyst facilitates complete reduction of oxygen to water as there are lesser blocking species in the forward scan. The ring current features corresponding to the ORR voltammograms (Fig. S5, ESI†) of Pd (ERD) and Pd3Co (ERD) are comparable to that of the as-prepared catalysts discussed above.
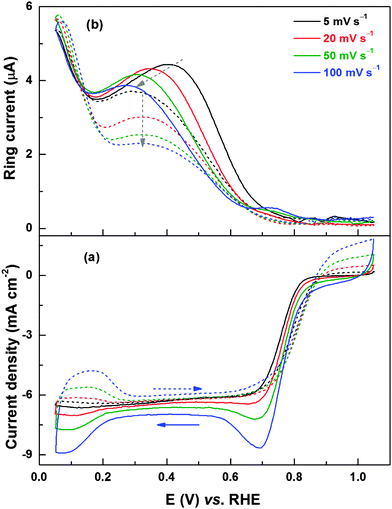
Fig. 8 shows the ORR voltammograms and the corresponding ring current responses of Pd (ERD) recorded at different scan rates with 1600 rpm. During the reverse scan, in the potential range of 0.2–0.7 V, the ring current maximum (Fig. 8b) decreases with increase in the scan rate and the peak position shifts to lower potentials. Since the change in limiting current below ∼0.6 V is negligible with scan rates, at a given rpm, the amount of H2O2 generated should be higher at lower scan rates; the H2O2 formed at the disk electrode gets more time to diffuse to the ring electrode. The shift in ring current maximum to lower potentials at higher scan rates is due to the slow reduction kinetics of the PdO to Pd (see Fig. 4). Thus, from the ring current features of Pd (OXD) and Pd (ERD) catalysts, it can be concluded that the surface oxide formation is the cause of higher peroxide generation in the potential range of 0.2 to 0.7 V. In the forward scan, the potential of the ring current maximum is almost independent of the scan rate for a reduced surface.
For a detailed understanding of peroxide generation characteristics of the Pd catalyst, the disk and ring currents are recorded at different rpms. The ORR limiting current increases with increase in rpm (Fig. S6a, ESI†) and this is due to the increase in the mass-transfer rate of O2 to the electrode surface and the consequent increase in the reduction of O2 to H2O and H2O2. A corresponding rise in ring current is observed with increase in rpm (Fig. S6b, ESI†). Other than increase in disk current and consequent ring current with rpm, there are no changes in the features of the ring current. In forward scan, the shift in the ring current maximum to higher potentials with decrease in rpm is attributed to the lower rate of oxide formation (lower extent of exposure to oxygen at lower rpm).
The electrochemical oxidation/reduction reaction of H2O2 can give further insight into the role of surface-adsorbed species in the mechanism of ORR.29 It can be used as a probe reaction to understand the nature of the surface and the effect of different contaminants.29 To establish the role of surface oxide on peroxide generation and the ORR mechanism, peroxide oxidation/reduction is carried out on Pt and Pd-based catalysts. The peroxide (4 mM H2O2) oxidation/reduction voltammograms recorded at a scan rate of 20 mV s−1 on Pt in argon-saturated 0.1 M HClO4 and that contaminated with 0.1 mM KCl and 0.1 mM KBr are shown in Fig. S7 (ESI†). The hysteresis in the forward and reverse scans is due to the surface oxidation/reduction that happens parallel to the H2O2 oxidation/reduction reaction. With the addition of Cl− ions to the electrolyte, the H2O2 oxidation/reduction characteristics changes considerably. Both the peroxide oxidation and reduction curves deviate from the ideal behavior that is observed with the pure electrolyte. There is no well-defined mass-transport limited region with peroxide reduction; the adsorption of Cl− ions on the Pt surface down-shifts the redox potential by ∼17 mV. Marked difference is observed with H2O2 oxidation/reduction characteristics in Br− ion-contaminated electrolyte. The H2O2 reduction current decreases significantly because of the stronger adsorption of Br− ions on Pt relative to that of Cl− ions. No mass-transfer-limited region is achieved with H2O2 reduction with the Br− ion-contaminated electrolyte; the redox potential is shifted to a lower value by ∼20 mV. The voltammetric features confirm that the strongly adsorbing anions alter the ideal behavior of H2O2 reduction as well as oxidation. Similar results have been shown by Katsounaros et al.30
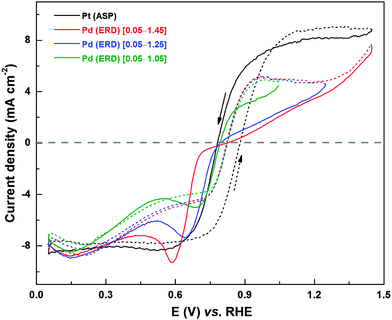
Fig. 9 shows comparison of H2O2 oxidation/reduction voltammograms of Pt/C and Pd (ERD) in 0.1 M HClO4 in the presence of 4 mM H2O2; the upper potential limits of the voltammogram with Pd (ERD) were set at 1.05, 1.25, and 1.45 V. In the reverse scan of H2O2 reduction, a sharp peak is observed at ∼0.62 V in the voltammogram with an upper potential limit of 1.05 V and this is due to the Pd oxide reduction. When the potential is taken to higher value (1.25 and 1.45 V), the Pd reduction peak in the reverse scan becomes intense and it shifts to lower potentials. The difference in the current between forward and reverse scans (hysteresis) in the voltammogram increases with the increase in the upper potential limit. Substantial difference in H2O2 oxidation/reduction features of the voltammogram can be observed on Pd (ERD) when compared to that of Pt. In the potential region of ∼0.76–0.33 V, the H2O2 reduction features on Pd (ERD) deviates largely from that of Pt. In the forward scan, a slight increase in reduction current is observed up to 0.2 V (Hupd) and this is due to the hydrogen adsorption interfering with the H2O2 adsorption and subsequent reduction. The H2O2 reduction current with Pd decreases up to a potential of ∼0.6 V, unlike that with Pt. It confirms that the deviation of the voltammetric behavior of the Pd surface from that of Pt is due to the contamination with adsorbed species.
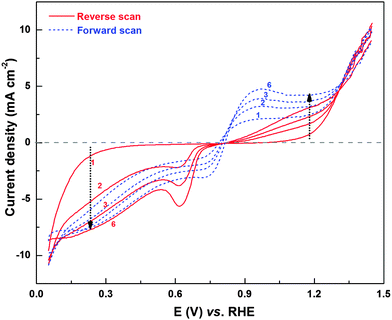
Fig. 10 shows the H2O2 oxidation/reduction voltammograms of the Pd (OXD) catalyst. Similar to that observed with ORR voltammogram (Fig. 1), here too, the voltammogram evolves with potential cycling, i.e., with the reduction of PdO. The H2O2 oxidation and reduction currents increase with cycling and overlapping voltammograms are obtained from the sixth cycle onwards. In the H2O2 oxidation region, both forward and reverse scans show increase in current with cycling, however, the oxygen evolution (OER) current above ∼1.3 V shows overlapping values. The evolution of H2O2 oxidation/reduction features further confirms the role of surface oxides and adsorbed-oxygenated species on ORR product selectivity.
4. Conclusions
Palladium oxide-based catalysts are used to elucidate the role of surface-adsorbed oxygenated-species and hydrogen on ORR and peroxide generation. Negligible ORR and ring currents in the initial reverse scan (from 1.05 to 0.05 V) down to ∼0.4 V suggest that the oxide catalyst is inactive. Upon cycling to the Hupd region, the oxide catalyst gets reduced. Half-wave potential of ORR shifts to a higher value and the ring current decreases due to gradual reduction of the oxide. The reduction of the bulk oxide to the Pd phase is slow enough to observe the trends in the ORR and ring current features with cycling. The reduction of the PdO phase is confirmed using chronoamperometry, voltammetry, XRD patterns and XPS. A maximum in the ring current at ∼0.36 V and a subsequent minimum at ∼0.16 V are attributed to the formation and removal of hydrated oxygenated species on Pd; the presence of this species is confirmed with XPS spectra. The scan rate dependent ring current features (shift in peroxide maxima) further support this conjecture. Increase in the ring current at a potential below 0.2 V in the reverse scan is due to contributions from the Hads and the carbon-support. Marked difference in the ring current features, observed in the forward and reverse scans, is attributed to the hysteresis in surface oxide formation/reduction during the potential cycling. The hysteresis in ring current features and the rise in ring current from 0.2 V in the forward scan suggest that Pd oxidation starts from the Hupd region. The order of ring current features of Pd, Pd3Co and Pt can be explained by the active site density and catalyst layer thickness. The H2O2 reduction/oxidation voltammogram (with 4 mM H2O2) recorded on Pd deviates from the diffusion-limited ideal behavior observed with Pt and the features on Pd resemble that of the halide ion-contaminated (Cl− or Br− ions) Pt surface. From these observations, it is clear that the surface of Pd is contaminated with a passive layer of oxide from the double-layer region itself and it influences the H2O2 generation characteristic during ORR to a great extent. The potential-dependent catalyst surface characteristics and changes need to be considered while explaining the reaction mechanism and product selectivity. Thus, it is demonstrated that the potential-dependent peroxide generation features can be used for the efficient in situ characterization of the catalyst surface and the same can be extended to other emerging ORR catalyst candidates. The analysis of these features can lead to a wealth of information on the catalyst surface and it helps design better ORR catalysts.Acknowledgements
Department of Science and Technology (DST), India, is acknowledged for financial support of the project through a grant SR/S1/PC–68/2012. Department of Physics and Department of Metallurgical Engineering and Material Science, both at IITB, are acknowledged for physical characterization of the samples.References
- I. Katsounaros, S. Cherevko, A. R. Zeradjanin and K. J. J. Mayrhofer, Angew. Chem., Int. Ed., 2014, 53, 102–121 CrossRef CAS PubMed.
- N. M. Marković, H. A. Gasteiger and P. N. Ross Jr., J. Phys. Chem., 1995, 99, 3411–3415 CrossRef.
- M. A. Gómez-Marín, R. Rizo and J. M. Feliu, Catal. Sci. Technol., 2014, 4, 1685–1698 Search PubMed.
- H. A. Gasteiger, S. S. Kocha, B. Sompalli and F. T. Wagner, Appl. Catal., B, 2005, 56, 9–35 CrossRef CAS PubMed.
- A. Damjanovic and V. Brusic, Electrochim. Acta, 1967, 12, 615–628 CrossRef CAS.
- V. A. Sethuraman, J. W. Weidner, A. T. Haug, M. Pemberton and L. V. Protsailo, Electrochim. Acta, 2009, 54, 5571–5582 CrossRef CAS PubMed.
- J. Qiao, M. Saito, K. Hayamizu and T. Okada, J. Electrochem. Soc., 2006, 153, A967–A974 CrossRef CAS PubMed.
- U. A. Paulus, T. J. Schmidt, H. A. Gasteiger and R. J. Behm, J. Electroanal. Chem., 2001, 495, 134–145 CrossRef CAS.
- T. J. Schmidt, U. A. Paulus, H. A. Gasteiger, N. Alonso-Vante and R. J. Behm, J. Electrochem. Soc., 2000, 147, 2620–2624 CrossRef CAS PubMed.
- M. Neergat, V. Gunasekar and R. K. Singh, J. Electrochem. Soc., 2011, 158, B1060–B1066 CrossRef CAS PubMed.
- T. J. Schmidt, V. Stamenkovic, P. N. Ross, Jr. and N. M. Markovic, Phys. Chem. Chem. Phys., 2003, 5, 400–406 RSC.
- N. Ramaswamy and S. Mukerjee, J. Phys. Chem. C, 2011, 115, 18015–18026 CAS.
- A. Schneider, L. Colmenares, Y. E. Seidel, Z. Jusys, B. Wickman, B. Kasemo and R. J. Behm, Phys. Chem. Chem. Phys., 2008, 10, 1931–1943 RSC.
- P. S. Ruvinskiy, A. Bonnefont, C. Pham-Huu and E. R. Savinova, Langmuir, 2011, 27, 9018–9027 CrossRef CAS PubMed.
- T. Okada, J. Dale, Y. Ayato, O. D. Asbjørnsen, M. Yuasa and I. Sekine, Langmuir, 1999, 15, 8490–8496 CrossRef CAS.
- J. Durst, M. Chatenet and F. Maillard, Phys. Chem. Chem. Phys., 2012, 14, 13000–13009 RSC.
- A. L. Ong, D. K. Whelligan, M. L. Fox and J. R. Varcoe, Phys. Chem. Chem. Phys., 2013, 15, 18992–19000 RSC.
- J. Omura, H. Yano, M. Watanabe and H. Uchida, Langmuir, 2011, 27, 6464–6470 CrossRef CAS PubMed.
- J. Omura, H. Yano, D. A. Tryk, M. Watanabe and H. Uchida, Langmuir, 2014, 30, 432–439 CrossRef CAS PubMed.
- D. V. Tripkovic, D. Strmcnik, D. van der Vliet, V. Stamenkovic and N. M. Markovic, Faraday Discuss., 2008, 140, 25–40 RSC.
- V. Stamenkovic, N. M. Markovic and P. N. Ross Jr., J. Electroanal. Chem., 2001, 500, 44–51 CrossRef CAS.
- T. J. Schmidt, U. A. Paulus, H. A. Gasteiger and R. J. Behm, J. Electroanal. Chem., 2001, 508, 41–47 CrossRef CAS.
- I. Katsounaros, J. C. Meier and K. J. J. Mayrhofer, Electrochim. Acta, 2013, 110, 790–795 CrossRef CAS PubMed.
- N. M. Marković, H. A. Gasteiger, B. N. Grgur and P. N. Ross, J. Electroanal. Chem., 1999, 467, 157–163 CrossRef.
- Q. He, X. Yang, W. Chen, S. Mukerjee, B. Koel and S. Chen, Phys. Chem. Chem. Phys., 2010, 12, 12544–12555 RSC.
- R. Halseid, M. Heinen, Z. Jusys and R. J. Behm, J. Power Sources, 2008, 176, 435–443 CrossRef CAS PubMed.
- V. Stamenkovic, B. N. Grgur, P. N. Ross and N. M. Markovic, J. Electrochem. Soc., 2005, 152, A277–A282 CrossRef CAS PubMed.
- B. D. Gould, O. A. Baturina and K. E. Swider-Lyons, J. Power Sources, 2009, 188, 89–95 CrossRef CAS PubMed.
- I. Katsounaros, W. B. Schneider, J. C. Meier, U. Benedikt, P. U. Biedermann, A. A. Auer and K. J. J. Mayrhofer, Phys. Chem. Chem. Phys., 2012, 14, 7384–7391 RSC.
- I. Katsounaros, W. B. Schneider, J. C. Meier, U. Benedikt, P. U. Biedermann, A. Cuesta, A. A. Auer and K. J. J. Mayrhofer, Phys. Chem. Chem. Phys., 2013, 15, 8058–8068 RSC.
- A. Brouzgou, S. Q. Song and P. Tsiakaras, Appl. Catal., B, 2012, 127, 371–388 CrossRef CAS PubMed.
- E. Antolini, Energy Environ. Sci., 2009, 2, 915–931 CAS.
- O. Savadogo, K. Lee, K. Oishi, S. Mitsushima, N. Kamiya and K.-I. Ota, Electrochem. Commun., 2004, 6, 105–109 CrossRef CAS PubMed.
- E. Antolini, ChemPlusChem, 2014, 79, 765–775 CrossRef CAS PubMed.
- N. Alexeyeva, A. Sarapuu, K. Tammeveski, F. J. Vidal-Iglesias, J. Solla-Gullón and J. M. Feliu, Electrochim. Acta, 2011, 56, 6702–6708 CrossRef CAS PubMed.
- K. R. Lee and S. I. Woo, Catal. Today, 2014, 232, 171–174 CrossRef CAS PubMed.
- Y. Liu and C. Xu, ChemSusChem, 2013, 6, 78–84 CrossRef CAS PubMed.
- L. D. Burke and J. K. Casey, J. Electrochem. Soc., 1993, 140, 1284–1291 CrossRef CAS PubMed.
- D. A. J. Rand and R. Woods, J. Electroanal. Chem. Interfacial Electrochem., 1973, 44, 83–89 CrossRef CAS.
- L. M. Vracar, D. B. Sepa and A. Damjanovic, J. Electrochem. Soc., 1989, 136, 1973–1977 CrossRef CAS PubMed.
- M. Arenz, V. Stamenkovic, T. J. Schmidt, K. Wandelt, P. N. Ross and N. M. Markovic, Surf. Sci., 2003, 523, 199–209 CrossRef CAS.
- T. J. Schmidt, N. M. Markovic, V. Stamenkovic and P. N. Ross, Jr., Langmuir, 2002, 18, 6969–6975 CrossRef CAS.
- C. M. Sánchez-Sánchez and A. J. Bard, Anal. Chem., 2009, 81, 8094–8100 CrossRef PubMed.
- R. Rahul, R. K. Singh and M. Neergat, J. Electroanal. Chem., 2014, 712, 223–229 CrossRef CAS PubMed.
- J. Schmidt, H. A. Gasteiger, G. D. Stäb, P. M. Urban, D. M. KoIb and R. J. Behm, J. Electrochem. Soc., 1998, 145, 2354–2358 CrossRef PubMed.
- H. Erikson, A. Kasikov, C. Johans, K. Kontturi, K. Tammeveski and A. Sarapuu, J. Electroanal. Chem., 2011, 652, 1–7 CrossRef CAS PubMed.
- B. Han and C. Xu, Int. J. Hydrogen Energy, 2014, 39, 18247–18255 CrossRef CAS PubMed.
- C. H. Choi, S. H. Park and S. I. Woo, Phys. Chem. Chem. Phys., 2012, 14, 6842–6848 RSC.
- R. K. Singh, R. Rahul and M. Neergat, Phys. Chem. Chem. Phys., 2013, 15, 13044–13051 RSC.
- T. Kar, R. Devivaraprasad, R. K. Singh, B. Bera and M. Neergat, RSC Adv., 2014, 4, 57781–57790 RSC.
- S. Bastide, C. Zlotea, M. Laurent, M. Latroche and C. Cachet-Vivier, J. Electroanal. Chem., 2013, 706, 33–39 CrossRef CAS PubMed.
- C. Cachet-Vivier, S. Bastide, M. Laurent, C. Zlotea and M. Latroche, Electrochim. Acta, 2012, 83, 133–139 CrossRef CAS PubMed.
- M. Grdeń, M. Łukaszewski, G. Jerkiewicz and A. Czerwiński, Electrochim. Acta, 2008, 53, 7583–7598 CrossRef PubMed.
- L. D. Burke and M. B. C. Roche, J. Electroanal. Chem., 1985, 186, 139–154 CrossRef CAS.
- V. I. Birss, M. Chan, T. Phan, P. Vanýsek and A. Zhang, J. Chem. Soc., Faraday Trans., 1996, 92, 4041–4047 RSC.
- A. Bolzan, M. E. Martins and A. J. Arvia, J. Electroanal. Chem., 1986, 207, 279–292 CrossRef CAS.
- T. L. Barr, J. Phys. Chem., 1978, 82, 1801–1810 CrossRef CAS.
- M. Brun, A. Berthet and J. C. Bertolini, J. Electron. Spectrosc. Relat. Phenom., 1999, 104, 55–60 CrossRef CAS.
- E. H. Voogt, A. J. M. Mens, O. L. J. Gijzeman and J. W. Geus, Surf. Sci., 1996, 350, 21–31 CrossRef CAS.
- A. L. Guimarães, L. C. Dieguez and M. Schmal, J. Phys. Chem. B, 2003, 107, 4311–4319 CrossRef.
- M. Peuckert, J. Phys. Chem., 1985, 89, 2481–2486 CrossRef CAS.
- G. Ketteler, D. F. Ogletree, H. Bluhm, H. Liu, E. L. D. Hebenstreit and M. Salmeron, J. Am. Chem. Soc., 2005, 127, 18269–18273 CrossRef CAS PubMed.
- G. Macfie, A. Cooper and M. F. Cardosi, Electrochim. Acta, 2011, 56, 8394–8402 CrossRef CAS PubMed.
- A. Racz, P. Bele, C. Cremers and U. Stimming, J. Appl. Electrochem., 2007, 37, 1455–1462 CrossRef CAS.
- L. Colmenares, Z. Jusys and R. J. Behm, Langmuir, 2006, 22, 10437–10445 CrossRef CAS PubMed.
- R. Devivaraprasad, R. Ramesh, N. Naresh, T. Kar, R. K. Singh and M. Neergat, Langmuir, 2014, 30, 8995–9006 CrossRef CAS PubMed.
- M. Neergat, V. Gunasekar and R. Rahul, J. Electroanal. Chem., 2011, 658, 25–32 CrossRef CAS PubMed.
Footnote |
| † Electronic supplementary information (ESI) available. See DOI: 10.1039/c5cp00692a |
| This journal is © the Owner Societies 2015 |

