
 Open Access Article
 This Open Access Article is licensed under a
 Creative Commons Attribution 3.0 Unported Licence
Thermally-induced chemical-order transitions in medium–large alloy nanoparticles predicted using a coarse-grained layer model
Micha
Polak
* and
Leonid
Rubinovich
Department of Chemistry, Ben-Gurion University of the Negev, Beer-Sheva 84105, Israel. E-mail: mpolak@bgu.ac.il
First published on 27th March 2015
Abstract
A new coarse-grained layer model (CGLM) for efficient computation of axially symmetric elemental equilibrium configurations in alloy nanoparticles (NPs) is introduced and applied to chemical-order transitions in Pt–Ir truncated octahedra (TOs) comprising up to tens of thousands of atoms. The model is based on adaptation of the free energy concentration expansion method (FCEM) using coordination-dependent bond-energy variations (CBEV) as input extracted from DFT-computed elemental bulk and surface energies. Thermally induced quite sharp transitions from low-T asymmetric quasi-Janus and quasi ball-and-cup configurations to symmetric multi-shells furnish unparalleled nanophase composite diagrams for 1289-, 2406- and 4033-atom NPs. At even higher temperatures entropic atomic mixing in the multi-shells gradually intensifies, as reflected in broad heat-capacity Schottky humps, which become sharper for much larger TOs (e.g., ∼10 nm, ∼30![[thin space (1/6-em)]](https://www.rsc.org/images/entities/char_2009.gif) 000 atoms), due to transformation to solid-solution-like cores.
000 atoms), due to transformation to solid-solution-like cores.
1. Introduction
In the extensive theoretical and experimental research devoted to alloy nanoparticles (NPs), considerable attention has been given recently to bi-metallic phase-separated (demixed) systems.1 Such binary NPs are used in heterogeneous catalysis, and can find applications in other fields of technology, e.g., in biomedical drug delivery using core–shell configurations. Platinum–iridium nanoparticles are used as catalysts in hydrogenation of organic molecules,2 oxygen reduction reactions,3etc. The temperature dependent chemical order (or “compositional structure”), namely, the equilibrium atomic distribution of the two elements among the different surface and core sites of the NP, affects considerably its physical and chemical properties.1Previous theoretical–computational studies of NPs with separation tendency dealt mainly with cases of considerable size mismatch (>10%) between atoms of the two elements. Thus, in Cu, Ni or Co alloyed with Ag, the formation of side-separated “Quasi-Janus” configurations was attributed to the near-surface elastic strain release using the Gupta potential and computational global optimization.4,5 According to this and other methodologies (e.g., thermodynamics of spherical NPs) the tendency to form low-T asymmetric vs. symmetric configurations can depend on the composition and the nanoparticle size, as predicted for a number of nanoalloy systems, such as Au–Pt,6 Cu–Ag,7–9 and Cu–Ni.10
Recently, atomic site-specific chemical order in fcc-based 201- and 586-atom Pt–Ir truncated-octahedron (TO) nanoparticles was studied11 by us using near-surface coordination-dependent bond-energy variations (CBEV)12 as input to the statistical–mechanical free-energy concentration expansion method (FCEM),13 which takes into account analytically short-range order. Thus, in this weakly miscible bi-metallic alloy having a relatively small atomic-size mismatch, axially-symmetric quasi-Janus configurations were found to be stabilized at low temperatures mainly due to CBEV-induced preferential strengthening of Pt-surface/Ir-subsurface bonds, and the greatly reduced number of energetically unfavorable hetero-atomic bonds. At higher temperatures, the Pt–Ir quasi-Janus configurations transform into partially mixed central-symmetric multi-shell structures.
While this previous atomistic version of the FCEM could cope with small-medium structures comprising up to ∼1000 atoms, the present study aims at elucidating phase separation phenomena in significantly larger, more practical NPs. For this goal, the FCEM has to become computationally more efficient by devising a model that facilitates a reduction in the number of compositional degrees of freedom via “mapping” atomic sites into groups. A similar principle was used, for example, in mesoscale molecular-dynamics simulations of polymers, proteins, carbon nanomaterials etc.14,15 Pt–Ir has been chosen as a nanosystem model for the new “coarse-grained” FCEM version described below, while employing refined CBEV energetics, in an attempt to predict chemical-order transitions in medium-large nanoparticles consisting of thousands and tens of thousands atoms, with the ultimate goal of constructing the corresponding nanophase diagrams. The latter turn out to be highly involved and substantially distinct from our above-mentioned previous study for small-medium NPs, as well as from the Pt–Ir bulk diagram.
2. Methodology
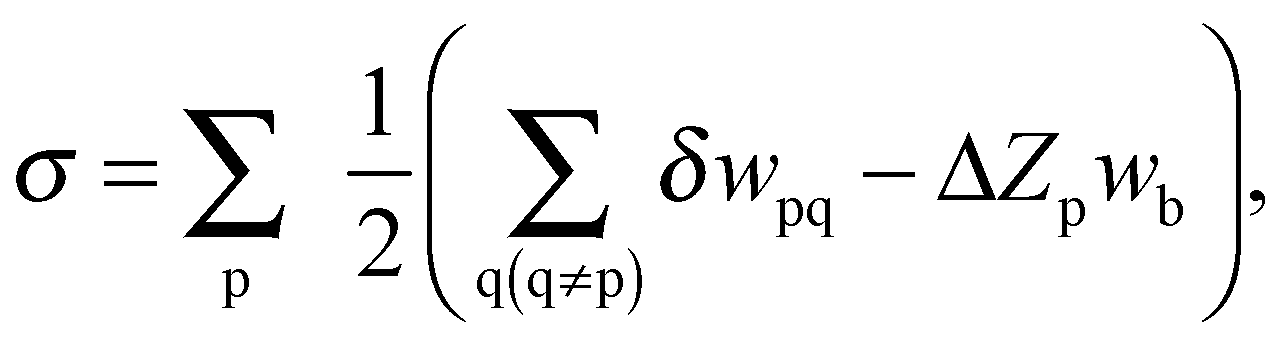
The FCEM expression for predicting alloy bulk and nanoparticle chemical order was derived on the basis of the nearest neighbor (NN) pair-interaction Hamiltonian within the rigid-lattice Ising model. Expanding the free energy in powers of constituent concentrations gives,16
When applied to NPs consisting of geometrically nonequivalent atomic groups, numerical minimization of F (e.g., by MATLAB) yields all I-constituent equilibrium concentrations for the group number p, cIp. Geometric input parameters include the number of atoms in each group, Np, and the number of NN pairs belonging to p- and q-groups, Npq. The first term stands for most of the configurational entropies, the second one involves the elemental (homoatomic) interactions, wIIpq, the third term includes the heteroatomic effective pair-interactions, VIJpq, between constituents I and J  , and the last term in F involves short-range order contributions (b ≈ 0.6 is a constant obtained from a best fit of FCEM predictions to Monte Carlo simulations17). The FCEM is advantageous compared to the simplistic Bragg–Williams approach that neglects short-range order. In spite of its limitations, the FCEM has at least one major advantage over numeric computer simulations, namely, its much higher efficiency due to the use of the above explicit analytical expression, which can furnish the full temperature-dependence of chemical order and thermodynamic properties even for medium-large NPs. Furthermore, FCEM computations exhibited reasonable accuracy when combined with energetics input based on the CBEV method (described below), expected especially for alloys with small atomic-size mismatch (for Pt–Ir NPs the roles of local strain and vibrational entropy were estimated to be minor11). Thus, computational results were found to be in general agreement with direct DFT computations for small-size TO clusters of Pt–Pd18 and Pd–Ir,19 as well as with MEIS experimental data for Pt25Rh75(111).20
In the previous version, here referred to as “fully atomistic FCEM” (FA-FCEM), the free-energy expression was minimized with respect to the number of all concentration variables, cIp, which amounts to the number of geometrically nonequivalent sites in central-symmetric or axially-symmetric nanostructures. Because of the rapid increase of this number with the NP size, making the computations extremely tedious (and feasible up to ∼1000 atoms), we decided to devise a method to reduce the number of FCEM variables without losing too much accuracy. The attainable size is significantly extended here using a coarse-grained layer model (CGLM), in which similar adjacent atomic sites within a layer are grouped together with a single assigned concentration variable. In particular, as demonstrated by Fig. 1, the method evaluates layer-by-layer subsurface and inner core “average concentrations”. (It should be noted that this grouping together of similar adjacent atomic sites differs substantially from a recently reported approach that puts atoms in equivalence sets defined on the basis of point group symmetry.21) For the 1289-atom TO core, the number of concentration variables goes down to 28 from hundreds of variables that have to be employed in the corresponding FA-FCEM. Due to the strong Pt surface segregation in this alloy, only four surface concentration variables, corresponding to sites having different coordinations, are used (namely, vertices, edges, (100) and (111) faces). It can be noted that although a common variable is assigned to every layer-specific subsurface entity (Fig. 1), its value is affected by an “integral” CBEV effect depending on the coordination of all neighboring surface sites. As an illustration, strong CBEV effects are expected to be associated with the NP central layer (#0) subsurface adjacent to many low-coordinated edge and vertex surface sites, as compared to layers #5 or #6 which intersect the surface mainly via (111) faces (Fig. 1).
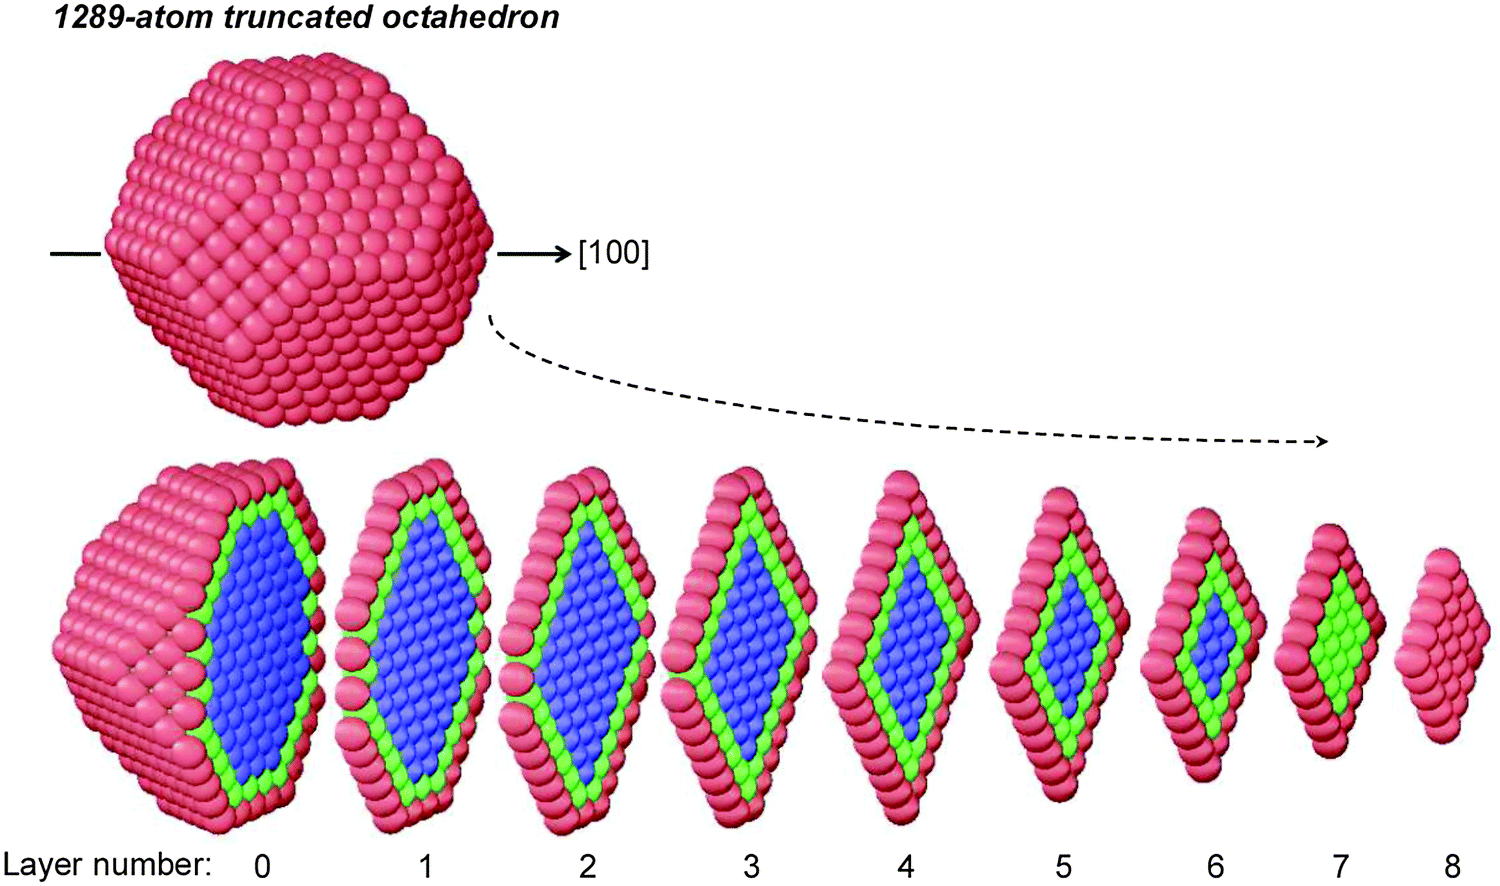 | ||
| Fig. 1 Illustration of the coarse-grained layer model (CGLM): the number of concentration variables is reduced by grouping together atomic sites within layers perpendicular to a chosen axis. Distinct concentration variables correspond to: (a) surface sites (red) having four different coordinations (vertices, edges, (100) and (111) faces), (b) core sites in two locations: the inner-core (blue) and the subsurface (green). | ||
Although this computationally advantageous method provides concentration variations along a chosen axis only, this information can be valuable, for example, in finding nanophase transitions involving symmetry breaking. (In some sense, the CGLM resembles certain experimental methods providing insights into concentration gradients along a chosen direction.)
The CBEV approach, introduced by us several years ago,20 derives the near-surface energetics input compatible with the FCEM by searching for a functional dependence of elemental bond-energy variations (δwpq) on the corresponding pair coordinations. This is done for intra-surface and surface–subsurface bonds (two-layer model) by employing DFT computed surface energies in the pair-bond expression,
| δwpq = a1,0xpq + a2,0xpq2 + a0,2ypq2 + a3,0xpq3 + a1,2xpqypq2 + a4,0xpq4 |
In this way, bond-energy variations are treated as coordination-dependent functions rather than numerical values. The implied basic assumption concerning the dominant effect of coordination, reflected in the use of common polynomials with element-specific coefficients, helps to circumvent the transferability problems, namely, the need to repeat fitting of interactions for every site in a given nanoparticle surface structure. This makes the FCEM/CBEV combination highly efficient. Furthermore, as demonstrated below the high transparency of the CBEV helps to elucidate the origin of distinct bond-energy variation effects on site-specific segregation in alloy nanoclusters.
Compared to our recent work,11 elemental CBEV data are obtained here from refined DFT-computed elemental bulk and surface energies, as outlined elsewhere.19 According to both sets of energetics, surface sites are unfavorable for Ir atoms, which tend to segregate at the subsurface atomic sites since the strengthening of surface–subsurface Ir–Ir bonds (and presumably also Pt–Ir) is consistently larger than Pt–Pt bonds (Fig. 2). This trend is stronger in the present energetics compared to our previous study of 923-atom Pt–Ir cubooctahedra,12 and is qualitatively consistent with DFT studies of segregated structures on the Pt3Ir(211) surface22 and with a (slight) subsurface preference for a single Ir dopant atom in a 201-atom Pt TO.23
 | ||
| Fig. 2 Dependence of surface–subsurface bond-energy variations, δw, on the number of pair broken bonds, ΔZ1 + ΔZ2, as extracted from DFT-computed surface energies (bulk bond energies are wPtb = −1.160 eV and wIrb = −1.635 eV). | ||
3. Results and discussion
Since Pt atoms practically do not desegregate from the surface (<1% at ∼1200 K), the study is focused on the NP-core chemical order and its variations. First, the CGLM is tested by comparison with predictions of our previous FA-FCEM computations11 for the largest TO size accessible to it (586 atoms). Secondly, we present detailed comparative computations for several thousands of atom NPs having various compositions. Finally, the CGLM-FCEM/CBEV is applied to a single-composition 29881-atom Pt–Ir TO revealing additional features.
3.1 Testing the CGLM (586-atom TO)
According to FA-FCEM computations (based on the former energetics)11 made along the [111] symmetry axis in a Pt376Ir210 TO, the low-T asymmetric quasi-Janus structure transforms into a symmetric multi-shell structure when concentrations of the corresponding front and back (or left/right) (111) layers in the quasi-Janus coincide at the transition temperature, Tsym (Fig. 3a). Concentrations of the three chosen distinct subsurface sites are very close at all temperatures. Hence, the subsurface site concentration variables can be substituted by a single CGLM subsurface concentration, which, indeed, turns out to be close to the FA values, and so the transition temperature is quite accurately reproduced (Fig. 3a). Thus, the two differently computed phase diagrams almost coincide for most of the NP compositions (Fig. 3b). Since the 68 distinct sites (below the Pt surface) involved in the FA computations constitute only 8 layers, the number of corresponding concentration variables is significantly decreased to 14 in the CGLM. Although the CGLM output is somewhat less detailed, this advantage becomes crucial for large NPs. Moreover, for larger NPs the CGLM approximation, assigning one concentration to all inner sites of each layer (Fig. 1), becomes more and more justified, since the exact geometrical intra-layer position then becomes insignificant.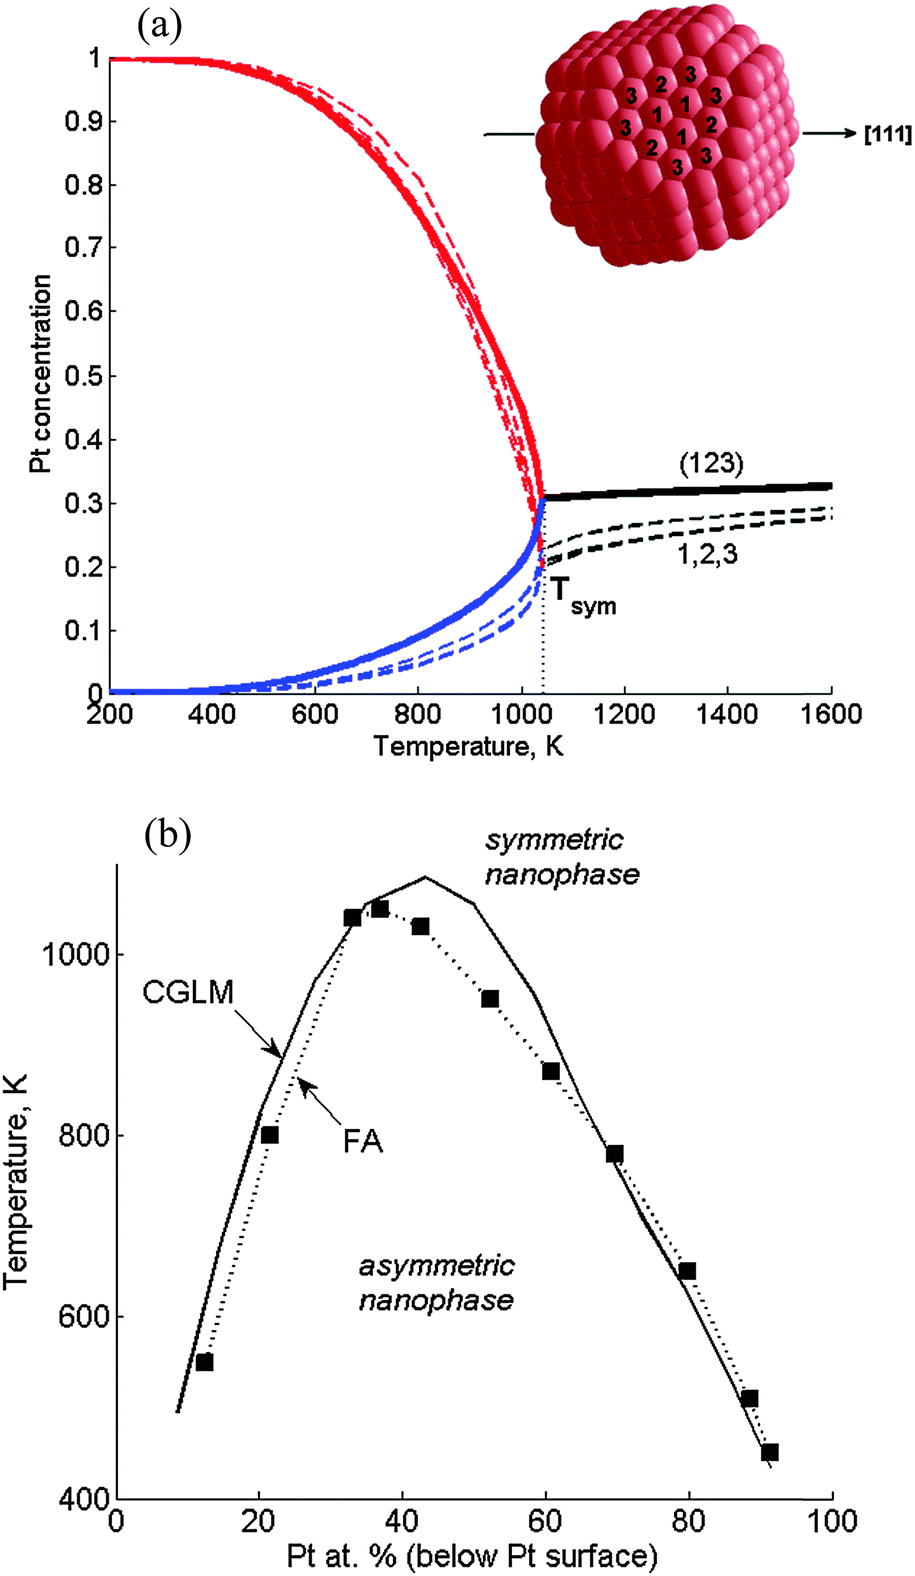 | ||
| Fig. 3 Verification of the coarse-grained layer model (CGLM): asymmetric–symmetric transitions along the [111] axis in Pt376Ir210 TOs computed with the CGLM-FCEM vs. the fully-atomistic FA-FCEM. (a) Three distinct subsurface site concentrations (dashed lines) vs. one subsurface layer concentration computed using the CGLM (solid lines). In the quasi-Janus nanophase below the transition at Tsym: Pt-side – red, Ir-side – blue. The site positions are marked in the subsurface schematics (inset); (b) nanophase diagram computed in the CGLM (solid line), compared to the diagram obtained by the FA computation11 (■ – magic-number compositions). | ||
3.2 CGLM computations for 1289-atom TOs
Larger Pt–Ir TOs were studied using the CGLM for separation along the [100] axis (along which the layer density is lower and thus preferred when using the refined energetics over the [111] axis used in Section 3.1). | ||
| Fig. 4 CGLM-FCEM results obtained for a 1289-atom TO with a 28 at% Pt core: (a) thermally-induced variations of the Pt-side (red) and Ir-side (blue) inner core layer concentrations, which coincide (black) at the transition temperature Tsym. Insets: schematics of asymmetric (quasi-Janus) and symmetric (multi-shell) configurations below and above Tsym. (b) The corresponding configurational heat-capacity λ-peak. (c) Layer concentration profiles for T < Tsym, T = Tsym and T > Tsym. Layer numbering corresponds to Fig. 1. | ||
At higher Pt content (38 at% Pt core) the transition from quasi-Janus to multi-shell configurations is quite minor and occurs at significantly lower Tsym followed by thermally induced gradual mixing of the multi-shell structure (Fig. 5a). The latter contributes to a more significant heat capacity hump (Fig. 5b) with a shape characteristic of the “Schottky anomaly”.25 The hump maximum at TSck indicates the most intensive Pt–Ir mixing process. The Tsym lowering stems from geometric constraints that hamper the formation of significantly asymmetric nanophase at this composition, namely, the corresponding broader Pt maximum can shift only slightly upon approaching the transition (Fig. 5c). (This prediction is consistent with statistical arguments concerning the tendency to form asymmetric configurations when the separated region is small, while for the large one off-center preference should disappear.5) The shift is not accompanied by significant mixing and energy change, and therefore the heat-capacity exhibits just a weak feature at Tsym (Fig. 5b). It can be noted that in the previous case of the 28 at% Pt core actually Tsym and TSck coincide (Fig. 4). Furthermore, for both NP compositions the thermally-induced changes are accompanied by an increase in the number of Pt–Ir bonds (Table 1). However, this increase amounts to 284 bonds in a pre-transition range of 140 K for the 28 at% Pt core due to intense mixing that appears to be associated mainly with interphase broadening (Fig. 4c), whereas in the case of the 38 at% Pt core the corresponding increase amounts to only 69 Pt–Ir bonds, since the latter transition is associated mainly with weak mixing of the slightly shifted nanophase boundaries (Fig. 5c). Above the transitions multi-shell mixing is manifested in decreased/increased amounts of extra Pt–Ir bonds (per degree) in the case of 28% vs. 38% Pt cores (Table 1).
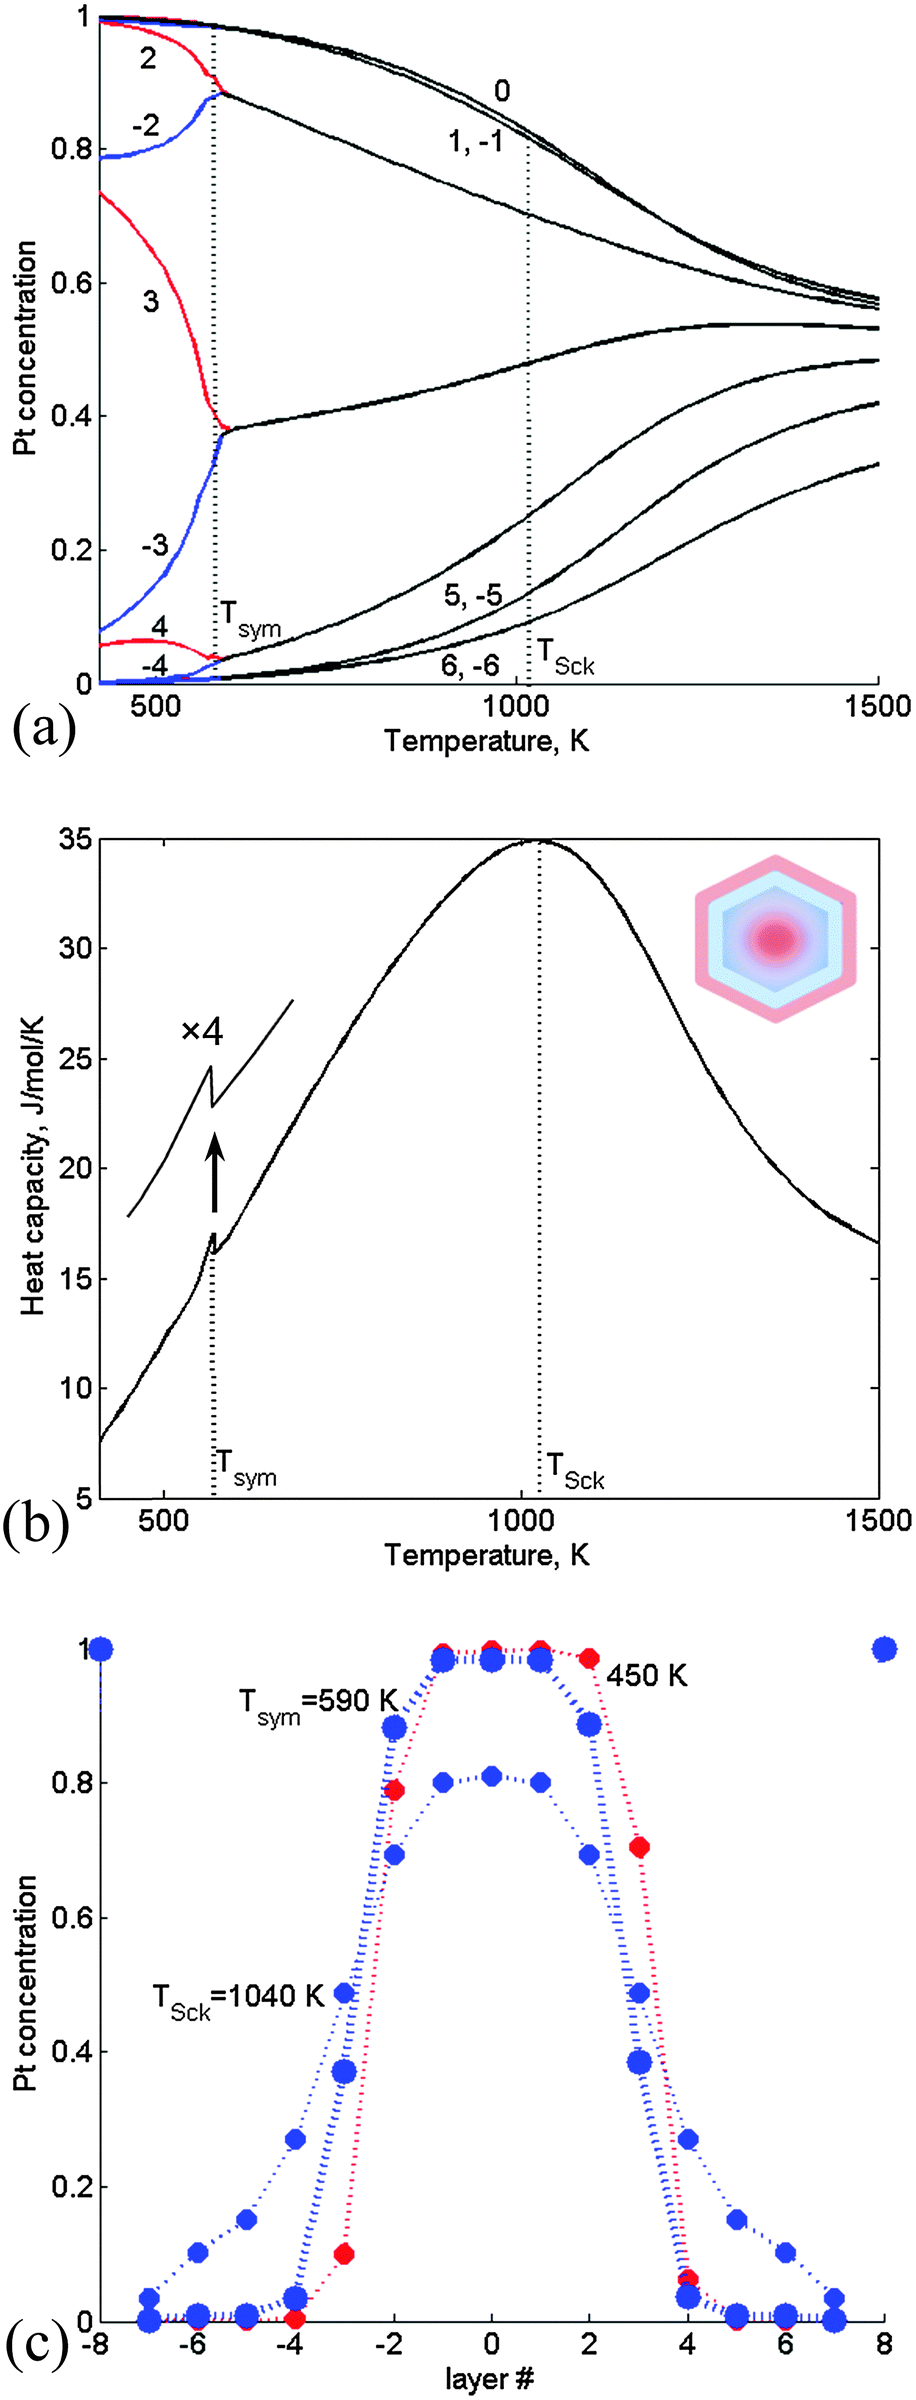 | ||
| Fig. 5 CGLM-FCEM results obtained for a 1289-atom TO with a 38 at% Pt core (along the [100] axis): (a) thermally-induced variations of the Pt-side (red) and Ir-side (blue) inner core layer concentrations, which coincide (black) at the transition temperature Tsym. (b) The corresponding configurational heat-capacity Schottky hump with the maximum at TSck ≫ Tsym and a weak sharp feature related to the symmetry-breaking minor transition. Inset: schematics of a symmetric (multi-shell) configuration above Tsym. (c) Layer concentration profiles for T < Tsym, T = Tsym and T > Tsym. Layer numbering corresponds to Fig. 1. | ||
| % Pt core | Temperature (K) | Number of Pt–Ir bonds |
|---|---|---|
| a Transition temperature, Tsym. | ||
| 28 | 900 | 2442 |
| 1040 | 2726 | |
| 1200 | 2827 | |
| 38 | 450 | 2169 |
| 590 | 2238 | |
| 1040 | 2495 | |
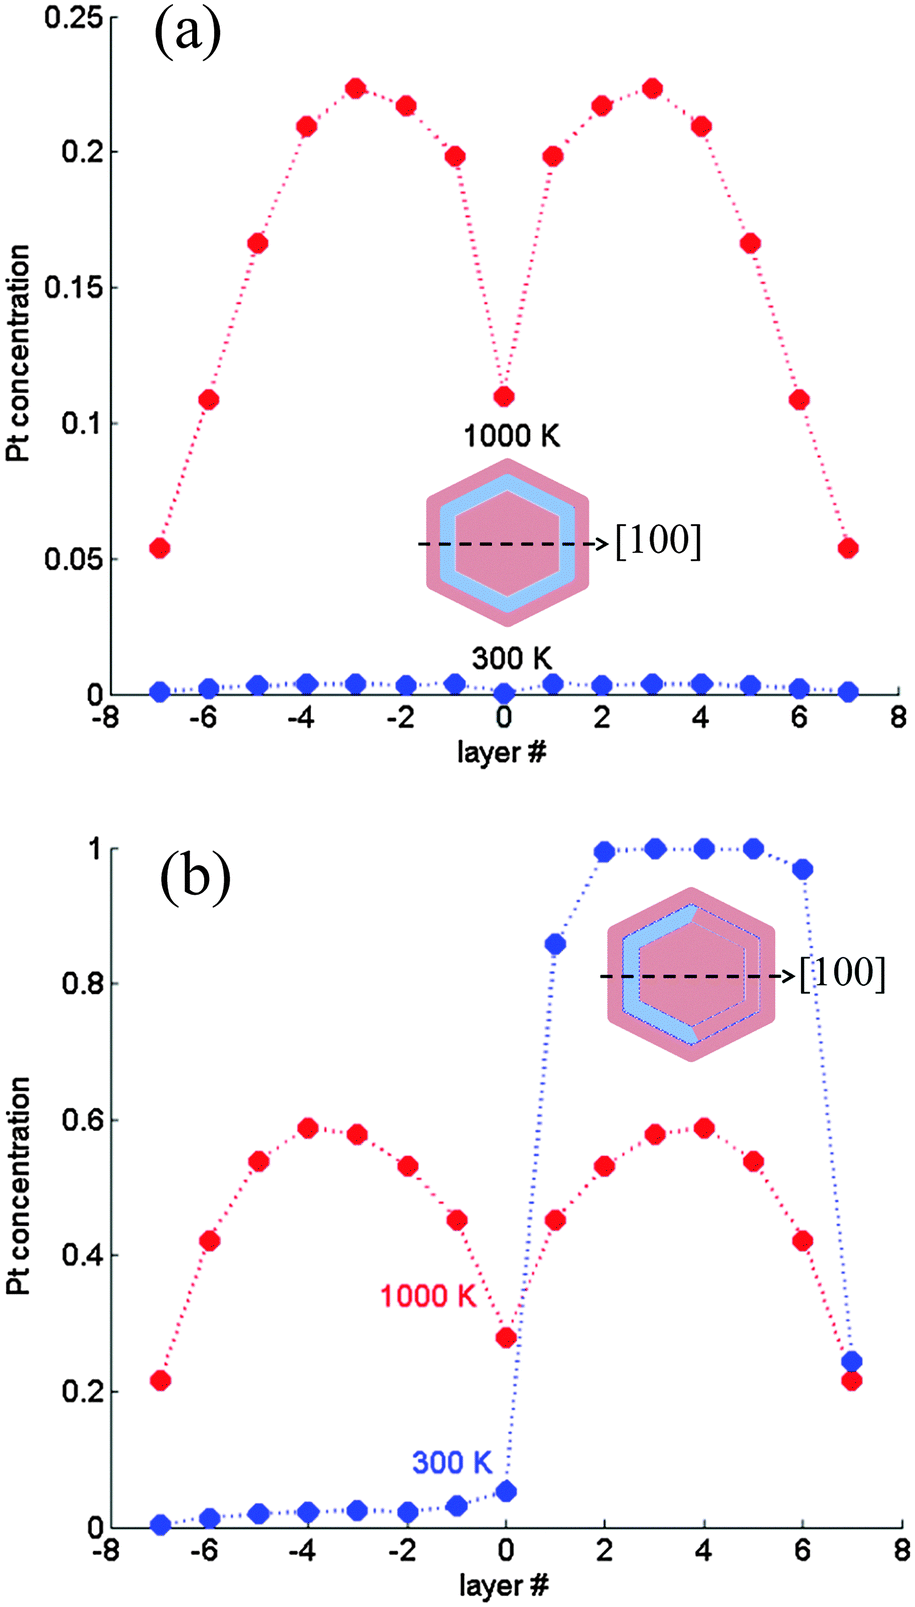 | ||
| Fig. 6 Subsurface layer concentration profiles computed for a 1289-atom TO. (a) Magic composition (∼57 at% Pt core): multi-shell structure without a transition; (b) ∼75 at% Pt core: asymmetric quasi ball-and-(subsurface)-cup at 300 K and symmetric profile at 1000 K. Layer numbering corresponds to Fig. 1. | ||
3.3 Nanophase diagrams (1289-, 2406- and 4033-atom TOs)
The same computations done for 2406- and 4033-atom TOs furnish all the asymmetry–symmetry transition temperatures. Plotting Tsymvs. composition gives the corresponding nanophase diagrams (Fig. 7). As indicated above, three composition ranges can be distinguished in the diagrams: | ||
| Fig. 7 Nanophase diagram of symmetry-breaking transitions in Pt–Ir TO NPs (with marked sizes) computed by the CGLM-FCEM. The left (I) and right (III) domes correspond to the inner-core quasi-Janus and subsurface quasi ball-and-cup transitions to multi-shell configurations, respectively. The intermediate region (II) involves an ideal multi-shell (no transitions) at “magic compositions” indicated by arrows (Pt-surface@Ir-subsurface@Pt-inner-core). The transitions presented in Fig. 4 and 5 are marked by small circles on the separation-coexistence dome of the 1289-atom TO. FCEM-computed bulk diagram miscibility gap is shown for comparison. | ||
(I) The low-Pt-core separation-coexistence line (dome) marks inner-core transitions from quasi-Janus to partially-mixed multi-shell configurations. With the increase of the NP size the dome widens, shifts to higher temperatures and its apex starts to turn towards the center in the direction of the bulk diagram. These variations are associated with the increase in the fraction of inner-core atoms with NP size, namely, ∼57%, ∼65% and ∼70% of the core atoms in 1289-, 2406- and 4033-atom TOs, respectively. It can be noted that Tsym and TSck coincide for all compositions up to the apex (see Fig. 4), whereas above it Tsym < TSck, because, as noted above, geometric constraints significantly hamper the asymmetric shift of the broad Pt-rich region, and most of the mixing takes place gradually at higher temperatures (see Fig. 5).
(II) This intermediate Pt concentration region below the magic-composition (Pt-surface@Ir-subsurface@Pt-inner-core) is characterized by greatly size-dependent, somewhat irregular variations in the quite low transition temperatures. For the 1289-atom TO, in addition to the magic composition (57% Pt core) Tsym = 0 also for the 44% Pt core that is another fully symmetric configuration, which involves Ir in sub-subsurface sites. This reflects again the subtle interplay of the geometric constraints, composition and near-surface energetics.
(III) The high-Pt-core dome that corresponds to intra-subsurface separation is lower than the dome in region I since this 2D “cup” configuration is naturally less stable than the 3D quasi-Janus separated structure. In addition, it gradually becomes narrower and shifts to the right with the increase of the NP size due to geometrical–compositional factors. Ultimately, this portion of the nanophase diagram is expected to disappear for very large particles (in the bulk limit). It can be noted that the predicted intra-subsurface separation, reflected in this second dome, occurs due to a strong CBEV-induced tendency of Ir atoms to segregate at all subsurface sites. With the former energetics this tendency is weaker and a side-separated Ir cluster starts to grow preferentially from one of the (111) subsurfaces11 and hence the diagram has just a single dome (Fig. 3).
3.4 6266- and 29![[thin space (1/6-em)]](https://www.rsc.org/images/entities/h3_char_2009.gif) 881-atom TOs
881-atom TOs
Due to the significant reduction in the number of concentration variables, the CGLM can cope even with much larger NPs. Compared to the variations shown in Fig. 5a, the most prominent new feature for these sizes is the sharpening of the smeared region of intensive atomic mixing near TSck. Thus, a rather distinct transition to a solid-solution-like nanophase is obtained, especially for the 29881-atom NP (Fig. 8a and b), which starts to approach (TSck = 1390 K) the bulk value for this composition (∼1490 K, Fig. 7). Correspondingly, the shape of Schottky anomaly (Fig. 8c) starts to resemble somewhat a heat-capacity feature characteristic of a “mean-field” computed bulk phase transition. Similarly to the case illustrated in Fig. 5, the low-T symmetry-breaking transition (Tsym ≪ TSck) is not accompanied by substantial mixing and energy change, but mainly by a small shift of nanophase boundaries, which, as shown in Fig. 8c is only slightly reflected in the heat-capacity plots. In agreement with the above and earlier results,6,8 the predicted sequence of nanophases for the 29881-atom NP starts with the more stable asymmetric quasi-Janus configurations as compared to the multi-shell structures, followed by solid-solution-like cores that are thermodynamically the least stable.
 | ||
| Fig. 8 Variations with temperature of the inner core layer concentrations in 6266-atom (a) and 29881-atom (b) TOs (37 at% Pt core); (c) heat-capacity Schottky humps corresponding to the indicated TO sizes. The weak features around 700 K correspond to symmetry-breaking transitions accompanied by nanophase boundary small shifts. | ||
4. Conclusions
Transitions between asymmetric and symmetric configurations in medium-large alloy nanoparticles with separation tendency were studied using a new coarse-grained layer model (CGLM) in the framework of the free energy concentration expansion method (FCEM). The input energetics is based on coordination-dependent bond-energy variations (CBEV) extracted from newly refined DFT-computed elemental bulk and surface energies. Thus, the highly efficient combination of FCEM/CBEV and CGLM enables extensive computations of temperature-induced nanophase symmetry-breaking transitions in Pt–Ir truncated octahedra consisting of thousands and tens of thousands atoms. Although the CGLM output is inherently somewhat less detailed than site-by-site fully atomistic calculations, it is proven to be a reasonably accurate approximation even for several hundreds atom NPs. The advantage in reducing the number of concentration variables is crucial for larger NPs, for which the accuracy is expected to further increase with size.The vast amount of output data enables the construction of a unique, perhaps the first of its kind, nanophase composite diagram comprising distinct composition ranges where the inner-core (quasi-Janus) and intra-subsurface (quasi ball-and-cup) configurations are stabilized at low T and transform into partially mixed multi-shells, which gradually mix further to form ultimately solid-solution-like cores. The intermediate region includes low-T “magic composition” multi-shell structures that do not undergo any thermally-induced nanophase transition.
According to preliminary computations for complementary TOs comprising up to tens of thousands atoms, the critical temperature (at the diagram apex) vs. NP size appears to exhibit power-law dependence characteristic of finite size scaling behavior,26 to be reported elsewhere. In addition to Pt–Ir that was chosen as a model system, the CGLM should be appropriate for medium–large nanoparticles of other weakly-miscible alloys and is not limited to the use of the CBEV energetics.
Acknowledgements
This work was supported by the Israel Science Foundation (grant No. 391/12). L.R. is thankful to the Israel Ministry of Immigrant Absorption for the continued financial support under the KAMEA program. The authors would like to thank the European Cooperation in the field of Scientific and Technical Research (COST) Action MP0903 “Nanoalloys as advanced materials: from structure to properties and applications”. We are grateful to Jack B. A. Davis of the University of Birmingham, UK for providing DFT-computed Pt bulk and surface energy data.References
- R. Ferrando, J. Jellinek and R. L. Johnston, Chem. Rev., 2008, 108, 845–910 CrossRef CAS PubMed.
- J. A. Toledo-Antonio, C. Angeles-Chavez, M. Antonia Cortes-Jacome, I. Cuauhtemoc-Lopez, E. Lopez-Salinas, M. Perez-Luna and G. Ferrat-Torres, Appl. Catal., A, 2012, 437, 155–165 CrossRef PubMed.
- S. J. Hwang, S. J. Yoo, T.-Y. Jeon, K.-S. Lee, T.-H. Lim, Y.-E. Sung and S.-K. Kim, Chem. Commun., 2010, 46, 8401–8403 RSC.
- D. Bochicchio and R. Ferrando, Phys. Rev. B: Condens. Matter Mater. Phys., 2013, 87, 165435 CrossRef.
- R. Ferrando, J. Phys.: Condens. Matter, 2015, 27, 013003 CrossRef PubMed.
- Y. Wang and M. Hou, J. Phys. Chem. C, 2012, 116, 10814–10818 CAS.
- A. Christensen, P. Stoltze and J. K. Norskov, J. Phys.: Condens. Matter, 1995, 7, 1047–1057 CrossRef CAS.
- F. Delogu, J. Phys. Chem. C, 2010, 114, 19946–19951 CAS.
- I. Atanasov, R. Ferrando and R. L. Johnston, J. Phys.: Condens. Matter, 2014, 26, 275301 CrossRef PubMed.
- G. Guisbiers, S. Khanal, F. Ruiz-Zepeda, J. R. de la Puente and M. Jose-Yacaman, Nanoscale, 2014, 6, 14630–14635 RSC.
- M. Polak and L. Rubinovich, Phys. Chem. Chem. Phys., 2014, 16, 1569–1575 RSC.
- H. Tigger, L. Rubinovich and M. Polak, J. Phys. Chem. C, 2012, 116, 26000–26005 CAS.
- M. Polak and L. Rubinovich, Surf. Sci. Rep., 2000, 38, 127–194 CrossRef CAS.
- J. A. Elliott, Int. Mater. Rev., 2011, 56, 207–225 CrossRef CAS PubMed.
- L. Ruiz, W. Xia, Z. Meng and S. Keten, Carbon, 2015, 82, 103–115 CrossRef CAS PubMed.
- M. Polak and L. Rubinovich, Surf. Sci., 2005, 584, 41–48 CrossRef CAS PubMed.
- J. M. Roussel, A. Saul, L. Rubinovich and M. Polak, J. Phys.: Condens. Matter, 1999, 11, 9901–9906 CrossRef CAS.
- G. Barcaro, A. Fortunelli, M. Polak and L. Rubinovich, Nano Lett., 2011, 11, 1766–1769 CrossRef CAS PubMed.
- J. B. A. Davis, R. L. Johnston, L. Rubinovich and M. Polak, J. Chem. Phys., 2014, 141, 224307 CrossRef PubMed.
- L. Rubinovich and M. Polak, Phys. Rev. B: Condens. Matter Mater. Phys., 2009, 80, 045404 CrossRef.
- G. Barcaro, L. Sementa and A. Fortunelli, Phys. Chem. Chem. Phys., 2014, 16, 24256–24265 RSC.
- R. Callejas-Tovar and P. B. Balbuena, Surf. Sci., 2008, 602, 3531–3539 CrossRef CAS PubMed.
- J. B. A. Davis, 2014, private communication.
- Y. Mnyukh, arXiv 1104.4637, 2011.
- M. Polak and L. Rubinovich, Phys. Rev. B: Condens. Matter Mater. Phys., 2005, 71, 125426 CrossRef.
- J. C. Lee, Thermal Physics: Entropy and Free Energies, World Scientific Publishing, Singapore, 2002 Search PubMed.
| This journal is © the Owner Societies 2015 |