 Open Access Article
Creative Commons Attribution 3.0 Unported Licence
Thermodynamic and spectroscopic properties of oxygen on silver under an oxygen atmosphere
Travis E.
Jones
*ab,
Tulio C. R.
Rocha†
b,
Axel
Knop-Gericke
b,
Catherine
Stampfl
c,
Robert
Schlögl
b and
Simone
Piccinin
a
aCNR-IOM DEMOCRITOS, c/o SISSA, via Bonomea 265 I-34136, Trieste, Italy. E-mail: trjones@fhi-berlin.mpg.de
bDepartment of Inorganic Chemistry, Fritz-Haber-Institut der Max-Planck-Gesellschaft, Faradayweg 4-6, 14195, Berlin, Germany
cSchool of Physics, The University of Sydney, Sydney, New South Wales 2006, Australia
First published on 3rd March 2015
Abstract
We report on a combined density functional theory and the experimental study of the O1s binding energies and X-ray Absorption Near Edge Structure (XANES) of a variety of oxygen species on Ag(111) and Ag(110) surfaces. Our theoretical spectra agree with our measured results for known structures, including the p(N × 1) reconstruction of the Ag(110) surface and the p(4 × 4) reconstruction of the Ag(111) surface. Combining the O1s binding energy and XANES spectra yields unique spectroscopic fingerprints, allowing us to show that unreconstructed atomic oxygen is likely not present on either surface under equilibrium conditions at oxygen chemical potentials typical for ethylene epoxidation. Furthermore, we find no adsorbed or dissolved atomic species whose calculated spectroscopic features agree with those measured for the oxygen species believed to catalyze the partial oxidation of ethylene.
1 Introduction
Elemental silver has the unique ability to catalyze the partial oxidation of ethylene to ethylene oxide (EO). Its efficacy as a catalyst is dependent on temperature and oxygen pressure. EO cannot typically be produced under the ultrahigh vacuum (UHV) conditions employed in many surface science studies.1–4 To obtain a measurable yield of EO, experiments must instead be performed at 420–550 K under an oxygen atmosphere, or with a silver catalyst that has been pretreated by long exposures to O2 at these reaction temperatures.1–6 This pressure gap suggests that oxygen must be in a specific chemical environment to catalyze the production of EO and has prompted experimental1,5,7–15 and theoretical studies16–19 aimed at elucidating the nature of the oxygen species present on silver under different conditions and the role these species play in catalytic processes.It has been shown that two types of oxygen are present on silver surfaces under epoxidation conditions at mbar O2 pressures.10,11,20 Isotopic labeling and proton-transfer reaction mass spectrometry experiments have revealed that only one type is active in the electrophilic attack of the C–C bond to form EO, though it may also participate in the production of CO2. The other type, however, participates solely in ethylene combustion through the nucleophilic activation of C–H bonds.11,21,22 To reflect this chemistry the two species are often referred to as electrophilic and nucleophilic oxygen, respectively.
The difference in chemistry between nucleophilic and electrophilic oxygen is apparent in their O1s binding energies, which, within an initial state theory of core level shifts, can be interpreted as a difference in charge.23 The nucleophilic oxygen species is characterized by an O1s binding energy of approximately 528 eV, while that of electrophilic oxygen is 530 eV,10,11,21,22 thereby allowing the two types of oxygen to be distinguished by way of X-ray photoelectron spectroscopy (XPS). Such studies have revealed that, at temperatures relevant for ethylene epoxidation, nucleophilic oxygen forms rapidly when oxygen is dosed under UHV conditions.7–9,24 The formation of electrophilic oxygen, however, requires long exposures at elevated O2 pressures or treatment with a reactive gas mixture.10–13
The ability to prepare nucleophilic oxygen under UHV has allowed it to be well characterized by surface science techniques, including scanning tunneling microscopy (STM), low energy electron diffraction (LEED), and XPS.5,7–9 Through judicious applications of these techniques researchers have demonstrated that under UHV conditions the nucleophilic species is oxygen in surface reconstructions whose structures are now known.5,8,9,25–27 Conversely, the structure of electrophilic oxygen is still debated.
In part, this debate persists due to the fact that, unlike nucleophilic oxygen, electrophilic oxygen cannot be prepared under the controlled conditions afforded by UHV. Experimental investigations of this species have thus required the development and application of methods capable of working at near mbar pressures. In particular studies have focused on in situ XPS28,29 and X-ray Absorption Near Edge Structure (XANES).30 Researchers have used XPS to demonstrate that silver surfaces become covered with electrophilic oxygen under mbar O2 pressure at epoxidation temperatures,20,24 while XANES has been employed to offer additional insight into the nature of the electrophilic species.
Bukhtiyarov and coworkers measured the O K-edge absorption spectra of oxygen species attributed to nucleophilic and electrophilic oxygen.10–13 They suggested that the nucleophilic oxygen they measured is best described as a surface oxide owing to the similarity between its O K-edge spectrum and that of the bulk oxide Ag2O. Both spectra are characterized by a large number of states near the absorption threshold that are the result of strong hybridization between O p and Ag sd levels. These experiments also showed that electrophilic oxygen lacks these oxidic features and is instead characterized by states at 10 eV above the absorption threshold formed by the hybridization between O p and Ag sp states. This fact, along with the lack of any known surface reconstruction associated with electrophilic oxygen, leads to the conclusion that the oxygen species responsible for the partial oxidation of ethylene is unreconstructed chemisorbed atomic oxygen.10–13
Coincident with these experimental results, ab initio atomistic thermodynamic studies on the Ag(111) surface revealed that at the temperatures and O2 pressures relevant for the partial oxidation of ethylene only two oxygen species are stable, the surface reconstruction ascribed to nucleophilic oxygen and unreconstructed chemisorbed atomic oxygen.16,17,31,32 (It should be noted that while what is now known to be an incorrect model of the surface reconstruction was used in these studies, there is little difference in energy between the older and revised models, see Appendix A). At higher oxygen chemical potentials thick oxide-like surfaces may become metastable before the bulk oxide Ag2O forms.
All of these findings helped spark a range of theoretical investigations into possible reaction mechanisms. Three limiting cases have been considered in detail, the reaction of: (i) unreconstructed chemisorbed atomic oxygen,33–35 (ii) oxygen in surface reconstructions,36–38 and (iii) the bulk oxide Ag2O.39–41 The first of these corresponds to the picture of electrophilic oxygen developed through in situ XPS and XANES studies,10–13 as well as the high temperature equilibrium phase predicted in ref. 16 and 17. The second addresses reactions in the well known p(4 × 4) phase of the Ag(111)/O surface phase diagram, albeit on an older model of the surface (see Appendix A). The final case could be encountered under equilibrium conditions at low temperatures and can be thought as a limiting case of dissolved oxygen, which has previously been shown to play an important role in EO production.2,14
Density Functional Theory (DFT) calculations show that when ethylene reacts with oxygen in the p(4 × 4) reconstruction of the Ag(111) surface, assigned to nucleophilic oxygen, the activation energy is 0.08 eV in favor of the total combustion byproduct.37 Conversely, the barrier to EO production on an Ag(111) surface with unreconstructed chemisorbed atomic oxygen is nearly identical to the barrier associated with the formation of the CO2 precursor, acetaldehyde (AA),33–35 which may be altered by the inclusion of subsurface oxygen.42–44 When the subsurface oxygen concentration becomes large and the bulk oxide forms, DFT calculations of the minimum energy path for EO production from atomic oxygen adsorbed on Ag2O39–41 reveal that, like unreconstructed atomic oxygen on the metal surface, the reaction barriers to EO production are roughly consistent with values reported from experiment.45,46 These results support the conclusion that the reconstructed atomic oxygen assigned to nucleophilic oxygen burns ethylene and that unreconstructed chemisorbed atomic oxygen can participate in EO production.
The apparent ability of all types of unreconstructed atomic oxygen to epoxidize ethylene makes it difficult to know which form is the active species present under given experimental conditions. Furthermore, no studies have demonstrated unequivocally which of these species are present on silver surfaces under an oxygen atmosphere. In an effort to answer this question, we have turned to a thorough experimental and computational characterization of the structure and energetics of various oxygen species on the Ag(110) and the Ag(111) surfaces.
We chose to focus on the Ag(110) and the Ag(111) surfaces because they have been reported to have similar selectivity to EO and, presumably, similar active species.24,47 Our ab initio atomistic thermodynamics calculations suggest that oxygen induced surface reconstructions are stable across a wide range of oxygen chemical potentials on both surfaces. Unreconstructed chemisorbed atomic oxygen is not thermodynamically favorable on either surfaces, except at very low coverages that will only be encountered under UHV conditions. At high oxygen chemical potentials we found that oxygen can adsorb on an oxide-like surface that will become metastable under conditions capable of stabilizing the bulk oxide, Ag2O.
We go on to verify this picture and the previous assignment of nucleophilic oxygen to oxygen induced surface reconstructions. First we measure the O1s photoemission and O K-edge absorption spectra of the Ag(110) and the Ag(111) surfaces under in situ conditions. Then we compare the measured spectra to those calculated for a wide variety of chemisorbed oxygen species. In agreement with ab initio atomistic thermodynamics, the spectroscopic features calculated for oxygen in surface reconstructions match with those obtained from measured spectra, suggesting that the dominant oxygen species are those in surface reconstructions. We found that unreconstructed atomic oxygen is only present during the first few minutes after a clean silver surface is exposed to an O2 atmosphere. After 15 min of oxygen exposure we observe no evidence of unreconstructed atomic oxygen. Furthermore, no form of chemisorbed atomic oxygen has the XPS or XANES signatures of electrophilic oxygen.
2 Experimental details
The in situ XPS measurements were performed using the near ambient pressure endstation of the ISISS beamline at the synchrotron radiation facility BESSY II of the Helmholtz-Zentrum Berlin. Details about the system can be found elsewhere.48 The Ag(111) and Ag(110) single crystals were polished and oriented to an accuracy of <1°. The crystals were fixed in a sapphire sample holder using a tungsten wire. Heat was provided by an IR laser from the backside, which was primarily absorbed by a stainless steel plate kept in contact with the crystal. The sample temperature was measured using a K-type thermocouple pressed on the crystal side by a tungsten wire holder and was controlled by adjusting the laser power using a PID feedback loop. Oxygen was dosed using a minican (Linde AG, 4.5 nominal purity) connected to a leak valve. The freshly polished crystals were cleaned by repeating cycles of O2 treatment at 10−3 mbar and 423 K for 20 min, Ar sputtering at 1.5 kV for 20 min and annealing at 673 K in vacuum (5 × 10⁻⁸ mbar) for 5 min. Initially, large amounts of C, Cl, S and Si segregated to the surface after O2 exposure, but after several cleaning cycles, only Ag and O were observed for exposures shorter than 1–2 h. For longer times, S slowly accumulated on the surface. Hence, we limited the data acquisition time to 2 h, after which the surface was cleaned and exposed to O2 again.We selected appropriate photon energies to measure core-level spectra for different elements using photoelectrons with the same kinetic energy of 150 eV, which is equivalent to an inelastic mean free path of 0.5 nm. The binding energy scale for each spectrum was calibrated by the Fermi edge measured with the same photon energy. O K-edge XANES was acquired in the Auger Electron Yield mode by scanning the incident photon energy and setting the electron analyzer to collect Auger electrons with a kinetic energy of 514 eV corresponding to the O KVV transition. The XANES energy scale was calibrated by setting the π* transition of molecular oxygen in the gas phase to 530.93 eV.49
2.1 Coverage estimation
The elemental atomic concentration ratio (O/Ag) was calculated by dividing the integrated areas of the O1s and Ag3d core-levels by the incident photon flux and the atomic photoionization cross sections calculated by Yeh and Lindau50 for the appropriate energies.With 1 monolayer (ML) defined as the substitution of all surface atoms on the unreconstructed surfaces, we calculated O/Ag ratios for different structural models by considering the escape depth probability e−d/λ for each atomic layer at distance d from the surface and taking the inelastic mean free path λ (IMFP) for the appropriate kinetic energy as the average from two experimental studies from the literature.51,52 In this approach we assume that no scattering event occurs in the adsorbed overlayer. In this way for each adsorption model with different coverages, the atomic ratios can be estimated and compared with the experimental values.
3 Computational details
All DFT calculations were performed using the Quantum ESPRESSO (QE) package53 and ultrasoft pseudopotentials using the exchange and correlation potential developed by Perdew, Burke, and Ernzerhof.54 In order to compute O K-edge spectra we employed oxygen pseudopotentials with two Gauge Including Projector Augmented Wave (GIPAW) projectors for the l = 1 channel, available from ref. 55 and 56. The silver pseudopotential was taken from the PSLibrary project and is available from ref. 57. All slabs contain five silver layers with approximately 10 Å of vacuum between periodic images. We found that the calculations are well converged using a kinetic energy cutoff of 30 Ry and a (12 × 12) Monkhorst–Pack k point grid for the (1 × 1) surface unit cell58 when Marzari–Vanderbilt cold smearing was used with a smearing parameter of 0.02 Ry.59 We tested the effect of spin-polarization. In agreement with previous work,60 at high atomic oxygen coverage the adsorbed oxygen structures become ferromagnetic. However, this has little impact on the computed spectroscopic properties. As such, all calculations reported herein are non-spin-polarized, unless otherwise noted.3.1 Core level binding energies
O1s binding energies were calculated using the ΔSCF method, which can be used to compute shifts in binding energy that capture both initial and final state effects.61–65 This approach requires the computation of the energy at both the electronic ground state and the state in the presence of the core hole. The first calculation is simply a geometry relaxation to obtain the total energy of the system at the desired local minimum on the potential energy surface in the absence of a core hole. The second calculation is a fixed geometry self consistent field (SCF) calculation of the same system using a pseudopotential with a core hole on the ionized atom. This calculation is performed at the relaxed geometry due to the fact that the electronic relaxation is much faster than the nuclear relaxation. To maintain charge neutrality the excited core electron is included explicitly in the calculation of the total energy of the system with the core hole, see for instance ref. 66, as opposed to treating the excess electron as uniform background charge. This approach accounts for the core hole screening by the free charge carriers in the metal. Due to the fact that electronic relaxations are included in the presence of the core hole, both initial and final states are accounted for with the ΔSCF method.Within the ΔSCF approach the O1s binding energies of oxygen on/in the silver surfaces converge quickly with cell size, requiring (2 × 2) surfaces to converge the O1s binding energy to within ±0.1 eV. As such, the O1s binding energies of the p(N × 1) reconstructions, see Section 4.2, were computed using p(N × 2) supercells. The O1s binding energies of all other surface species were computed using the minimal unit cell required to reach the desired coverage.
Because the ΔSCF method yields differences in energies, a reference state can be used to make direct comparison with experiment more straightforward. For this purpose we chose a (4 × 4 × 4) supercell of bulk Ag2O, as there is little doubt about its electronic and atomic structure (for details see Appendix B). The resulting O1s binding energy of a system relative to the reference is then:
 | (1) |
 and
and  are the energies of the oxide reference, with and without an O1s core hole. The ΔO1s can be converted to an absolute binding energy by adding the experimentally determined O1s of the reference compound:
 | (2) |
 is 529.2 eV.67 It is important to note however that changing the reference will only shift the reported values rigidly.
To ensure that this approach yields satisfactory results we computed the O1s binding energies of a (4 × 2 × 4) super cell of Ag2CO3, where the lattice parameters and ionic positions were taken from experiment,68 and 1/4 ML H2O was adsorbed on silver. We found the values to be 530.7 and 533.0 eV for Ag2CO3 and H2O, respectively, as compared to the experimental results of 530.869 and 533.3 eV.70 These errors are consistent with the 0.1–0.3 eV error previously found for oxygen and carbonates on silver surfaces.71,72 Thus, we expect our calculated O1s binding energies to be within our 0.4 eV total instrument resolution.
3.2 O K-edge spectra
To first order XANES probes the unoccupied partial density of states on the excited atom that are allowed within dipole selection rules. In a single particle approach the X-ray Absorption cross section for dipole transitions can be expressed using Fermi's Golden rule:73–76 | (3) |
 gives the transition amplitude between the initial core level |ψi〉 with energy Ei and the final (empty) state |ψf〉 with energy Ef. The dipole transition operator that couples the core and unoccupied states is given by:
 | (4) |
 | (5) |
 | (6) |
While the synchrotron radiation used in our experiments was linearly polarized in the plane of the storage ring, we averaged over ϕ due the fact that the in-plane orientation of the samples was unknown. This assumption does not change the qualitative features of the computed O K-edge spectra, see Appendix C, but allows us to write the angular dependence of the cross section as:
 | (7) |
The elements of σij were calculated using the continued fraction approach and ultrasoft pseudopotentials by way of the XSpectra package.74–76 Within this approach a single atom in the computational cell is treated as the absorbing atom, which, depending on the importance of the core hole effect, can be modeled with or without a core hole.76,77 For the cases reported herein we report results using a full core hole unless otherwise noted, that is, results obtained by performing a SCF calculation on systems with a pseudopotential containing a core hole on the absorbing atom and the same k point mesh as was used in the SCF calculations. As in the case of the ΔSCF calculations, the excited core electron is included self consistently, unless otherwise noted (see Appendix D). To avoid interactions between neighboring periodic images, calculations were performed on (4 × 4) surfaces, except for the Ag(110) c(6 × 2) reconstruction (see Section 4), for which we took a (6 × 4) surface, and the Ag(111)  surface substitutional structure (see Section 5.5), where we used a
  surface. For more details on size convergence see Appendix B.
Because the spectra are calculated using stationary states a broadening factor must be introduced to account for the excited-state lifetime.76,78–80 This was accomplished by convoluting the raw spectrum with a Lorentzian that has an energy dependent linewidth:
| Γf(E) = Γcore + γ(E). | (8) |
In every case the occupied states are removed and the Fermi energy of the broadened spectrum is set to the computed O1s binding energy associated with the absorbing atom to facilitate comparison with experiment. In the cases of systems with multiple absorbing atoms, for instance in Section 5.4, the spectrum of each symmetry unique atom is prepared separately to ensure the correct energy of alignment of the individual spectra of each absorber. These spectra are then summed to yield the total spectrum. The final theoretical spectra are always normalized to the experimental spectrum to which they are compared.
3.3 Ab initio thermodynamics
The surface free energies are calculated using ab initio atomistic thermodynamics16,17,83,84 which has previously been applied to the Ag(111)–O system.16 This approach allows us to determine the thermodynamic stability of the different oxygen species by considering the surface to be in thermodynamic equilibrium with a reservoir of O2. If the vibrational and configurational contributions to the free energy are ignored, the surface free energy can be written as: | (9) |
Under the assumption that μAg is the total energy of a silver atom in the bulk, the temperature and pressure dependence are contained entirely in the oxygen chemical potential, which can be written as:
 | (10) |
![[small mu, Greek, tilde]](https://www.rsc.org/images/entities/i_char_e0e0.gif) O2(T,p0) is the translational, rotational, and vibrational contribution to the free energy. The latter we took from the NIST JANAF thermochemical tables,85 though it could be calculated. For the former, we employed two separate approaches: (i) we computed the total energy of the O2 molecule at the Γ point using a box whose side lengths were 40 Bohr; (ii) because modern GGAs, including PBE, overbind the O2 molecule by nearly 1 eV, we computed the energy of a single oxygen atom using a cubic box with side lengths of 40 Bohr and took EO2 to be twice the atom energy plus the experimental O2 binding energy. We will refer to these as the full DFT and mixed reference states. The full DFT results are expected to excessively favor gas phase O2, hence low oxygen coverage, whereas using the experimental O2 binding energy will lead to an over stabilization of adsorbed O.
O2(T,p0) is the translational, rotational, and vibrational contribution to the free energy. The latter we took from the NIST JANAF thermochemical tables,85 though it could be calculated. For the former, we employed two separate approaches: (i) we computed the total energy of the O2 molecule at the Γ point using a box whose side lengths were 40 Bohr; (ii) because modern GGAs, including PBE, overbind the O2 molecule by nearly 1 eV, we computed the energy of a single oxygen atom using a cubic box with side lengths of 40 Bohr and took EO2 to be twice the atom energy plus the experimental O2 binding energy. We will refer to these as the full DFT and mixed reference states. The full DFT results are expected to excessively favor gas phase O2, hence low oxygen coverage, whereas using the experimental O2 binding energy will lead to an over stabilization of adsorbed O.
4 Ag(110) surface
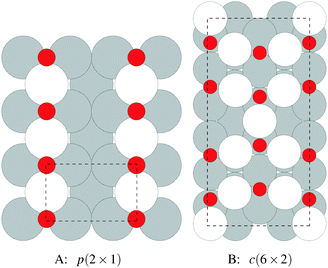
We begin our study on the properties of adsorbed oxygen by examining oxygen on the Ag(110) surface.It is well known that a series of p(N × 1), and a c(6 × 2), surface reconstructions form on the Ag(110) surface under an oxygen atmosphere.8 The p(N × 1) added row reconstructions on the Ag(110), where N ranges from 2–8, are the oldest known reconstructions in the Ag–O system due to the ease with which they can be produced.86 The relatively high sticking coefficient of oxygen on the Ag(110) surface allows the reconstructions to be made under clean conditions and low O2 dosing.8 In vacuum, the surface saturates with an overlayer that gives rise to a p(2 × 1) low energy electron diffraction (LEED) pattern, whose structure corresponds to that shown in Fig. 1A, with oxygen and silver forming added rows running in the [001] direction on the (110) surface.87,88 These rows can be seen to have the linear O–Ag–O bonding motif seen in the bulk oxide, Ag2O. Under lower oxygen chemical potential other p(N × 1) patterns emerge, which correspond to lower density added row structures, with N reaching a maximum of 8.89–91 At higher oxygen chemical potential, a c(6 × 2) LEED pattern also emerged.8 This added strand structure,92,93Fig. 1B, is like that found in the Cu–O system.94–97
4.1 Surface free energies
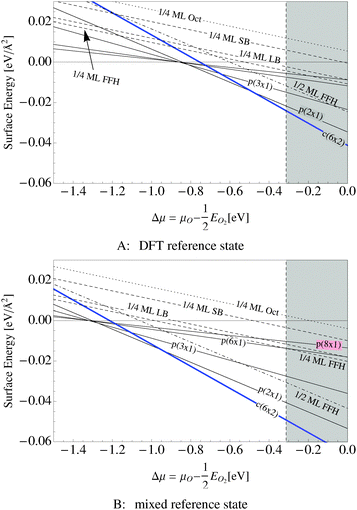
Our surface free energy calculations are in good agreement with these experimental observations. Fig. 2A shows the surface free energy of a variety of phases as a function of ΔμO defined as , where EO2 was taken as the total energy of the isolated O2 molecule calculated by way of DFT. The grey shaded box represents the range of chemical potential over which the bulk oxide, Ag2O, is stable, i.e., when ΔμO is greater than the oxide's heat of formation. The dashed vertical line shows the experimental heat of formation of Ag2O. The surface free energies of the p(N × 1) added row reconstructions are indicated by way of solid black lines, and the c(6 × 2) phase is shown with a thick blue line. The dotted line indicates the surface free energy of 1/4 ML atomic oxygen dissolved in the octahedral holes. The surface free energies of 1/4 monolayer (ML) atomic oxygen chemisorbed on the short bridge (SB), long bridge (LB), and four-fold hollow (FFH) sites are shown by way of the black dashed lines, the atomic structures of which are shown in Fig. 3. We also considered a 1/2 ML coverage of oxygen on the FFH sites, which adopts the linear O–Ag–O bonding motif shown in Fig. 3D. The surface free energy of this state is shown in Fig. 2 by way of the dashed-dotted line.
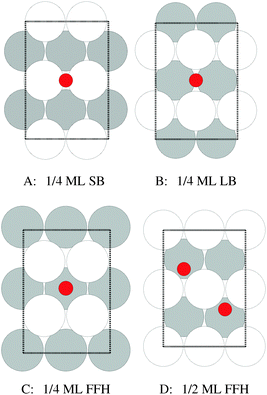 | ||
| Fig. 3 Atomic structure of 1/4 ML oxygen on the short bridge (SB) (A), long bridge (LB) (B), and four-fold hollow (FFH) sites (C), along with 1/2 ML oxygen on the four-fold hollow sites (D). The coloring is the same as Fig. 1. | ||
Fig. 2B shows the same systems as in Fig. 2A but with the mixed O2 reference state, that is defined as twice the energy of the isolated oxygen atom calculated by way of the DFT atom plus the experimental O2 binding energy. Note that changing the O2 reference state primarily serves to shift the surface free energies rigidly; it does not appreciably alter the relative stability of the phases. As such, for the remainder of this discussion we will focus on Fig. 2A.
When the oxygen chemical potential is low, that is, when ΔμO < −0.85 eV, all of the Ag–O structures have a positive surface free energy and the clean surface is thermodynamically stable. As the oxygen chemical potential increases, the p(N × 1) phases become favored with N rapidly decreasing to a limiting value of two. Upon further increase of ΔμO the c(6 × 2) becomes favored before the bulk oxide.
It is interesting to note that unreconstructed atomic oxygen is never the thermodynamically favored phase, as evidenced by the fact that surface reconstructions always have a lower free energy, see Fig. 2. At 1/4 ML coverage the surface free energy of dissolved oxygen is positive across the entire range of oxygen chemical potential in Fig. 2A. Oxygen on the SB sites is slightly more stable, followed by the LB and FFH, which are comparable in energy at 1/4 ML coverage. When the O–Ag–O motif is adopted at 1/2 ML oxygen coverage on the FFH sites, the adsorption energy increases markedly from that found at 1/4 ML coverage. This high coverage is thermodynamically favorable over the other unreconstructed atomic oxygen species. However, the oxygen induced reconstructions remain the most stable phase at oxygen chemical potentials below that required to form Ag2O. Though thermodynamics suggests that unreconstructed chemisorbed oxygen is unlikely to be present under equilibrium conditions at values of ΔμO relevant for ethylene epoxidation, such an unreconstructed species may be present if, as has been suggested on the basis of microkinetic modeling,98 the formation of the thermodynamically favored reconstructions is limited by kinetics, not thermodynamics. The presence of chemisorbed oxygen can be determined experimentally by the spectroscopic measurement of the silver surface, in particular the O1s binding energies.
4.2 O1s binding energies
UHV measurements of the O1s binding energies have revealed that the p(N × 1) and c(6 × 2) surface reconstructions of the Ag(110) are indistinguishable, appearing experimentally at 528.3–528.6 eV, although the full width at half maximum (FWHM) increases from 1.7 eV to 2.0 eV when the c(6 × 2) phase is present.8,99 Our calculated O1s binding energies are in good agreement with these measurements (see Table 1). Those calculated for the p(N × 1) reconstructions, where N ranges from 2 to 8, appear at 528.5 eV, whereas the two symmetry unique oxygen atoms in the c(6 × 2) phase have calculated O1s binding energies of 528.4 eV and 528.6 eV, with the linearly coordinated oxygen appearing at 528.4 eV and three-fold coordinated oxygen at 528.6 eV.Our calculated O1s binding energies support the conclusion drawn from ab initio thermodynamics that unreconstructed chemisorbed atomic oxygen on the SB and LB sites is likely not present under UHV conditions but cannot be used to exclude the presence of oxygen adsorbed on the FFH sites or dissolved oxygen (see Table 1). At 1/4 ML coverage the weakly adsorbed oxygen on the SB sites has an O1s binding energy of 527.0 eV, while the more strongly bound oxygen on the LB sites has an O1s binding energy of 527.6 eV. The further increase in adsorption energy associated with going to the FFH sites is mirrored by an increase of the O1s binding energy to 527.8 eV at 1/4 ML coverage and 528.2 eV at 1/2 ML coverage. The calculated O1s binding energies of dissolved oxygen are 528.5 and 528.6 eV in the subsurface and bulk, respectively, where the bulk dissolved species was modeled as a single oxygen atom in an octahedral hole of a 32 silver atom supercell. While these findings suggest it may be difficult to discriminate between oxygen adsorbed on the FFH sites, dissolved oxygen, and oxygen in the p(N × 1) and c(6 × 2) surface reconstructions of the Ag(110) using the O1s spectrum alone, they indicate that weakly bound chemisorbed oxygen, that on the SB and LB sites is not present under UHV conditions. However, a weakly bound atomic oxygen may be present under higher O2 pressures.
To test this possibility we performed experiments on an Ag(110) single crystal. A clean Ag(110) surface was exposed to 10−4 mbar O2 pressure for 22 minutes at 423 K. This temperature and pressure correspond to ΔμO ≈ −0.7 eV. The inspection of Fig. 2 reveals that under these conditions either the p(2 × 1) or the c(6 × 2) reconstruction is predicted to occur, depending on the choice of O2 reference state.
Consistent with this prediction, when we measured the in situ XPS we found that the surface was covered primarily in an oxygen species with an O1s binding energy of 528.3 eV, see Fig. 4, along with minor contributions from oxygen species with O1s binding energies of 529.2 eV and 530.3 eV. Note that the measured O1s binding energy of 528.3 eV could also be attributed to dissolved oxygen or 1/2 ML oxygen on the FFH sites, as their calculated O1s binding energies are within the 0.3 eV error we found for the ΔSCF approach. However, the calculated O1s binding energies of oxygen on the LB and SB sites are well below the measured value. As such, atomic oxygen on the LB and SB sites cannot be assigned to the peak appearing at 528.3 eV in the measured O1s spectrum. Furthermore, as there is no asymmetry or shoulder on the lower energy side of the 528.3 eV peak in the O1s spectrum, we are confident that atomic oxygen is not present on the LB or SB sites after 22 minutes at 423 K under 10−4 mbar O2 pressure.
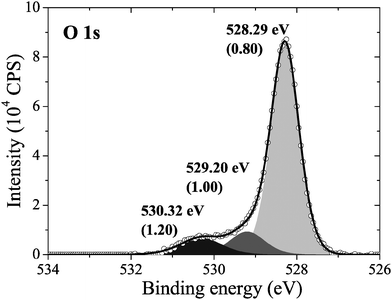 | ||
| Fig. 4 The measured O1s spectrum of an Ag(110) surface under 10−4 mbar O2 pressure for 22 minutes at 423 K. | ||
To help identify the species that are present we can turn to the experimental O/Ag ratio, which shows that the oxygen coverage of the species appearing at 528.3 eV in the O1s spectrum is approximately 0.45 ML. These data demonstrate that the lower density p(N × 1) added rows were not the dominant species on the surface, as they have lower coverages. However, the coverage cannot be used to unambiguously assign the measured oxygen species to either surface reconstruction, or even 1/2 ML unreconstructed chemisorbed oxygen. Instead, because the oxygen coverage of the species with O1s binding energies consistent with the measured spectrum are at or above 1/2 ML, the surface could be almost entirely covered in the p(2 × 1) reconstruction, which has 1/2 ML coverage, 1/2 ML of unreconstructed oxygen, or islands of the c(6 × 2) reconstruction could be present.
4.3 O K-edge spectra
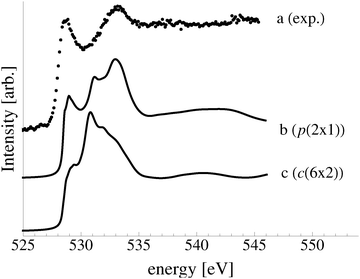
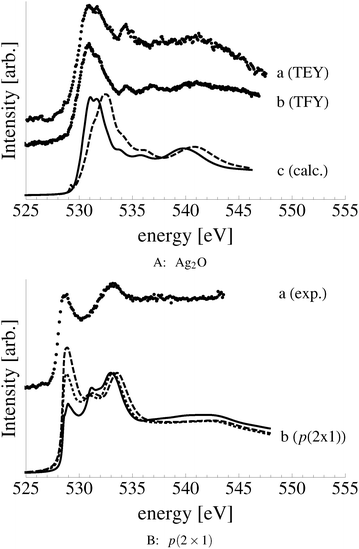
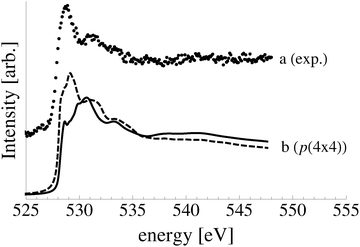
In an effort to distinguish between the possible oxygen structures present under in situ conditions we measured the in situ O K-edge absorption spectrum of the oxygen treated Ag(110) crystals in the Auger Electron Yield (AEY).100 Inspection of the measured O K-edge spectrum, the black dots in Fig. 5, reveals that, like in the bulk oxide, Ag2O, the Ag–O bonding is not purely ionic. Instead, hybridization between the O 2p and Ag levels leaves the O 2p states partially unoccupied. As a result, there are two strong features above the threshold in the O K-edge spectrum due to O 1s → 2p transitions.Comparing the measured O K-edge spectrum with that calculated for the p(2 × 1) reconstruction of the Ag(110) surface suggests that the added-row reconstructed phase was present under the experimental conditions. The calculated spectrum is shown in curve b of Fig. 5 using a solid line. Note that the vertical offset from the measured spectrum is only to aid in distinguishing the two spectra. Both absorption spectra can be seen to have a narrow maximum centered at approximately 529 eV and a second feature at 534 eV, similar to the O K-edge spectrum of the p(2 × 1) added row reconstruction on the Cu(110) surface.101 We find that, like in Ag2O, the near threshold absorption is due to O p states mixing with Ag sd levels, whereas the high energy feature is due to the mixing between O p and Ag sp states, as previously suggested.10,102 However, unlike the bulk oxide, Ag2O, there is substantially more O p and Ag sp mixing, giving rise to a more intense broad high energy peak for oxygen in the p(2 × 1) surface reconstruction than in Ag2O (see Appendix B for the Ag2O XAS). In the calculated spectrum this absorption can be seen to be composed of two separate features, whereas only one absorption maximum is seen for the 534 eV feature in the experimental spectrum. The appearance of only a single peak in the experimental spectrum is likely due to vibrational, or instrumental, broadening, which we have neglected, as noted in Section 3.103,104 The two absorptions appear in the theoretical spectrum because of differences in mixing between the Ag states and the in and out of plane O 2p states, highlighting the O K-edge spectrum's sensitivity to the local environment around oxygen.
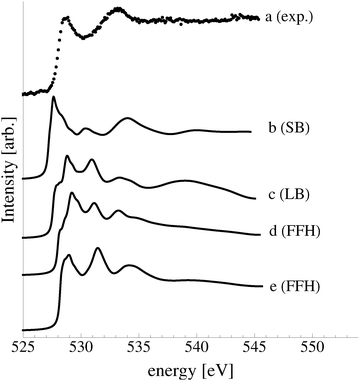
The sensitivity of the O K-edge spectrum to the local environment of the oxygen also allows us to confirm that neither the c(6 × 2) reconstruction nor the unreconstructed adsorbed atomic oxygen were present during the experiment. Returning to Fig. 5 we can see that the O K-edge spectrum calculated for the c(6 × 2) phase, curve c, is inconsistent with the measured spectrum and is characterized by a broad intense primary peak that is aligned with a minima in the measured spectrum. The various forms of unreconstructed chemisorbed atomic oxygen are shown in Fig. 6, where the experimental spectrum has been reproduced as curve (a) to facilitate comparison. At 1/4 ML coverage on the SB sites (curve b) a strong feature with a high binding energy shoulder can be seen at approximately 528 eV, which is 1 eV below the leading edge of the measured spectrum. Two additional higher energy features also appear, one at 530 eV and the second at 534 eV. The more strongly adsorbed species, 1/4 ML oxygen on the LB sites, shown in curve c retains the features seen for the SB species. However, the intensity of the leading edge is diminished, exposing a new peak at 529 eV. This trend continues with the more strongly adsorbed 1/4 ML FFH species, Fig. 6 curve d, and while further changes can be seen when the coverage is increased to 1/2 ML on the FFH sites, in all cases the calculated O K-edge spectra are inconsistent with the measured spectrum. Thus, by combining O K-edge and XPS spectra we confirm the ab initio thermodynamics prediction that unreconstructed adsorbed atomic oxygen is not present.
We considered that subsurface or bulk dissolved atomic oxygen may be present. Though the subsurface species is predicted to be thermodynamically unstable relative to the clean surface under our experimental conditions, a bulk dissolved species could be stabilized by configurational entropy, which we have ignored in the creation of the surface phase diagram. The subsurface species was modeled by placing 1/4 ML oxygen in the octahedral holes in the first subsurface layer under the Ag(110) surface. The bulk species was modeled by placing a single oxygen atom in an octahedral hole of a 32 atom super cell of bulk silver, (2 × 2 × 2) crystallographic unit cells. The calculated O1s binding energies of the subsurface and bulk dissolved species, 528.4–528.5 eV, agree with the previous assignment of subsurface oxygen in the Ag(110)–O system to an O1s feature at 528.5 eV.8 The calculated values are also close to the measured O1s 528.3 eV. Thus, they cannot be used to confirm the presence or absence of dissolved oxygen in our experiment. We can, however, turn again to XANES.
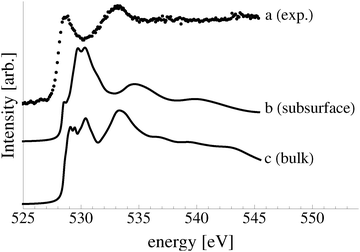
The calculated O K-edge spectra support the conclusion that subsurface oxygen is not present under our experimental conditions, though a low concentration of bulk dissolved oxygen may be. Fig. 7 shows the measured O K-edge spectrum, curve a, along with that calculated for atomic oxygen in a subsurface octahedral hole of the (110) surface, curve b, and bulk dissolved atomic oxygen, curve c. The primary absorption of the subsurface species can be seen to appear at 530 eV, in line with a minimum in the measured spectrum. The spectrum of bulk dissolved oxygen is characterized by two primary absorptions, one at approximately 529 eV and the second at 534 eV, in qualitative agreement with the absorptions in the measured spectrum. The low energy peak in the calculated spectrum is, however, composed of a doublet and singlet and it is substantially wider than what is observed experimentally, suggesting that, at most, a low concentration of bulk dissolved oxygen is present.
It is clear from Fig. 7 that the electronic structures of bulk dissolved and subsurface oxygen are different. This difference raises the natural question of how deep below the surface atomic oxygen must be before its electronic structure is like that of bulk dissolved oxygen. We found that when the oxygen is in the third subsurface layer under an Ag(111) surface its O K-edge spectrum is nearly identical to that of bulk dissolved oxygen. Thus, such “bulk” species could be observed in XPS and AEY XANES measurements, which are only sensitive to the top few layers of the silver surface.
4.4 Phase diagram
Through XPS alone we are unable to distinguish between a number of oxygen species on the Ag(110) surface. Through the combination of XANES and XPS, however, we are able to show that when an Ag(110) surface is placed under 10−4 mbar O2 pressure at 423 K the surface is covered with an oxygen species consistent with oxygen in a p(2 × 1) reconstruction, as predicted by the full DFT ab initio atomistic thermodynamics. Because the c(6 × 2) phase is not present we can confirm our earlier assertion that using the experimental O2 binding energy as part of the O2 reference state in the ab initio atomistic thermodynamics calculations leads to an overestimation of the stability of adsorbed oxygen phases on the Ag(110) surface. The better performance of the full DFT results is likely due to the fact that the oxygen adsorption energies are also overestimated, though perhaps to a lesser degree than the O2 binding energy.105 As a result, the full DFT approach offers some error cancelation and more reliable phase diagrams than using the mixed O2 reference state.With a suitable reference state determined we can now develop the (P,T) phase diagram of the Ag(110)–O system to facilitate comparison with experiment (see Fig. 8). This (P,T) phase diagram can also be used to estimate error bars by comparing to the known bulk dissociation pressure of Ag2O,16 which is the O2 pressure, at a given temperature, required for the bulk metal and bulk oxide to be in thermodynamic equilibrium.106 The inspection of Fig. 8 reveals that at 460 K the bulk oxide is predicted to become thermodynamically unfavorable at pressures below approximately 103 bar, as compared to approximately 1 bar experimentally.107 At 820 K the experimental dissociation pressure is approximately 103 bar, and though it is not shown in the figure, the predicted pressure is 106.5 bar, leading to a difference of 103.5 bar, whereas at 320 K the predicted dissociation pressure is only 101.5 bar above experimental results.106 This temperature dependence of the difference in dissociation pressure is likely due to the fact that the entropic contributions that have been neglected when creating Fig. 8 increase at higher temperature. From this comparison we can conclude that the equilibrium phase diagram calculated using the full DFT results likely underestimate the thermal stability of the surface reconstructions at the temperatures used in this study by approximately 103 bar, in agreement with the pressure error found in ref. 16.
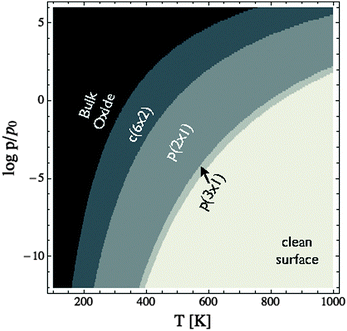 | ||
| Fig. 8 (P,T) phase diagram of the Ag(110)–O system calculated using the total energy of the isolated O2 molecule calculated by way of DFT as the O2 reference state. | ||
To further verify the predicted error in the ab initio (P,T) phase diagram of the Ag(110)–O system we performed experiments wherein the Ag(110) surface was exposed to 10−2 mbar O2 pressure at 423 K. Like under 10−4 mbar O2 pressure, exposure to the higher pressure results in the appearance of a feature at 528.3 eV in the O1s spectrum. However, under the higher pressure conditions, the oxygen coverage increases to approximately 0.67 ML, as determined by the O/Ag ratio, coincident with the c(6 × 2) added-strand reconstruction. Inspection of Fig. 8 reveals that at 423 K the c(6 × 2) phase does not become stable until the O2 pressure exceeds 10−2.5 bar. Thus, the correct phase is only predicted if a pressure correction of at least 102.5 bar is included, thereby establishing a minimum value for the pressure correction at 423 K. We can also identify a maximum error in pressure by noting that at 423 K under 10−4 mbar O2 pressure the p(2 × 1) phase was dominant, implying a maximum error of 104 bar, in good agreement with the originally proposed 103 bar error at 423 K.
This phase diagram indicates that the equilibrium phases of the Ag(110)–O system will appear at approximately 528.5 eV in the O1s spectrum, suggesting that the species giving rise to the small features at 529.2 eV and 530.3 eV in Fig. 4 could be contaminants or some other species not associated with an equilibrated Ag(110)–O system. Although these species are only minor components in our experiment, the feature at 529.2 eV is typically assigned to the “Oγ” species that is thought to participate in the partial oxidation of methanol108–110 and the position of the feature at 530.3 eV is consistent with the electrophilic oxygen species that participates in alkene epoxidation, both of which can be prepared on Ag(110) foils.24 While at this point we cannot identify the atomic structure of these species, the data presented herein makes the widely accepted assignment of electrophilic oxygen to chemisorbed atomic oxygen appear dubious. In addition to the low O1s binding energy of unreconstructed atomic oxygen, the calculated O K-edge spectra of unreconstructed atomic oxygen do not resemble that measured for electrophilic oxygen, which is characterized by a single broad absorption at 541 eV due to O p and Ag sp mixing.10 Instead, all atomic oxygen species on silver have strong features near the Fermi energy level, which are caused by O p states mixing with Ag sd levels.
4.5 Summary of Ag(110) surface
In summary, ab initio atomistic thermodynamics predict that under an oxygen atmosphere the Ag(110) surface is covered in a series of oxygen induced surface reconstructions. These predictions are verified by the measured and calculated XPS and XANES. We find no evidence for the presence of unreconstructed atomic oxygen adsorbed on the surface, nor are the spectroscopic features of such a species in agreement with the electrophilic oxygen thought to participate in alkene epoxidation on silver.Because the activity and selectivity of the Ag(110) surface as an ethylene epoxidation catalyst are similar to those of the Ag(111) surface,111 and the Ag(111) surface will likely be the dominant crystallographic surface on powders owing to its lower surface free energy, it is worthwhile to see if these results are specific to the (110) face.
5 Ag(111) surface
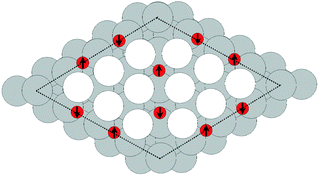
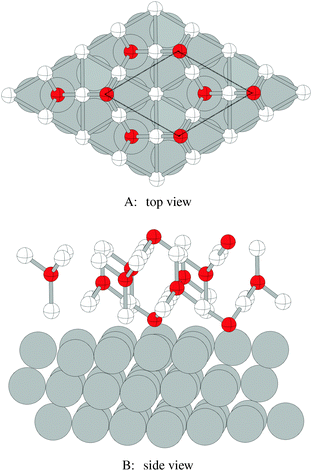
Despite the low dissociative sticking coefficient of oxygen on the Ag(111) surface, a variety of adsorbed oxygen species are known to form, and the close packed facet is catalytically active.111 The most well studied of these surface oxygen species from an experimental perspective is the p(4 × 4) surface reconstruction that was first found in 1972 by dosing an Ag(111) surface with high O2 pressure.112 This finding sparked a great deal of interest in the Ag(111)–O system, as (111) planes are likely to be the dominant facets under catalytic conditions.32 As a result, the p(4 × 4) reconstruction is one of the most well studied in the silver oxygen system, though its structure was not fully resolved until 2006.25,26It is now known that the p(4 × 4) phase is part of a family of surface reconstructions formed by a structural motif that consists of two six-member silver triangles. One of these triangles sits on the fcc sites of the (111) surface, the other sits on the hcp hollow sites. Two oxygen atoms lie between neighboring triangles as shown in Fig. 9.27 The silver atoms in the Ag6 triangles are shaded white in this figure to distinguish them from the underlying silver surface, which is shaded grey. The unit cell is indicated by the way of a black dashed line. The oxygen atoms (red circles) on the edges of the Ag6 triangles occupy two symmetry unique positions, one above the Ag6 plane and its neighbor below the plane. The up arrows label the oxygen atoms that lie above the Ag6 plane, and the down arrows show the oxygen atoms that lie below the Ag6 plane.
5.1 Thermodynamics
We found that the p(4 × 4) phase is thermodynamically favorable at low oxygen chemical potential (see the thick solid blue line in Fig. 10A and B). The thick blue dashed line shows an older model of the p(4 × 4) reconstruction of slightly higher energy that appears throughout the literature113 (see Appendix A). The thin solid lines in the figure show the surface free energy of 1/16 and 1/4 ML coverages of adsorbed oxygen, while the thin dotted lines show the surface free energy of three types of subsurface oxygen that will be discussed in Section 5.3, and the dashed lines represent the surface free energy of thin oxide-like layers, the details of which are discussed in Section 5.4.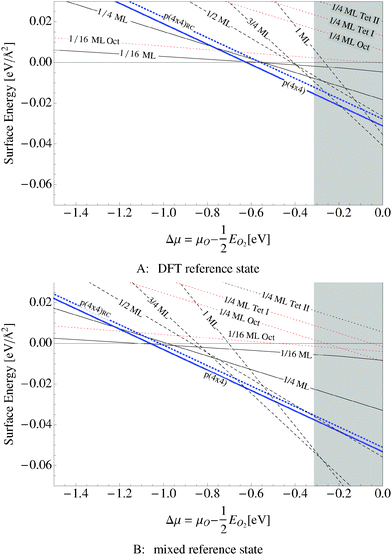 | ||
| Fig. 10 Surface free energies for various oxygen species on the Ag(111) surface computed using two different O2 reference states: the total energy of an isolated O2 molecule calculated by way of DFT and two times the energy of an oxygen atom plus the experimental O2 binding energy. The grey box shows the range of oxygen chemical potential over which the bulk oxide, Ag2O, is stable. The thick blue solid line represents the surface free energy of the p(4 × 4) surface reconstruction and the thick dotted blue line represents the surface free energy of an alternative p(4 × 4) surface reconstruction.16,17 The black dashed line corresponds to an oxide like layer, while the solid black lines are chemisorbed atomic O and thin dotted lines are dissolved atomic O. | ||
The grey shaded region indicates the chemical potential at which the oxide, Ag2O, becomes thermodynamically stable. The top panel in Fig. 10 was computed using the total energy of an isolated O2 molecule calculated within DFT as the reference energy. The bottom panel, Fig. 10B, employs the alternate O2 reference state–twice the energy of the isolated oxygen atom plus the experimental O2 binding energy.
Regardless of the choice of the O2 reference state, our findings suggest that the p(4 × 4) reconstruction is the only stable phase in the oxygen poor limit, save for chemisorbed oxygen at or below 1/16 ML coverage, in excellent agreement with STM experiments showing that when the concentration of adsorbed oxygen exceeds 0.05 ML on the Ag(111), islands of the p(4 × 4) reconstruction begin to form.114 Although changing the O2 reference state shifts the free energy curves almost rigidly, this behavior is not an artifact of the possible overbinding of the O2 molecule introduced by the PBE exchange and correlation potential. By way of example, the full DFT result, top panel of Fig. 10, predicts that the p(4 × 4) phase is the thermodynamically stable phase in the range of −0.6 eV < ΔμO < −0.3 eV. At higher oxygen chemical potentials Ag2O becomes stable, whereas at ΔμO ≈ −0.6 the 1/16 ML adsorbed O phase becomes energetically competitive with the p(4 × 4) phase as the system transitions to the clean surface. When the experimental binding energy of O2 is employed instead of the full DFT reference state, see Fig. 10B, the p(4 × 4) phase is favorable at significantly lower oxygen chemical potentials, down to ΔμO ≈ −1.0 eV. However, as before, the 1/16 ML adsorbed O phase becomes energetically competitive before the clean surface, in this case at ΔμO ≈ −1.0. In these two cases the relative stability of the phases does not change.
When the oxygen chemical potential is near the experimental heat of formation of the bulk oxide the two O2 reference states yield qualitatively different results. The full DFT approach predicts that the p(4 × 4) phase is thermodynamically stable until the oxygen chemical potential reaches the heat of formation of the bulk oxide. In this case the thin oxide-like structures may be metastable, but they do not appear on the equilibrium phase diagram. When the experimental O2 binding energy is employed as part of the O2 reference state, a series of thin oxide-like surfaces become the stable phases when ΔμO rises above −0.6 eV. These phases transition into the bulk oxide when ΔμO equals the heat of formation of Ag2O. The enhanced thermodynamic stability of the thin oxide-like phases has previously been proposed in ref. 106 when the experimental O2 binding was employed in conjunction with DFT energies for the oxide-like surfaces. In contrast, the lack of thin oxide-like phases on the equilibrium phase diagram is consistent with the calculated phase diagram found using an O2 reference state calculated by way of DFT in ref. 16 and 17. At the present time we do not have sufficient experimental evidence to support either prediction, but since our results on the Ag(110) surface suggest that the experimental binding energy of O2 significantly overestimates the stability of adsorbed oxygen, we have chosen to focus on the full DFT results.
To facilitate comparison with experiment we have replotted the full DFT phase diagram as a function of (P,T) in Fig. 11. Recall from Section 4 the pressure is likely underestimated by 103 bar in the phase diagram of the Ag–O system derived using ab initio atomistic thermodynamics when the vibrational and configurational entropy contributions to the surface free energy are ignored. Despite this error, our findings suggest that the p(4 × 4) reconstruction is the only stable phase in the oxygen poor limit, save for the possibility that chemisorbed oxygen at or below 1/16 ML coverage may be stable to <5 K above the p(4 × 4) reconstruction. These findings are in agreement with Temperature Programmed Desorption (TPD) experiments indicating that the p(4 × 4) phase desorbs as one peak, see for instance Fig. 1 in ref. 9, or possibly two peaks within ≈10 K of one another, see Fig. 7 in ref. 115 and 116, leaving the clean surface. As a further test of the reliability of Fig. 11 we prepared the p(4 × 4) reconstruction, as confirmed by XPS and XANES.
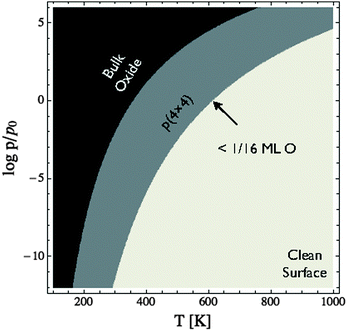 | ||
| Fig. 11 Phase diagram for the Ag(111)–O system calculated using the full DFT results shown in Fig. 10. Note that chemisorbed oxygen at 1/16 ML coverage (or below) is energetically competitive with the p(4 × 4) reconstruction only at oxygen chemical potentials where the reconstruction and chemisorbed atomic oxygen become unstable relative to the clean surface. | ||
5.2 Chemisorbed reconstructed and unreconstructed oxygen
To elucidate only those species present on the Ag(111) surface under in situ conditions we exposed a clean Ag(111) surface to 4 × 10⁻⁴ mbar O2 pressure at 423 K. Fig. 11 reveals that the ab initio atomistic thermodynamics calculations predict that, under these conditions, the p(4 × 4) reconstruction is marginally stable when the pressure correction of 103 bar found in Section 4.4 is taken into account. If the pressure correction is ignored the clean surface is predicted to be stable, though we cannot rule out the possibility of a low concentration (<1/16 ML) of adsorbed oxygen. In order to identify which of these phases is present we can turn to spectroscopic measurements.
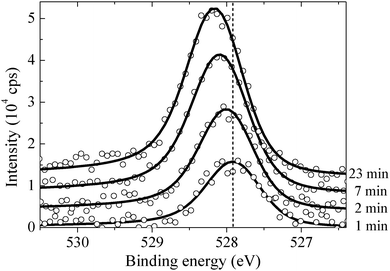
By measuring the XPS at a fast scan rate we found that during the first minute of O2 dosing at 423 K an oxygen species with an O1s binding energy of 527.95 eV appeared in the measured spectrum, see Fig. 12, which shows the O1s spectrum after 1, 2, 7 and 23 minutes of O2 dosing. The O1s binding energy of this species lies between what we have calculated for unreconstructed chemisorbed atomic oxygen and oxygen in the p(4 × 4) reconstruction. The experimentally measured O/Ag ratio of approximately 0.05 ML (see Fig. 13) reveals that this state has an oxygen coverage close to the 1/16 ML thermodynamic limit calculated for unreconstructed atomic oxygen, suggesting that the species observed at 527.95 eV is unreconstructed atomic oxygen.
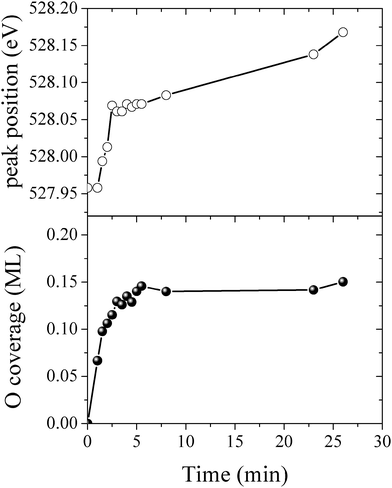 | ||
| Fig. 13 The O/Ag ratio (top) and the O1s peak position (bottom) measured as a function of time for the Ag(111) surface exposed to 4 × 10⁻⁴ mbar O2 pressure at 423 K. | ||
After five minutes of additional O2 exposure the oxygen coverage increases to approximately 0.15 ML, which can be seen in the plot of the O/Ag ratio as a function of dosing time shown in Fig. 13 (top). The bottom panel of Fig. 13 shows the position of the center of the O1s peak at the corresponding times. Comparing the two panels reveals that the increase in oxygen coverage is mirrored by an increase in the O1s binding energy towards the value calculated for oxygen in the p(4 × 4) phase (see Fig. 13). We interpret this increase in oxygen coverage and O1s binding energy as a transition from atomic oxygen chemisorbed on the unreconstructed Ag(111) to a surface covered with islands of the p(4 × 4), or similar reconstructions (see ref. 27).
After 48 minutes of treatment under 4 × 10⁻⁴ mbar O2 pressure at 423 K the oxygen coverage reaches 0.19 ML and the primary O1s feature shifts to 528.2 eV, as shown in Fig. 14. Two additional peaks that were either not present, or not resolved, at a fast scan rate needed to follow the dynamics can also be seen in the O1s spectrum. The minor components of the spectrum appear as a shoulder on the high binding energy side of the main feature fit with a gaussian at 529.1 eV, an O1s binding energy consistent with the bulk oxide, Ag2O, and a peak at 530.4 eV that is well removed from the main O1s feature.
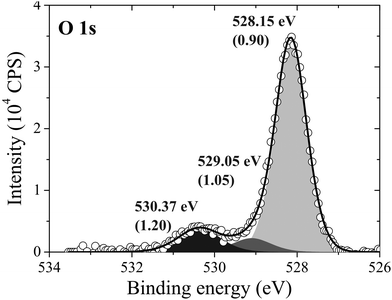 | ||
| Fig. 14 The measured O1s spectrum of Ag(111) after dosing oxygen for 48 minutes at 423 K and 10−4 mbar O2 pressure. | ||
Comparing the calculated O1s binding energies of unreconstructed chemisorbed atomic oxygen and oxygen in the p(4 × 4) reconstruction with the measured O1s spectrum reveals that the reconstruction is consistent with the experimental results obtained after 48 minutes of O2 treatment. Our calculated O1s binding energy for chemisorbed atomic oxygen reaches a maximum of 527.6 eV at 1/16–1/4 ML coverage, see Table 1, dropping to 527.1 eV at higher coverages. It is worth noting that at 1/2 ML coverage adsorbed atomic oxygen becomes ferromagnetic with a total magnetization of 1.1 μB for the (2 × 2) surface unit cell. However, including spin-polarization has a negligible effect on the O1s binding energy, increasing it to 527.4 eV. At lower oxygen coverage the adsorbed atomic oxygen does not acquire a magnetic moment. Thus, at the 0.19 ML coverage we observed experimentally, our calculations predict that if this state were composed entirely of unreconstructed atomic oxygen, it would give rise to an O1s feature 0.3 eV below the measured value of 528.2 eV. However, this small difference in O1s binding energies lies within the 0.3 eV error we estimated for the ΔSCF approach, making definitive assignment problematic. This ambiguity can be removed by exploiting the O K-edge spectrum of the oxygen treated Ag(111) crystal.
While these findings demonstrate that, with the 103 bar pressure correction, Fig. 11 correctly predicts that the p(4 × 4) phase is present at 423 K under 4 × 10⁻⁴ mbar O2 pressure, it does not allow us to identify the minor components in the XPS spectrum. Elucidating the atomic structure of the species appearing at 529.1 eV and 530.3 eV in Fig. 14 is of particular importance as the latter has an O1s binding energy consistent with electrophilic oxygen and the binding energy of the former is close to that of the bulk oxide, Ag2O. Recall from the introduction that both electrophilic oxygen10,11,21,22 and the bulk oxide39–41 have been postulated to play an important role in ethylene epoxidation. But because these species may not appear on the equilibrium phase diagram, to identify candidate structures we must turn to the calculation of the spectroscopic properties of different Ag–O species.
Focusing first on structures that were enumerated in the development of the phase diagram shown in Fig. 10, we see that we must consider species that may be present at locally higher concentrations of oxygen. At lower oxygen chemical potentials, only low coverages of chemisorbed atomic oxygen are predicted to be stable. At higher oxygen chemical potentials the thin oxide-like surfaces are the most stable surface structures. To form such an oxide-like layer, subsurface oxygen must be present. While Fig. 10 shows that subsurface oxygen is thermodynamically unfavorable under the experimental conditions, it may still appear as a transient species during the formation of a thin oxide-like layer. As previously noted, subsurface oxygen is widely believed to give rise to the feature at 530 eV in the O1s spectrum.24 While we have already shown that this statement is not true for oxygen beneath the Ag(110) surface, oxygen below an Ag(111) surface may give rise to higher O1s binding energies due to the different types of holes present, as discussed in the next section.
5.3 Subsurface atomic oxygen
Three types of subsurface oxygen can appear beneath the pristine Ag(111) surface because of the three symmetry unique holes. Oxygen can dissolve in the octahedral hole as shown in Fig. 16A, or in one of the two types of tetrahedral holes, denoted types I and II. The type I hole is shown in Fig. 16B and is simply the hole beneath the hcp hollow site. The type II tetrahedral hole can be seen to be under the surface atom, Fig. 16C.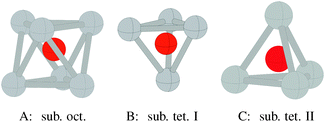 | ||
| Fig. 16 Geometry of oxygen dissolved in the subsurface octahedral hole (A) and the type I (B) and type II (C) tetrahedral holes under an Ag(111) surface. | ||
As may be expected based on the radius ratio of silver to oxygen, dissolving oxygen in the octahedral hole is energetically favored over the type I or type II holes at all oxygen coverages between 1/16 and 1 ML. The type I tetrahedral hole is energetically favored over the type II hole at all coverages below 1 ML.19Fig. 10 shows that subsurface oxygen is thermodynamically unfavorable over almost the entire range of allowed oxygen chemical potential, as seen from the three dotted lines of highest energy in the plot. The surface free energy of a surface with 1/4 ML subsurface oxygen can be seen to be positive relative to gas phase O2 and the clean silver surface, for ΔμO below the heat of formation of the bulk oxide, while 1/16 ML subsurface octahedral oxygen has a negative surface free energy relative to gas phase O2 and the clean silver surface down to ΔμO ≈ −0.5 eV.
The calculated O1s binding energy of dissolved oxygen ranges from 528.2 eV in the type II hole to 528.7 eV in the octahedral hole. This finding shows that subsurface oxygen does not give rise to the O1s signal at 530.4 eV commonly attributed to dissolved oxygen. However, considering the 0.3 eV error margin we estimate for the ΔSCF approach, oxygen in the octahedral or type I hole could be attributed to the small O1s feature at 529.1 eV in Fig. 14. Moreover, subsurface oxygen could be attributed to an oxygen species with an O1s binding energy of 529.1 eV seen on silver powders exposed to 0.25 mbar O2 pressure at 453 K for 1–8 hours in ref. 24 and the Oγ species formed on Ag(111) single crystals after high temperature treatment (T > 700 K) under 1 bar O2 pressure for 7 hours in ref. 108 and 117. However, the apparent thermodynamic stability of the oxygen species in ref. 24, 108 and 117 casts some doubt on the assignment of those features to subsurface oxygen.
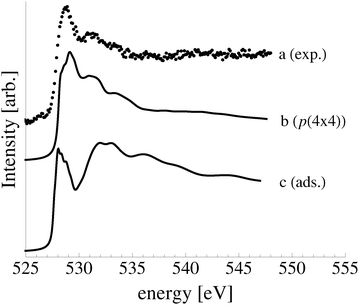
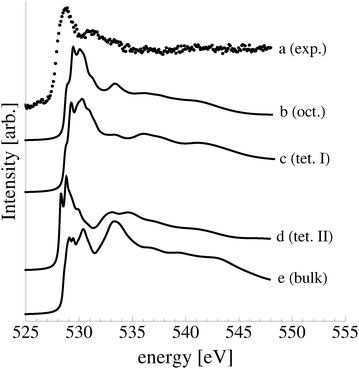
The calculated O K-edge spectra of the subsurface species support the conclusion drawn from ab initio atomistic thermodynamics and the O1s binding energies that a high concentration of subsurface oxygen was not present under our experimental conditions (see Fig. 17). Oxygen in both the octahedral (curve b) and type I tetrahedral holes (curve c) produces a strong absorption doublet at 531 eV in the O K-edge spectrum, whereas the experimental spectrum displays a minimum (curve a). Like the experimental spectrum, however, only small features appear above the absorption threshold in the calculated O K-edge spectra of dissolved oxygen. Oxygen in the type II tetrahedral hole (curve d) is also inconsistent with the measured spectrum. The spectrum of the dissolved species has a doublet centered at 529 eV and an additional moderate feature at 534 eV, similar to the calculated spectrum of bulk dissolved oxygen (curve e), which has a strong feature at 534 eV.
Together these findings demonstrate that only a small concentration of subsurface dissolved oxygen may be present when an Ag(111) single crystal is exposed to 4 × 10⁻⁴ mbar O2 pressure at 423 K for 48 minutes, if any.
5.4 Oxide like layers and bulk oxide
The atomic structure and energetics of the thin oxide-like layers that may become metastable when the oxygen chemical potential approaches the bulk oxide heat of formation have been discussed in detail in ref. 16 and 106. To briefly recapitulate, these thin oxide-like layers form when both chemisorbed and dissolved oxygen are present. The adsorbed oxygen sits on the fcc surface hollow sites, and the dissolved oxygen is present in the adjacent type I and type II tetrahedral holes. (Note that a similar structure can also be formed when atomic oxygen adsorbs in the hcp hollow site and simultaneously dissolves in the subsurface octahedral holes.16 However, its spectroscopic properties are not appreciably different from the structures described herein.) This results in the formation of O–Ag–O trilayers which are commensurate with bulk Ag2O that has been compressed by 14% laterally and expanded by 21% vertically. The thinnest of these is shown in the top panel of Fig. 18. Here 1/4 ML atomic oxygen chemisorbs on the fcc hollow site and 1/4 ML oxygen dissolves in a type I tetrahedral hole to form the linear O–Ag–O chain involved in the trilayer, yielding a structure with an effective oxygen coverage of 1/2 ML. While our ab initio atomistic thermodynamic calculations predict that this structure will not be thermodynamically competitive with the p(4 × 4) phase, thicker oxide-like layers may become metastable at higher oxygen chemical potentials, as discussed in Section 5 and shown in Fig. 10.These potentially metastable structures are formed by dissolving more oxygen in the type I and type II tetrahedral holes. For instance, introducing an additional 1/4 ML oxygen in the type II tetrahedral holes forms a three layered structure with an effective coverage of 3/4 ML. Fig. 10A shows that, when using the DFT reference state for O2, this structure is predicted to have a lower surface free energy than the p(4 × 4) reconstruction when ΔμO > −0.2 eV. Increasingly the thickness of the trilayer structures formed by alternatively filling the type I and type II tetrahedral holes, like the four layered structure shown in the bottom panel of Fig. 18, may make the structures metastable at high oxygen chemical potentials. These structures have been shown to reach a maximum thickness of approximately 9 trilayers, after which Ag2O will be formed.16
As these oxide-like layers are predicted to become thermodynamically competitive with the p(4 × 4) reconstruction only at oxygen chemical potentials capable of stabilizing the bulk oxide, we compare the calculated spectroscopic features of these oxide-like layers to those we measured for the bulk oxide, Ag2O, in Fig. 19.
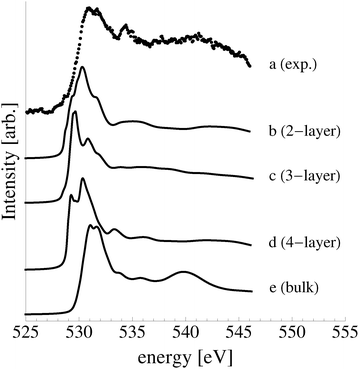 | ||
| Fig. 19 Measured O K-edge spectrum of Ag2O (a). The calculated O K-edge spectra of two (b), three (c), and four (d) layer oxide-like structures on the Ag(111) surface. | ||
At 1/2 ML coverage the surface oxygen atoms have a calculated O1s binding energy of 528.6 eV and that of the oxygen in the type I hole is 529.1 eV as compared to the 529.2 eV measured for the bulk oxide, see the entry “Oxide-like Layers (111)” in Table 1 for a summary. Further increasing the concentration of subsurface oxygen to yield the structure with an effective oxygen coverage of 3/4 ML increases the calculated O1s binding energy of the on-surface oxygen to 528.9 eV and that of the first layer of subsurface oxygen to 529.2 eV. The oxygen in the type II tetrahedral hole has a calculated O1s binding energy of 528.2 eV, as can be seen in Table 1.
A further increase in the concentration of subsurface oxygen to 1 ML results in the subsurface species appearing at 529.1 eV in the calculated O1s spectrum and the chemisorbed oxygen remaining at 528.9 eV, nearly equivalent to the 529.2 eV measured for the bulk oxide. However, we found that oxygen on the oxygen terminated Ag2O(001) surface has an exceptionally low O1s binding energy, 526.8 eV, and only those oxygen atoms in the subsurface of the bulk oxide appear at 529.1 eV, in agreement with ref. 118, see the entry “Oxygen on Ag2O(001) surface” in Table 1.
Despite the similarity between the O1s binding energies of oxygen in the bulk of Ag2O and the oxide-like layers on the Ag(111) surface, the bonding in the oxide-like layers is distinct from that in the bulk oxide, which gives rise to differences between the calculated O K-edge spectra of these systems. Curve (a) in Fig. 19 shows the O K-edge spectrum of Ag2O measured in total electron yield (TEY). The calculated O K-edge spectra of the 2-layer (curve b), 3-layer (curve c), and 4-layer (curve d) oxide-like structures are also shown, along with that calculated for bulk Ag2O (curve e). A strong absorption doublet can be seen at approximately 531 eV in the measured spectrum along with two minor absorptions, one at approximately 534 eV and one at 537 eV. The calculated spectrum of bulk Ag2O (curve e) can be seen to reproduce all of these features. While the oxide-like layers all have a strong near threshold absorption from O p and Ag d mixing, the spectra are distinct from that of Ag2O. The spectrum of the two-layer oxide-like structure can be seen to have a broad absorption centered at 531 eV. The discrepancy with the Ag2O spectrum highlights the fact that the bonding in the two layer structure does not resemble the bulk oxide, as the subsurface oxygen is bound to inequivalent silver atoms.106 When a third layer of oxygen is introduced, the bonding remains distinct from Ag2O, though a strong doublet appears in the calculated spectrum. However, the intensity ratio and peak positions in the spectrum of the 3 layer-oxide like structure are shifted from that found for Ag2O. Including a fourth layer of oxygen in the oxide-like-layers leads to further changes in the calculated O K-edge spectrum, with a change in the relative intensities of the absorption in the leading edge doublet and the appearance of a feature at 534 eV, demonstrating that the oxygen bonding is slowly converging to that seen in Ag2O. Thus, bonding in the oxide-like layers is discernible from bonding in bulk Ag2O.
At this point, it is useful to summarize the results we have found for the Ag2O(001) surface and the thin oxide-like layers on the Ag(111) surface. While the oxygen chemical potential in our experiments on the Ag(111) surface was not high enough to stabilize the oxide-like layers, experiments performed at higher oxygen chemical potential may do so.24 The presence of the thin oxide-like layers with coverages of 1/2–1 ML will lead to the appearance of features at approximately 529 eV in the O1s spectrum. Features in this range have been reported from in situ studies performed under 0.25 mbar O2 pressure and temperatures of 450–500 K,11,24,108–110 though they are typically associated with the “Oγ” species formed after exposing silver to 1 bar O2 pressure for many hours at temperatures above 780 K.108–110 While the calculated phase diagram in Fig. 11 casts doubt on such an assignment, our O K-edge calculations suggest that the presence of a thin oxide-like layer may be discernible from the O K-edge spectrum. Regardless, both the simulated XPS and XANES demonstrate that such an oxygen species is not the electrophilic oxygen that has been shown to correlate with ethylene oxide production.10,11,20–22
5.5 Defects
As none of the O1s binding energies calculated for dissolved and adsorbed oxygen on or in a pristine Ag(111) crystal can be attributed to electrophilic oxygen, we also investigated the role of defects. It has been previously suggested that such sites play an important role in the catalytic properties of silver18,113,119,120 and may also act as traps for dissolved oxygen.121We begin by considering vacancies. It has been known for long that there is a strong interaction between oxygen atoms and silver vacancies, which makes surface vacancy formation facile122 and could give rise to a thermally stable substitutional oxygen species.121,123,124 In particular, STM data were used to argue that surface substitutional oxygen is present in a  array on the Ag(111) surface after high temperature/high O2 pressure treatment.119 We will denote this structure simply as
  . This species was later argued to give rise to a feature at 529.0–529.3 eV in the O1s spectrum, which dominates the spectrum after silver is being treated with 1 bar O2 pressure at temperatures greater than 770 K for many hours.108,110,117
In agreement with the hypothesis that a  substitutional oxygen phase forms at high temperature, ref. 18 found that the adsorption energy of substitutional atomic oxygen reaches a maximum on a
  array. However, the adsorption energy is nearly identical to that of chemisorbed oxygen on the pristine surface at the same 1/3 ML coverage. Our calculations are in agreement with those of ref. 18, suggesting that, like other high coverage phases of chemisorbed atomic oxygen, oxygen chemisorbed on a
  vacancy array will not be thermodynamically favorable under any ΔμO. It still may be present as a transient species, however, and will gain additional stability from configurational entropy at higher temperatures due to the fact that the substitutional oxygen sits at the center of the
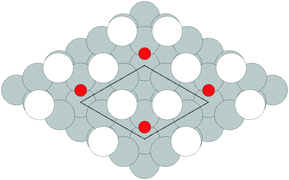
  vacancy array, resulting in three equivalent adsorption sites (see Fig. 20).
The calculated O1s binding energy of the  array of substitutional oxygen shows that this species was not that observed in ref. 108, 110, 117 and 119. We calculated an O1s binding energy of 527.9 eV, which is close to that found for a low coverage of chemisorbed atomic oxygen on the pristine surface, but significantly lower than that of 1/3 ML atomic oxygen on the pristine Ag(111) surface. This difference is, in part, due to the fact that when oxygen sits on a surface vacancy its charge is screened by the neighboring silver atoms. Therefore, the high concentration of oxygen does not significantly alter the O1s binding energy, unlike on the pristine surface where the charge on neighboring oxygens is not screened, which tends to reduce the calculated O1s binding energy at high coverages, Table 1.
While the O1s binding energy of the surface substitutional is like that of a low coverage of unreconstructed atomic oxygen adsorbed on the Ag(111) surface, the O K-edge spectrum of oxygen in a  vacancy array is not (see curve (b) in Fig. 21). Instead, the O K-edge spectrum of the surface substitutional is characterized by a strong doublet centered at 529 eV in the O K-edge spectrum and a second minor absorption at 535 eV, whereas unreconstructed chemisorbed oxygen has strong features at 529 eV and 533 eV. Comparing the calculated O K-edge spectrum of the surface substitutional to that measured for oxygen on the Ag(111) surface, curves (a) and (b) in Fig. 21, suggest that a high concentration of the surface substitutional species was not present during our experiments.
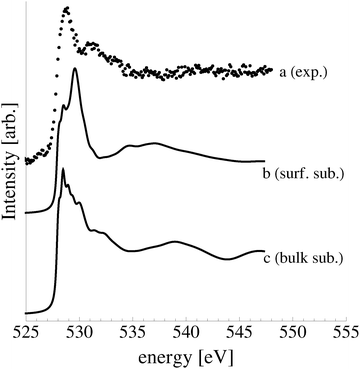 | ||
Fig. 21 The measured spectrum for Ag(111) exposed to O2 (a). The O K-edge spectrum of surface substitutional oxygen with  periodicity (b) and of bulk substitutional oxygen (c). periodicity (b) and of bulk substitutional oxygen (c). | ||
Steps are another important class of surface defect that may adsorb oxygen. We considered how a (110) step on the Ag(111) surface would alter the O1s binding energy. This step was chosen due the fact that these defects have been identified in the Ag–O system through the use of aberration corrected Transmission Electron Microscopy (TEM).120 Furthermore, DFT calculations have shown that oxygen binds strongly in the edge of a (110) step,120 as shown in Fig. 22. The O1s binding energy of this species is, however, only 527.8 eV, in the same range as all other types of adsorbed unreconstructed atomic oxygen, forcing us to conclude that chemisorbed atomic oxygen will not appear at or above 530 eV in the O1s spectrum, even in the presence of defects.
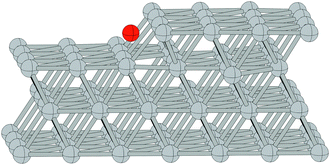 | ||
| Fig. 22 Oxygen in the edge of a (110) step on a (111) surface. The silver atoms are shaded grey and nearest neighbor bonds are shown. The adsorbed oxygen atom is shaded red. | ||
We can also examine bulk, as opposed to surface, defects. To begin, consider substitutional oxygen. Such species have been postulated to serve as oxygen diffusion channels during high temperature oxygen treatment of large-grain high-purity silver121 and silver powders.109 This species, like the surface substitutional, is often aruged to appear at approximately 529 eV in the O1s spectrum. We modeled the bulk substitutional as a 31 silver atom supercell with a single substitutional oxygen and found that, like on the surface, it is energetically favorable for the substitutional oxygen to displace off the silver lattice site. And again, like the surface substitutional, we found an O1s binding energy of 527.9 eV.
The calculated O K-edge spectrum of the bulk substitutional species is shown in curve (c) of Fig. 21. Comparing it to our measured O K-edge spectrum reveals that the bulk substitutional was likely not the dominant species during our experiment. While the calculated spectrum has primary absorption consistent with the measured spectrum, its shape is not in excellent agreement. Based on spectroscopy alone, however, we are unable to dismiss the possibility that a fraction of the measured O1s and O K-edge spectra could be due to dissolved substitutional oxygen near the silver surface.
In polycrystalline samples, another important type of defect will be present. Grain boundaries are thought to be the dominant path for oxygen diffusion in the silver lattice.121 Though our experiments in this work were performed on single crystals, industrial catalysts are typically made using high surface area powders. As such, it is worthwhile to consider the effect of grain boundaries on the spectroscopic properties of dissolved oxygen in silver.
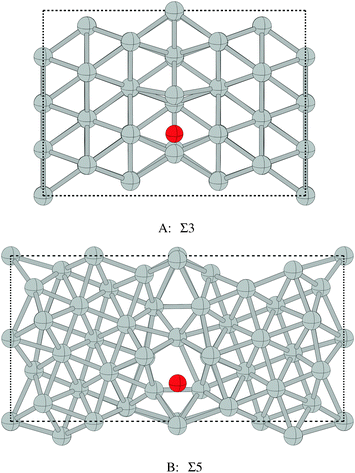
We calculated the O1s binding energies of two concentrations of oxygen in a Σ3 and Σ5 grain boundary in silver. The Σ3 grain boundary was modeled using a 96 silver atom supercell built with 6, 16 atom, Ag(111) layers. This grain boundary is shown with a single dissolved oxygen in Fig. 23A. The twin boundary can be seen to run down the center of the cell. In this case, 1/16 of the octahedral holes at the grain boundary contain an oxygen atom, yielding an effective coverage of 1/16 ML on the grain boundary, which we will refer to simply as a 1/16 ML coverage. A second coverage of 1/8 ML was also investigated. The more open Σ5 grain boundary was modeled with the 80 atom supercell shown in Fig. 23B. Again, the boundary can be seen to run down the center of the cell. Including a single oxygen atom in this Σ5 grain boundary results in an effective coverage of 1/8 ML. A second coverage of 1/4 ML was also investigated.
At 1/16 ML coverage oxygen in the Σ3 grain boundary has an O1s binding energy of 528.3 eV. When a second symmetry unique oxygen is introduced, increasing the coverage to 1/4 ML, the two atoms have marginally different O1s binding energies, 528.3 eV and 528.5 eV, neither of which approaches the 530 eV commonly accepted for oxygen dissolved in silver.
It should also be noted that the adsorption energy of the 1/16 ML coverage of oxygen in the Σ3 grain boundary is much lower than that of 1/16 ML subsurface oxygen, even when the formation cost of the grain boundary is ignored. Dissolving 1/16 ML oxygen in the Σ3 grain boundary is endothermic by 0.30 eV relative to 1/2 gas phase O2, whereas dissolving 1/16 ML oxygen in the octahedral holes under the pristine Ag(111) surface is 0.02 eV exothermic. As such, the system would prefer to dissolve oxygen under the pristine surface as opposed to at a Σ3 grain boundary. This observation can be rationalized by considering that when oxygen dissolves in the octahedral hole of silver it causes a local expansion of the neighboring silver atoms.19 Near the surface, these neighboring atoms are free to expand, whereas, in the bulk, the silver atoms are constrained by the surrounding lattice. Because the volume of the octahedral holes at the twin boundary is not substantially larger than those in the bulk or subsurface it is energetically favorable to dissolve oxygen in the subsurface. By this logic, we would then expect the more open Σ5 grain boundary to have a higher oxygen adsorption energy.
In point of fact, the adsorption energy for 1/8 ML oxygen at the Σ5 grain boundary is substantially larger than that for 1/16 ML subsurface O. Dissolving an oxygen atom in this more open grain boundary is exothermic by 0.31 eV relative to 1/2 gas phase O2, as compared to the 0.02 eV found for 1/16 ML in the octahedral holes under the pristine Ag(111) surface. Furthermore, increasing the oxygen concentration in the Σ5 grain boundary to 1/4 ML only reduces the adsorption energy by 0.02 eV per oxygen atom. This finding suggests that oxygen will preferentially dissolve in high Σ silver grain boundaries, when present, as opposed to the subsurface, and could help explain the high concentrations of dissolved oxygen found in thermal desorption experiments.125 However, the formation energy of the higher Σ grain boundaries is large.
The grain boundary formation energy, EGBf, is defined as:
| EGBf = Etotal − NAgEAg, | (11) |
Though the Σ5 grain boundary can accommodate more dissolved oxygen than the pristine bulk or subsurface, the O1s binding energies of oxygen dissolved at the grain boundary are still only 528.1 eV, regardless of coverage. Thus, we are forced to conclude that the electrophilic oxygen species is not dissolved atomic oxygen.
6 Conclusions
In an effort to identify the nature of the oxygen species that may be present on silver surfaces under ethylene epoxidation conditions, we performed a large series of ab initio atomistic thermodynamic calculations to identify thermodynamically favorable structures. These calculations showed that, of the structures considered, the well known p(2 × 1) reconstruction of the Ag(110) surface and the p(4 × 4) reconstruction of the Ag(111) surface are thermodynamically favorable at the oxygen chemical potentials relevant for ethylene epoxidation. Chemisorbed atomic oxygen was only found to be thermodynamically favorable under UHV conditions, while oxide-like surfaces may become metastable at oxygen chemical potentials capable of stabilizing the bulk oxide, Ag2O.We verified these predictions by comparing in situ XPS/XANES measurements to the theoretically derived spectra of a variety of oxygen species on the Ag(110) and Ag(111) surfaces. This combination of XPS/XANES allowed us to distinguish between oxygen species with the same O1s binding energy, revealing that, under our experimental conditions, the oxygen on the silver surfaces was present almost entirely in surface reconstructions. The spectroscopic properties of these surface reconstructions are consistent with the nucleophilic oxygen species that participates in the total combustion of ethylene.
Though a high concentration of the electrophilic oxygen species thought to participate in ethylene epoxidation on silver was not present under our experimental conditions, we compared the spectroscopic properties we calculated for all the oxygen species that have been attributed to electrophilic oxygen to previously measured spectra. We found that both the O1s binding energies and O K-edge spectra of all forms of atomic oxygen are inconsistent with the previously measured spectra of electrophilic oxygen. These findings have important implications on the continuing efforts to discover what role various oxygen species may play in ethylene epoxidation.
Appendix
A Alternate p(4 × 4) reconstructions
The stability we predict for the p(4 × 4) phase at low ΔμO relative to chemisorbed oxygen is in slight disagreement with ref. 16 and 17, wherein the authors found that 1/4 ML of adsorbed atomic oxygen is thermodynamically favorable at low ΔμO. We tested to see if this discrepancy was the result of a different choice of the p(4 × 4) phase. When Li et al. developed their phase diagram the accepted view of the p(4 × 4) was a model first proposed by Rovida et al. in ref. 112 and later modified by Carlisle et al.,113 which we will denote as p(4 × 4)RC. This structure, and related structures, has been thoroughly described in ref. 32.The reconstruction first proposed by Rovida et al. can be thought of as an Ag2O overlayer on the Ag(111) surface, while Carlisle et al. suggested that a silver atom must be removed from the overlayer, resulting in the structure shown in Fig. 24. This p(4 × 4)RC reconstruction has previously been shown to have a higher surface energy than many competing p(4 × 4) structures.32
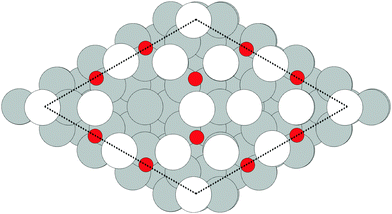 | ||
| Fig. 24 The atomic structure of the p(4 × 4) reconstruction suggested by Carlisle et al.113 The surface silver atoms are shaded white. Oxygen atoms are shown as red and the subsurface silver as grey. The dotted line shows the surface unit cell. | ||
When the O2 reference state calculated by way of DFT, the top panel of Fig. 10, is employed, the surface free energy of the p(4 × 4)RC calculated herein is in excellent agreement with Li et al.'s findings. The p(4 × 4)RC reconstruction has a negative surface free energy down to ΔμO ≈ −0.6 eV. It also remains the most stable phase until the bulk oxide, Ag2O, becomes thermodynamically stable. In contrast, we find that 1/4 ML (1/16 ML) chemisorbed atomic oxygen is unstable when ΔμO is less than −0.5 eV (−0.6 eV), compared to −0.6 eV (−0.7 eV) in ref. 16 and 17. As a result, the p(4 × 4)RC reconstruction is still (slightly) favored over 1/4 ML chemisorbed oxygen at low chemical potentials, in negligible disagreement with the results in ref. 16 and 17. Thus, while the p(4 × 4)RC reconstruction is less stable than the p(4 × 4) reconstruction used in this work over the entire range of oxygen chemical potential, using the p(4 × 4)RC does not qualitatively alter the phase diagram presented herein.
B Bulk Ag2O oxide
In order to compare the core level binding energies obtained by way of the ΔSCF approach to experiment, we are required to have a reference state with a known core level binding energy. We chose bulk silver oxide, Ag2O, for this purpose as there is little doubt about its atomic and electronic structure.127–129Ag2O has the cuprite crystal structure with a unit cell consisting of a fcc silver lattice with an interpenetrating bcc oxygen lattice.127 The silver atoms are linearly coordinated with oxygen atoms and the oxygen atoms tetrahedrally coordinated with silver atoms (see Fig. 25). Experimentally, the lattice constant is found to be 4.72–4.74 Å130–132 close to our calculated value of 4.83 Å. Our calculated lattice constant is also very close to 4.84 Å, found using the PBE functional in ref. 127.
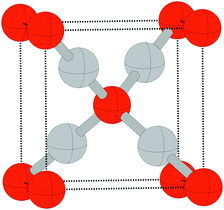 | ||
| Fig. 25 The atomic structure of Ag2O. The oxygen atoms (red) form a bcc lattice and the silver atoms (light grey) form an interpenetrating fcc lattice. | ||
We computed the ΔSCF energy of the O1s electron using (1 × 1 × 1), (2 × 2 × 2), (3 × 3 × 3), and (4 × 4 × 4) supercells to ensure that the ΔSCF of the Ag2O reference states is converged with respect to the cell size. In all cases a k point mesh equivalent to 12 × 12 × 12 for the unit cell was employed. The binding energy is well converged at the (3 × 3 × 3) cell with an O1s binding energy within 0.01 eV, which was found for the (4 × 4 × 4) cell.
We used these same systems to test the size convergence of our calculated O K-edge spectra. Fig. 26 shows the results of the calculated spectra (solid lines) compared to that measured in total electron, TEY, (A) and fluorescence yield, TFY, (b) modes, which have not been corrected for self interaction. The top solid line corresponds to the (3 × 3 × 3) cell. Comparison of this spectrum with experimental spectra reveals that the calculations converge quickly with respect to the cell size. The (2 × 2 × 2) unit cell faithfully recovers the doublet at 530 eV, as well as features at approximately 534 eV, 536 eV, and 540 eV, although the absorption energy of these higher energy features is underestimated by 1 eV in the theoretical spectrum. The agreement with experiment is better when the cell size is increased to (3 × 3 × 3). Further increasing the size of the cell to (4 × 4 × 4) offers no additional improvement. Using these results we expect that to obtain reliable O K-edge spectra we must use supercells wherein the absorbing atom is separated from its periodic image by approximately 10 Å.
The O K-edge spectrum in Fig. 26 can be seen to be a sensitive measure of the local environment around oxygen. After inspection of the figure it is immediately obvious that the Ag–O bonding in Ag2O is not purely ionic: if it were, the 1s → 2p transitions probed by the O K-edge spectrum would be devoid of absorptions. Instead, we can see that the system forms more directional bonds by hybridizing the triply degenerated O 2p states with the Ag 5s and 4d states, giving rise to the strong absorption above the threshold.102 This type of p depletion through hybridization between oxygen p and silver sd states has also been observed for Cu2O,133 which has a similar O K-edge spectrum to what we measured for Ag2O.
C In-plane polarization of incident X-rays
When the full absorption cross section tensor, Eqn 6 employed the angle between the E vector of the incident radiation and both surface normal, θ, and the x-axis in the place of the surface, ϕ, must be specified. While our experimental setup did not allow us to measure the in-plane angle, we found that averaging over ϕ has a minor effect on the qualitative features of the computed spectra when θ = 35°, which is approximately the angle between the E vector and the surface normal used in the experiment.Take for example the p(2 × 1) reconstruction of the Ag(110) surface shown in Fig. 1. In this case when ϕ = 0° the in-plane component of the E vector of the incident radiation lies along the [1![[1 with combining macron]](https://www.rsc.org/images/entities/char_0031_0304.gif) 0] direction, e.g. normal to the added rows. Whereas, when ϕ = 90° the E vector points along the added rows in the [001] direction. The corresponding calculated O K-edge spectra are shown in Fig. 27, along with the measured O K-edge spectrum and that calculated assuming no in-plane polarization, ϕ = 〈ϕ〉.
0] direction, e.g. normal to the added rows. Whereas, when ϕ = 90° the E vector points along the added rows in the [001] direction. The corresponding calculated O K-edge spectra are shown in Fig. 27, along with the measured O K-edge spectrum and that calculated assuming no in-plane polarization, ϕ = 〈ϕ〉.
Inspection of Fig. 27 reveals that, at θ = 35°, the qualitative features remain largely unchanged with the choice of ϕ. In all cases there is a near threshold absorption and a second absorption maximum at approximately 534 eV. While θ = 90° gives perhaps the best quantitative comparison with the experimental result, owing to the relative height of the primary absorptions. Conversely, ϕ = 0° gives the worst quantitative agreement with experiment due to the low intensity of the near threshold absorption. However we cannot use this comparison to assign the crystal orientation, see Appendix D for a discussion of the relative magnitude of the near threshold absorption. Thus, we have averaged over the in-plane angle when computing the O K-edge spectra.
D Core hole effect
While a core hole is present during XANES experiments its effect may not be observable and in some cases a better agreement with experiment is found by ignoring the core hole.76,77 Its effect on the calculated edge depends on the nature of the low-lying empty levels of the ground state and the degree to which the compensator charge is localized on the absorbing atom. Core hole effect will be the largest when the compensatory charge is delocalized and the low lying states are on the absorbing atom and of the same symmetry of the final states allowed by the dipole selection rule.77 Because all the systems we investigated have O p character in the low lying unoccupied states inclusion of the core hole may have an effect on the O K-edge spectra. However, due to the fact that the core hole is not necessarily treated correctly within a single particle approximation it is impossible to know a priori if including or ignoring it will lead to better agreement with experiment.76,77 To test the role of the core hole potential on the O K-edge spectra we repeated the XANES calculations with a standard pseudopotential on the absorbing atom.We find that in every system inclusion of the core hole modifies the O K-edge spectrum relative to the spectrum without a core hole. There are two general types of changes that appear to be tied to the nature of the unoccupied levels of the ground state.
In the first case the low lying unoccupied O p states sit well above the Fermi energy in the ground state, and when the core hole is present, the compensatory charge is delocalized, as typified by Ag2O. Fig. 28A shows the total density of states on the Ag atom (solid line) and the O p states (dashed line) in the absence of a core hole. The Fermi energy is set to zero and shown by a vertical line. Few states can be seen at the Fermi energy. The excited electron will fill states appearing at 2–4 eV above the Fermi energy, which are composed of Ag and O p character. As a result, when the simulation is performed in the presence of an O1s core hole and the excited electron is included in the simulation, a Bader charge decomposition reveals that 0.7 electrons of the compensatory charge are localized on the absorbing atom.
Fig. 29A shows the O K-edge spectrum of the bulk oxide computed with (solid line) and without (dashed line) an O1s core hole, along with the experimental spectra (collected in TEY and TFY modes), which are shown by way of dots. For ease of comparison the two computed spectra are normalized using the peak at approximately 533 eV. In the absence of the core hole the primary absorption is centered at 532.5 eV, whereas with the core hole it is centered at around 531.4 eV, as observed experimentally. In this type of system the core hole is required to recover the experimentally observed leading edge absorption. However, the reduced screening of the nuclear potential pulls the higher energy features too close to the Fermi energy. As a result, the small higher energy absorptions appear at 533.8, 535.8, and 539.8 eV in the spectrum calculated with a core hole, compared to 534.4, 536.9, and 541.1 eV in the measured spectrum. Thus, the principal function of the core hole in this type of system is to shift peak positions, and it must be included to recover the measured spectrum.
The second type of behavior is observed in systems with a high density of O p states at the Fermi energy. By way of example consider the p(2 × 1) reconstruction of the Ag(110) surface. Fig. 28B shows the silver states (solid line) and the oxygen p states for this system. A high density of oxygen states can be seen to cross the Fermi energy and quickly diminish relative to the density of the silver states. When the O1s core hole is introduced the compensatory charge fills these states and a Bader134 charge analysis reveals that 0.8 electrons of that charge are localized on the absorbing atom. The effect the core hole has on the calculated O K-edge in this type of system is different from what was observed for Ag2O.
Fig. 29B shows the O K-edge spectra of the p(2 × 1) reconstruction of the Ag(110) surface calculated with (solid line) and without (dashed line) a core hole. (The dotted line is discussed below). The experimental spectrum is shown by way of dots, and the spectra are normalized using the peak at approximately 534 eV. Comparing Fig. 29A and B reveals that the peak positions shift much less with respect to the treatment of the core hole in the p(2 × 1) reconstruction of the Ag(110) surface as compared to Ag2O. Unlike the Ag2O spectra, the position of the leading edge absorption of oxygen in the p(2 × 1) reconstruction is insensitive to the presence of the core hole, though the increased nuclear potential of the partially screened core hole can still be seen to pull the higher energy peaks closer to the Fermi energy relative to the results without a core hole. However, the largest effect the core hole has on the calculated O K-edge spectrum of p(2 × 1) reconstruction is a reduction in the magnitude of the leading edge absorption.
Comparing the spectrum obtained with the full core hole to the experimental spectrum in Fig. 29B reveals that the feature at 534 eV is too intense relative to the leading edge in the calculated spectrum. Excluding the core hole reverses the discrepancy; the calculated leading edge becomes too intense. However, the magnitude of the feature at 529 eV in the calculated spectrum is not entirely due to the treatment of the core hole. It also depends on how the occupied states are smoothly cut from the spectrum, which is problematic in metallic systems.76 Removing states of slightly higher energy reduces the intensity of the leading edge peak, the dotted line in Fig. 29B. This problem is more pronounced in the ground state calculation as the core hole reduces the number of O p states at the Fermi energy level. To avoid the ambiguity associated with cutting the occupied states, and using a consistent approach in the metallic and insulting systems, we focus on results obtained using the full core hole.
In most of the metallic systems the decision to include the core hole makes little impact, as it only changes the magnitude of the leading edge. However, this discrepancy with experiment is pronounced for oxygen in the p(4 × 4) reconstruction of the Ag(111) surface due to the shape of the spectrum. Fig. 30 shows the calculated O K-edge spectra of the p(4 × 4) reconstruction of the Ag(111) surface computed with (solid line) and without (dashed line) inclusion of the core hole. The experimental result is also shown (dots). Both the computed spectra recover the experimental absorptions, though the core hole reduces the intensity of the leading edge. While this reduction in the intensity is similar to what was observed for oxygen in the p(2 × 1) reconstruction of the Ag(110) surface, its impact on the qualitative shape of the spectrum is more dramatic due to the fact that the two principal absorptions appear within 3 eV of one another for oxygen in the p(4 × 4) reconstruction, as opposed to the 6 eV separation between absorption in the p(2 × 1) reconstruction. As such, we report the O K-edge spectrum in the absence of a core hole for oxygen in the p(4 × 4) reconstruction of the Ag(111) surface.
Acknowledgements
We acknowledge the CINECA award under the ISCRA initiative, for the availability of high performance computing resources and support, the Helmholtz-Zentrum Berlin (electron storage ring BESSY II) for provision of synchrotron radiation at the ISISS beamline, and the Australian Research Council for support.References
- R. Reichelt, S. Gunther, M. Rossler, J. Wintterlin, B. Kubias, B. Jakobi and R. Schlögl, Phys. Chem. Chem. Phys., 2007, 9, 3590–3599 RSC.
- R. A. Van Sanen and C. P. M. de Groot, J. Catal., 1986, 98, 530–539 CrossRef.
- R. A. van Santen and H. P. C. E. Kuipers, The Mechanism of Ethylene Epoxidation, in Advances in Catalysis, ed. D. D. Eley, H. Pines and P. B. Weisz, Academic Press, 1987, vol. 35, pp. 265–321, ISSN 0360-0564, ISBN 9780120078356, DOI:10.1016/S0360-0564(08)60095-4.
- W. M. H. Sachtler, C. Backx and R. A. Van Santen, Catal. Rev., 1981, 23, 127–149 CAS.
- C. T. Campbell and M. T. Paffett, Surf. Sci., 1984, 139, 396–416 CrossRef CAS.
- C. T. Campbell, J. Catal., 1985, 94, 436–444 CrossRef CAS.
- C. Backx, C. D. Groot, P. Biloen and W. Sachtler, Surf. Sci., 1983, 128, 81–103 CrossRef CAS.
- C. T. Campbell and M. T. Paffett, Surf. Sci., 1984, 143, 517–535 CrossRef CAS.
- C. T. Campbell, Surf. Sci., 1985, 157, 43–60 CrossRef CAS.
- V. I. Bukhtiyarov, M. Hävecker, V. V. Kaichev, A. Knop-Gericke, R. W. Mayer and R. Schlögl, Phys. Rev. B: Condens. Matter Mater. Phys., 2003, 67, 235422 CrossRef.
- V. I. Bukhtiyarov, A. I. Nizovskii, H. Bluhm, M. Hävecker, E. Kleimenov, A. Knop-Gericke and R. Schlögl, J. Catal., 2006, 238, 260–269 CrossRef CAS PubMed.
- V. Bukhtiyarov, Kinet. Catal., 2003, 44, 420–431 CrossRef CAS.
- V. I. Bukhtiyarov, V. V. Kaichev and I. P. Prosvirin, J. Chem. Phys., 1999, 111, 2169–2175 CrossRef CAS PubMed.
- R. B. Grant and R. M. Lambert, J. Catal., 1985, 92, 364–375 CrossRef CAS.
- C. Stegelmann and P. Stoltze, J. Catal., 2004, 226, 129–137 CrossRef CAS PubMed.
- W.-X. Li, C. Stampfl and M. Scheffler, Phys. Rev. B: Condens. Matter Mater. Phys., 2003, 68, 165412 CrossRef.
- W.-X. Li, C. Stampfl and M. Scheffler, Phys. Rev. Lett., 2003, 90, 256102 CrossRef.
- W.-X. Li, C. Stampfl and M. Scheffler, Phys. Rev. B: Condens. Matter Mater. Phys., 2002, 65, 075407 CrossRef.
- W.-X. Li, C. Stampfl and M. Scheffler, Phys. Rev. B: Condens. Matter Mater. Phys., 2003, 67, 045408 CrossRef.
- T. C. R. Rocha, M. Hävecker, A. Knop-Gericke and R. Schlögl, J. Catal., 2014, 312, 12–16 CrossRef CAS PubMed.
- V. Bukhtiyarov, I. Prosvirin and R. Kvon, Surf. Sci., 1994, 320, L47–L50 CrossRef CAS.
- V. I. Bukhtiyarov and A. Knop-Gericke, Nanostructured Catalysts: Selective Oxidations, The Royal Society of Chemistry, 2011, pp. 214–247 Search PubMed.
- P. S. Bagus, F. Illas, G. Pacchioni and F. Parmigiani, J. Electron. Spectrosc. Relat. Phenom., 1999, 100, 215–236 CrossRef CAS.
- T. C. R. Rocha, A. Oestereich, D. V. Demidov, M. Hävecker, S. Zafeiratos, G. Weinberg, V. I. Bukhtiyarov, A. Knop-Gericke and R. Schlögl, Phys. Chem. Chem. Phys., 2012, 14, 4554–4564 RSC.
- J. Schnadt, A. Michaelides, J. Knudsen, R. T. Vang, K. Reuter, E. Lgsgaard, M. Scheffler and F. Besenbacher, Phys. Rev. Lett., 2006, 96, 146101 CrossRef CAS.
- M. Schmid, A. Reicho, A. Stierle, I. Costina, J. Klikovits, P. Kostelnik, O. Dubay, G. Kresse, J. Gustafson, E. Lundgren, J. N. Andersen, H. Dosch and P. Varga, Phys. Rev. Lett., 2006, 96, 146102 CrossRef CAS.
- J. Schnadt, J. Knudsen, X. L. Hu, A. Michaelides, R. T. Vang, K. Reuter, Z. Li, E. Lægsgaard, M. Scheffler and F. Besenbacher, Phys. Rev. B: Condens. Matter Mater. Phys., 2009, 80, 075424 CrossRef.
- H. Bluhm, M. Hävecker, A. Knop-Gericke, M. Kiskinova, R. Schlögl and M. Salmeron, MRS Bull., 2007, 32, 1022–1030 CrossRef CAS.
- H. Bluhm, M. Hävecker, A. Knop-Gericke, E. Kleimenov, R. Schlögl, D. Teschner, V. I. Bukhtiyarov, D. F. Ogletree and M. Salmeron, J. Phys. Chem. B, 2004, 108, 14340–14347 CrossRef CAS.
- A. Knop-Gericke, M. Hävecker, T. Schedel-Niedrig and R. Schlögl, Top. Catal., 2000, 10, 187–198 CrossRef CAS.
- A. Michaelides, M.-L. Bocquet, P. Sautet, A. Alavi and D. King, Chem. Phys. Lett., 2003, 367, 344–350 CrossRef CAS.
- A. Michaelides, K. Reuter and M. Scheffler, J. Vac. Sci. Technol., A, 2005, 23, 1487–1497 CAS.
- S. Linic and M. A. Barteau, J. Am. Chem. Soc., 2002, 124, 310–317 CrossRef CAS PubMed.
- S. Linic and M. A. Barteau, J. Am. Chem. Soc., 2003, 125, 4034–4035 CrossRef CAS PubMed.
- M. Ozbek, I. Onal and R. Santen, Top. Catal., 2012, 55, 710–717 CrossRef CAS.
- M.-L. Bocquet, A. Michaelides, D. Loffreda, P. Sautet, A. Alavi and D. A. King, J. Am. Chem. Soc., 2003, 125, 5620–5621 CrossRef CAS PubMed.
- M.-L. Bocquet and D. Loffreda, J. Am. Chem. Soc., 2005, 127, 17207–17215 CrossRef CAS PubMed.
- W. Gao, M. Zhao and Q. Jiang, J. Phys. Chem. C, 2007, 111, 4042–4046 CAS.
- M. O. Ozbek, I. Onal and R. A. V. Santen, J. Phys.: Condens. Matter, 2011, 23, 404202 CrossRef CAS PubMed.
- M. O. Ozbek, I. Onal and R. A. vanâ Santen, ChemCatChem, 2011, 3, 150–153 CrossRef.
- M. Ozbek, I. Onal and R. van Santen, J. Catal., 2011, 284, 230–235 CrossRef CAS PubMed.
- Y. Xu, J. Greeley and M. Mavrikakis, J. Am. Chem. Soc., 2005, 127, 12823–12827 CrossRef CAS PubMed.
- A. Kokalj, P. Gava, S. de Gironcoli and S. Baroni, J. Phys. Chem. C, 2008, 112, 1019–1027 CAS.
- J. Greeley and M. Mavrikakis, J. Phys. Chem. C, 2007, 111, 7992–7999 CAS.
- A. Larrabee and R. Kuczkowski, J. Catal., 1978, 52, 72–80 CrossRef CAS.
- H. Kanoh, T. Nishimura and A. Ayame, J. Catal., 1979, 57, 372–379 CrossRef CAS.
- C. T. Campbell, J. Catal., 1986, 99, 28–38 CrossRef CAS.
- D. E. Starr, Z. Liu, M. Havecker, A. Knop-Gericke and H. Bluhm, Chem. Soc. Rev., 2013, 42, 5833–5857 RSC.
- Y. Ma, C. T. Chen, G. Meigs, K. Randall and F. Sette, Phys. Rev. A: At., Mol., Opt. Phys., 1991, 44, 1848–1858 CrossRef CAS.
- J. Yeh and I. Lindau, At. Data Nucl. Data Tables, 1985, 32, 1–155 CrossRef CAS.
- D. R. Penn, Phys. Rev. B: Condens. Matter Mater. Phys., 1987, 35, 482–486 CrossRef CAS.
- S. Tanuma, C. J. Powell and D. R. Penn, Surf. Interface Anal., 1991, 17, 911–926 CrossRef CAS.
- P. Giannozzi, S. Baroni, N. Bonini, M. Calandra, R. Car, C. Cavazzoni, D. Ceresoli, G. L. Chiarotti, M. Cococcioni, I. Dabo, A. Dal Corso, S. de Gironcoli, S. Fabris, G. Fratesi, R. Gebauer, U. Gerstmann, C. Gougoussis, A. Kokalj, M. Lazzeri, L. Martin-Samos, N. Marzari, F. Mauri, R. Mazzarello, S. Paolini, A. Pasquarello, L. Paulatto, C. Sbraccia, S. Scandolo, G. Sclauzero, A. P. Seitsonen, A. Smogunov, P. Umari and R. M. Wentzcovitch, J. Phys.: Condens. Matter, 2009, 21, 395502 CrossRef PubMed.
- J. P. Perdew, K. Burke and M. Ernzerhof, Phys. Rev. Lett., 1996, 77, 3865–3868 CrossRef CAS.
- Original QE PP library, 2008, http://www.quantum-espresso.org/wp-content/uploads/upf_files/O.pbe-van_gipaw.UPF.
- Original QE PP library, 2008, http://www.quantum-espresso.org/wp-content/uploads/upf_files/O.star1s-pbe-van_gipaw.UPF.
- PS Library, 2012, http://www.quantum-espresso.org/wp-content/uploads/upf_files/Ag.pbe-dn-rrkjus_psl.0.1.UPF.
- H. J. Monkhorst and J. D. Pack, Phys. Rev. B: Solid State, 1976, 13, 5188–5192 CrossRef.
- N. Marzari, D. Vanderbilt, A. De Vita and M. C. Payne, Phys. Rev. Lett., 1999, 82, 3296–3299 CrossRef CAS.
- Y. Kunisada, H. Nakanishi, W. A. D. no and H. Kasai, J. Phys.: Conf. Ser., 2012, 379, 012013 CrossRef.
- E. Pehlke and M. Scheffler, Phys. Rev. Lett., 1993, 71, 2338–2341 CrossRef CAS.
- S. Lizzit, A. Baraldi, A. Groso, K. Reuter, M. V. Ganduglia-Pirovano, C. Stampfl, M. Scheffler, M. Stichler, C. Keller, W. Wurth and D. Menzel, Phys. Rev. B: Condens. Matter Mater. Phys., 2001, 63, 205419 CrossRef.
- L. Köhler and G. Kresse, Phys. Rev. B: Condens. Matter Mater. Phys., 2004, 70, 165405 CrossRef.
- C. E. Patrick and F. Giustino, Phys. Rev. B: Condens. Matter Mater. Phys., 2011, 84, 085330 CrossRef.
- S. García-Gil, A. García and P. Ordejón, Eur. Phys. J. B, 2012, 85, 1–10 CrossRef.
- D. Prendergast and G. Galli, Phys. Rev. Lett., 2006, 96, 215502 CrossRef.
- G. B. Hoflund, Z. F. Hazos and G. N. Salaita, Phys. Rev. B: Condens. Matter Mater. Phys., 2000, 62, 11126–11133 CrossRef CAS.
- R. Masse, J. C. Guitel and A. Durif, Acta Crystallogr., Sect. B: Struct. Crystallogr. Cryst. Chem., 1979, 35, 1428–1429 CrossRef.
- V. K. Kaushik, J. Electron. Spectrosc. Relat. Phenom., 1991, 56, 273–277 CrossRef CAS.
- C. T. Au, S. Singh-Boparai, M. W. Roberts and R. J. Joyner, J. Chem. Soc., Faraday Trans., 1983, 79, 1779 RSC.
- J. Knudsen, N. M. Martin, E. Grånäs, S. Blomberg, J. Gustafson, J. N. Andersen, E. Lundgren, S. Klacar, A. Hellman and H. Grönbeck, Phys. Rev. B: Condens. Matter Mater. Phys., 2011, 84, 115430 CrossRef.
- H. Grönbeck, S. Klacar, N. M. Martin, A. Hellman, E. Lundgren and J. N. Andersen, Phys. Rev. B: Condens. Matter Mater. Phys., 2012, 85, 115445 CrossRef.
- C. Brouder, J. Phys.: Condens. Matter, 1990, 2, 701–738 CrossRef CAS.
- C. Gougoussis, M. Calandra, A. P. Seitsonen and F. Mauri, Phys. Rev. B: Condens. Matter Mater. Phys., 2009, 80, 075102 CrossRef.
- M. Taillefumier, D. Cabaret, A.-M. Flank and F. Mauri, Phys. Rev. B: Condens. Matter Mater. Phys., 2002, 66, 195107 CrossRef.
- O. Bunău and M. Calandra, Phys. Rev. B: Condens. Matter Mater. Phys., 2013, 87, 205105 CrossRef.
- V. Mauchamp, M. Jaouen and P. Schattschneider, Phys. Rev. B: Condens. Matter Mater. Phys., 2009, 79, 235106 CrossRef.
- P. J. W. Weijs, M. T. Czyżyk, J. F. van Acker, W. Speier, J. B. Goedkoop, H. van Leuken, H. J. M. Hendrix, R. A. de Groot, G. van der Laan, K. H. J. Buschow, G. Wiech and J. C. Fuggle, Phys. Rev. B: Condens. Matter Mater. Phys., 1990, 41, 11899–11910 CrossRef CAS.
- D. Marel, G. Sawatzky, R. Zeller, F. Hillebrecht and J. Fuggle, Solid State Commun., 1984, 50, 47–50 CrossRef.
- C. Brouder, M. Alouani and K. H. Bennemann, Phys. Rev. B: Condens. Matter Mater. Phys., 1996, 54, 7334–7349 CrossRef CAS.
- A. Menzel, S. Benzaid, M. O. Krause, C. D. Caldwell and U. Hergenhahn andM. Bissen, Phys. Rev. A: At., Mol., Opt. Phys., 1996, 54, R991–R994 CrossRef CAS.
- C. Hébert, M. Willinger, D. Su, P. Pongratz, P. Schattschneider and R. Schlögl, Eur. Phys. J. B, 2002, 28, 407–414 CrossRef.
- K. Reuter and M. Scheffler, Phys. Rev. B: Condens. Matter Mater. Phys., 2001, 65, 035406 CrossRef.
- M. Fronzi, S. Piccinin, B. Delley, E. Traversa and C. Stampfl, Phys. Chem. Chem. Phys., 2009, 11, 9188–9199 RSC.
- M. J. Chase, C. A. Davies, J. R. J. Downey, D. J. Frurip, R. A. McDonald and A. N. Syverud, NIST JANAF Thermochemical Tables, 1985, http://kinetics.nist.gov/janaf/.
- H. Engelhardt and D. Menzel, Surf. Sci., 1976, 57, 591–618 CrossRef CAS.
- M. Pascal, C. Lamont, P. Baumgärtel, R. Terborg, J. Hoeft, O. Schaff, M. Polcik, A. Bradshaw, R. Toomes and D. Woodruff, Surf. Sci., 2000, 464, 83–90 CrossRef CAS.
- L. Yang, T. S. Rahman, G. Bracco and R. Tatarek, Phys. Rev. B: Condens. Matter Mater. Phys., 1989, 40, 12271–12279 CrossRef CAS.
- W. W. Pai and J. E. Reutt-Robey, Phys. Rev. B: Condens. Matter Mater. Phys., 1996, 53, 15997–16005 CrossRef CAS.
- G. Bracco and R. Tatarek, Surf. Sci., 1983, 251, 498–502 Search PubMed.
- M. Taniguchi, K. Tanaka, T. Hashizume and T. Sakurai, Surf. Sci., 1992, 262, L123–L128 CrossRef CAS.
- Phase Transitions and Adsorbate Restructuring at Metal Surface, ed. D. A. King and D. P. Woodruff, Elsevier Science B. V., Amsterdam, 1994, vol. 7 Search PubMed.
- G. Dorenbos and D. Boerma, Surf. Sci., 1993, 287, 443–447 CrossRef.
- R. Feidenhans'l, F. Grey, M. Nielsen, F. Besenbacher, F. Jensen, E. Laegsgaard, I. Stensgaard, K. W. Jacobsen, J. K. Nørskov and R. L. Johnson, Phys. Rev. Lett., 1990, 65, 2027–2030 CrossRef.
- G. Dorenbos, M. Breeman and D. O. Boerma, Phys. Rev. B: Condens. Matter Mater. Phys., 1993, 47, 1580–1588 CrossRef CAS.
- R. Feidenhans'l, F. Grey, R. L. Johnson and M. Nielsen, Phys. Rev. B: Condens. Matter Mater. Phys., 1991, 44, 1875–1879 CrossRef.
- X. Duan, O. Warschkow, A. Soon, B. Delley and C. Stampfl, Phys. Rev. B: Condens. Matter Mater. Phys., 2010, 81, 075430 CrossRef.
- C. Stegelmann, N. Schiłodt, C. Campbell and P. Stoltze, J. Catal., 2004, 221, 630–649 CrossRef CAS PubMed.
- M. Ohta, K. Watanabe and Y. Matsumoto, J. Phys. Chem. B, 2001, 105, 8170–8177 CrossRef CAS.
- A. Knop-Gericke, M. Hävecker, T. Schedel-Niedrig and R. Schlögl, Top. Catal., 2000, 10, 187–198 CrossRef CAS.
- M. Pedio, J. C. Fuggle, J. Somers, E. Umbach, J. Haase, T. Lindner, U. Höfer, M. Grioni, F. M. F. de Groot, B. Hillert, L. Becker and A. Robinson, Phys. Rev. B: Condens. Matter Mater. Phys., 1989, 40, 7924–7927 CrossRef CAS.
- F. M. F. de Groot, M. Grioni, J. C. Fuggle, J. Ghijsen, G. A. Sawatzky and H. Petersen, Phys. Rev. B: Condens. Matter Mater. Phys., 1989, 40, 5715–5723 CrossRef CAS.
- F. De Groot, Chem. Rev., 2001, 101, 1779–1808 CrossRef CAS PubMed.
- D. A. Outka and J. Stöhr, J. Chem. Phys., 1988, 88, 3539–3554 CrossRef PubMed.
- C. Stampfl, Catal. Today, 2005, 105, 17–35 CrossRef CAS PubMed.
- C. T. Campbell, Phys. Rev. Lett., 2006, 96, 066106 CrossRef.
- K. H. Stern, High Temperature Properties and Thermal Decomposition ofInorganic Salts with Oxyanions, CRC Press LLC, Boca Raton, 2001 Search PubMed.
- X. Bao, M. Muhler, T. Schedel-Niedrig and R. Schlögl, Phys. Rev. B: Condens. Matter Mater. Phys., 1996, 54, 2249–2262 CrossRef CAS.
- A. Nagy, G. Mestl, D. Herein, G. Weinberg, E. Kitzelmann and R. Schlögl, J. Catal., 1999, 182, 417–429 CrossRef CAS.
- G. I. N. Waterhouse, G. A. Bowmaker and J. B. Metson, Appl. Catal., A, 2004, 265, 85–101 CrossRef CAS PubMed.
- C. T. Campbell, J. Catal., 1985, 94, 436–444 CrossRef CAS.
- G. Rovida, F. Pratesi, M. Maglietta and E. Ferroni, J. Vac. Sci. Technol., A, 1972, 9, 796–799 CrossRef CAS.
- C. I. Carlisle, D. A. King, M.-L. Bocquet, J. Cerdá and P. Sautet, Phys. Rev. Lett., 2000, 84, 3899–3902 CrossRef CAS PubMed.
- C. Carlisle, T. Fujimoto, W. Sim and D. King, Surf. Sci., 2000, 470, 15–31 CrossRef CAS.
- S. R. Bare, K. Griffiths, W. Lennard and H. Tang, Surf. Sci., 1995, 342, 185–198 CrossRef CAS.
- A. Raukema, D. A. Butler, F. M. Box and A. W. Kleyn, Surf. Sci., 1996, 347, 151–168 CrossRef CAS.
- X. Bao, M. Muhler, B. Pettinger, R. Schlögl and G. Ertl, Catal. Lett., 1993, 22, 215–225 CrossRef CAS.
- M. Gajdos, A. Eichler and J. Hafner, Surf. Sci., 2003, 531, 272–286 CrossRef CAS.
- H. Schubert, U. Tegtmeyer, D. Herein, X. Bao, M. Muhler and R. Schlögl, Catal. Lett., 1995, 33, 305–319 CrossRef CAS.
- D. S. Su, T. Jacob, T. W. Hansen, D. Wang, R. Schlögl and B. Freitag andS. Kujawa, Angew. Chem., Int. Ed., 2008, 47, 5005–5008 CrossRef CAS PubMed.
- R. A. Outlaw, S. N. Sankaran, G. B. Hoflund and M. R. Davidson, J. Mater. Res., 1988, 3, 1378–1384 CrossRef CAS.
- T. E. Jones, T. C. R. Rocha, A. Knop-Gericke, C. Stampfl, R. Schlögl and S. Piccinin, Phys. Chem. Chem. Phys., 2014, 16, 9002–9014 RSC.
- G. Mathieu, P. Gas, A. Combe-Brun and J. Bernardini, Acta Metall., 1983, 31, 1661–1667 CrossRef CAS.
- J.-P. Crocombette, H. de Monestrol and F. Willaime, Phys. Rev. B: Condens. Matter Mater. Phys., 2002, 66, 024114 CrossRef.
- C. Rehren, X. B. M. Muhler, R. Schlögl and G. Ertl, Z. Phys. Chem., 1991, 174, 11–52 CrossRef CAS.
- A. Barg, E. Rabkin and W. Gust, Acta Metall. Mater., 1995, 43, 4067–4074 CrossRef CAS.
- J. P. Allen, D. O. Scanlon and G. W. Watson, Phys. Rev. B: Condens. Matter Mater. Phys., 2011, 84, 115141 CrossRef.
- A. Deb and A. K. Chatterjee, J. Phys.: Condens. Matter, 1998, 10, 11719 CrossRef CAS.
- L. H. Tjeng, M. B. J. Meinders, J. van Elp, J. Ghijsen, G. A. Sawatzky and R. L. Johnson, Phys. Rev. B: Condens. Matter Mater. Phys., 1990, 41, 3190–3199 CrossRef CAS.
- P. Norby, R. Dinnebier and A. N. Fitch, Inorg. Chem., 2002, 41, 3628–3637 CrossRef CAS PubMed.
- R. W. G. Wyckoff, Crystal Structures, Wiley, New York, 1964 Search PubMed.
- A. F. Wells, Structural Inorganic Chemistry, Clarendon Press, Oxford, 1984 Search PubMed.
- M. Grioni, J. F. van Acker, M. T. Czyžyk and J. C. Fuggle, Phys. Rev. B: Condens. Matter Mater. Phys., 1992, 45, 3309–3318 CrossRef CAS.
- R. F. W. Bader, Atoms in Molecules. A Quantum Theory, Clarendon Press, Oxford, 1990 Search PubMed.
Footnote |
| † Present address: Brazilian Synchrotron Light Laboratory, Campinas, Brazil. |
| This journal is © the Owner Societies 2015 |

