 Open Access Article
Creative Commons Attribution 3.0 Unported Licence
The dual role of palladium in enhancing the photocatalytic activity of CdS dispersed on NaY-zeolite†
R.
Sasikala
*a,
A. P.
Gaikwad
a,
V.
Sudarsan
,
R.
Rao
b,
Jagannath
c,
B.
Viswanadh
d and
S. R.
Bharadwaj
a
aChemistry Division, Bhabha Atomic Research Centre, Trombay, Mumbai 400 085, India. E-mail: sasikala@barc.gov.in; Fax: +91 22 25505151; Fax: +91 22 25519613; Tel: +91 22 25592279
bSolid State Physics Division, Bhabha Atomic Research Centre, Trombay, Mumbai 400 085, India
cTechnical Physics Division, Bhabha Atomic Research Centre, Trombay, Mumbai 400 085, India
dMaterial Science Division, Bhabha Atomic Research Centre, Trombay, Mumbai 400 085, India
First published on 30th January 2015
Abstract
A stable photocatalyst, CdS dispersed on zeolite with Pd as both the dopant and the co-catalyst, has been developed. Enhancement of photocatalytic activity for hydrogen generation is observed for CdS when doped with palladium and dispersed on NaY-zeolite (CdPdS-Z). A further increase in the photocatalytic activity of CdPdS-Z is observed when palladium is added as a co-catalyst (Pd-CdPdS-Z). Cd0.95Pd0.05S-Z is synthesized via a facile soft chemical route and the Pd co-catalyst is loaded onto the composite using a wet impregnation method. This composite catalyst exists as two phases consisting of CdPdS and zeolite and CdPdS exists as a highly dispersed phase on zeolite as revealed by TEM studies. The Pd doped CdS–zeolite composite exhibits increased visible light absorption indicating the alteration of the band structure of CdS as a result of doping. Time resolved fluorescence studies reveal that the lifetime of the charge carriers is higher in the composites than in pure CdS. A detailed characterization using XRD, Raman and X-ray photoelectron spectroscopy indicates that Pd has substituted for Cd in the CdS lattice and Pd exists in the Pd2+ oxidation state. Solid state MAS NMR studies indicate that an interaction exists between CdS (or CdPdS) and zeolite at the interface and Cd selectively interacts with Al of the zeolite framework. The photocatalytic activity of the Pd-CdPdS-Z catalyst remains unchanged with repeated cycles. Characterization of the used catalyst indicates that it is stable under the present experimental conditions. The enhanced photocatalytic activity of Pd-CdPdS-Z is attributed to the enhanced visible light absorption arising due to Pd doping and increased lifetime of the photogenerated charge carriers assisted by zeolite and the Pd co-catalyst. This study highlights the multiple roles played by palladium in enhancing the photocatalytic activity of the CdS–zeolite composite.
1. Introduction
Cadmium sulfide based photocatalysts are studied extensively for photocatalytic hydrogen generation from water using visible light. Though CdS is a visible light active photocatalyst, pure CdS has poor photocatalytic activity for hydrogen production in the absence of sacrificial reagents. One of the reasons for the poor activity is that the lifetime of the photogenerated charge carriers is too small to reach the surface of the photocatalyst and initiate the reduction of water. Besides, in the absence of suitable sacrificial reagents, photocorrosion of CdS occurs, making it unstable. Often, sacrificial reagents such as sodium sulfide and sodium sulfite are used to increase the stability and lifetime of the charge carriers for CdS based systems.1The lifetime of the photogenerated charge carriers can be improved by preparing a composite of the photocatalyst with other semiconductors having suitable conduction band (CB) and valence band (VB) potentials. In such composites, the transfer of charges from one semiconductor to the other can take place, resulting in an increased lifetime of the charge carriers. Photocatalytic activities of composites of CdS with TiO2,2 ZnS,3 polyaniline,4 ZrO2,5 zeolite,6 ZnO,7 CdO,8,9 graphene10–15etc. have been reported and in most cases an increased activity is observed for the composites compared to single phase CdS. The reason attributed for the enhancement is the improved surface area and better separation of photogenerated charge carriers. Similarly, it is reported that the N doped graphene–CdS composite shows enhanced photocatalytic activity compared to pure CdS.16 In this case, N doped graphene acts as a co-catalyst, enhances charge separation and improves photocatalytic activity. A solid solution of Zn0.8Cd0.2S with Pt as the co-catalyst is found to be an efficient photocatalyst for hydrogen generation from water.17 The enhanced activity is attributed to a relatively negative conduction band and increased visible light absorption by the solid solution. Composites of ZnO with CdS and carbon materials like graphene, C60, carbon nanotubes, etc. have been reported to enhance the photocatalytic activity for dye degradation and minimize photocorrosion.18 The reasons for the enhanced photocatalytic activity are the increased lifetime of the charge carriers and improved visible light absorption.
In the present work, CdS is doped with Pd with the aim of increasing the visible light absorption. Further, it is dispersed on zeolite and Pd is impregnated on the surface as a co-catalyst to improve the separation of charges. The Pd2+ dopant can modify the bandgap whereas the surface Pd0 (impregnated as the co-catalyst) can separate the charges efficiently. Though previous reports are available on the role of surface Pd as a co-catalyst in enhancing the charge separation, the role of Pd as a dopant in CdS–zeolite composite has not been investigated. The present study highlights the dual role of Pd in enhancing the photocatalytic activity of CdS.
2. Experimental
2.1 Synthesis of CdS–zeolite and Pd doped CdS–zeolite composites
CdS (10, 20, 30 and 50% by weight) was loaded onto Na-Y-zeolite (named xCdS-Z, where x = 10, 20, 30 and 50) using an impregnation method. Commercially available zeolite (Süd-Chemie India Ltd) was used after drying in an oven at 120 °C for 6 h. Aqueous cadmium chloride solution (water + ethanol, 1![[thin space (1/6-em)]](https://www.rsc.org/images/entities/char_2009.gif) :
:![[thin space (1/6-em)]](https://www.rsc.org/images/entities/char_2009.gif) 1 ratio) was stirred with zeolite powder. This suspension was treated with a calculated amount of Na2S dissolved in a water–ethanol mixture (1
1 ratio) was stirred with zeolite powder. This suspension was treated with a calculated amount of Na2S dissolved in a water–ethanol mixture (1![[thin space (1/6-em)]](https://www.rsc.org/images/entities/char_2009.gif) :
:![[thin space (1/6-em)]](https://www.rsc.org/images/entities/char_2009.gif) 1 ratio) under constant stirring for 1 h. The precipitate was centrifuged, washed with water and ethanol three times each followed by heating the dried powder at 350 °C for 4 h. For the synthesis of palladium doped (5% by atomic weight) CdS (20CdPdS-Z), a similar procedure was adopted except that a mixed aqueous solution of CdCl2 and palladium chloride was used for the synthesis. Pure CdS was prepared by the reaction of cadmium chloride with sodium sulfide under similar conditions described above. Pd metal (0.5% by weight) was loaded onto CdPdS (Pd-CdPdS), and 20CdPdS-Z (Pd-20CdPdS-Z) using a wet impregnation method. Sample powders were kept in contact with aqueous palladium chloride solutions and evaporated to dryness under constant stirring followed by heating in air at 350 °C for 2 h. No reductive treatment was given to these catalysts before the photocatalysis experiment. Palladium oxide particles impregnated on the surface as the co-catalyst were reduced to Pd metal during the initial hours of irradiation. The photoreduction of a noble metal co-catalyst impregnated on a catalyst surface has been reported earlier by many authors.19,20
1 ratio) under constant stirring for 1 h. The precipitate was centrifuged, washed with water and ethanol three times each followed by heating the dried powder at 350 °C for 4 h. For the synthesis of palladium doped (5% by atomic weight) CdS (20CdPdS-Z), a similar procedure was adopted except that a mixed aqueous solution of CdCl2 and palladium chloride was used for the synthesis. Pure CdS was prepared by the reaction of cadmium chloride with sodium sulfide under similar conditions described above. Pd metal (0.5% by weight) was loaded onto CdPdS (Pd-CdPdS), and 20CdPdS-Z (Pd-20CdPdS-Z) using a wet impregnation method. Sample powders were kept in contact with aqueous palladium chloride solutions and evaporated to dryness under constant stirring followed by heating in air at 350 °C for 2 h. No reductive treatment was given to these catalysts before the photocatalysis experiment. Palladium oxide particles impregnated on the surface as the co-catalyst were reduced to Pd metal during the initial hours of irradiation. The photoreduction of a noble metal co-catalyst impregnated on a catalyst surface has been reported earlier by many authors.19,20
2.2 Characterization
Powder X-ray diffraction (XRD) patterns of these samples were recorded using a Philips PW1820-X-ray diffractometer coupled with a PW 1729 generator, which was operated at 30 kV and 20 mA. A graphite crystal monochromator was used for generating monochromatic CuKα radiation. The surface area of the samples was measured using the Brunauer, Emmett and Teller (BET) method employing nitrogen as the adsorbent gas. The samples were degassed at 300 °C for 2 h before the measurements. Transmission electron microscopy (TEM) measurements were performed using 200 keV electrons on a JEOL 210 UHR TEM microscope (Tokyo, Japan). Samples were dispersed in methanol and a drop of this solution was added to a carbon coated copper grid and was dried prior to loading into the TEM machine. Raman spectra were recorded using 532 nm lines from a diode-pumped Nd-YAG laser (power 15 mW) focused onto a spot size of about 20 μm. The scattered light was analyzed using a home-built 0.9 m single monochromator coupled with an edge filter and detected using a cooled charge coupled device (CCD, Andor technology). The entrance slit was kept at 50 μm, which gave a resolution limited line width of 3 cm−1. DR-UV-visible spectra of all samples were recorded using a Jasco (model V-670) spectrophotometer equipped with an integrating sphere accessory. Barium sulphate was used as the reference for the reflectance spectra. Photoluminescence (PL) measurements in the visible region were carried out with an Edinburgh Instruments FLSP 920 system with a 450 W Xe arc lamp as the excitation source and a red sensitive Peltier element cooled Hamamatsu R2658 PMT as the detector. The emission spectra were recorded at a resolution of 1.0 nm, by exciting the samples at 260 nm. All the emission patterns were corrected for the detector response and were measured at 1 nm resolution unless otherwise stated. Excited state lifetimes of the charge carriers were measured using the same instrument and a nanosecond hydrogen flash lamp as the excitation source and employing the Time Correlated Single Photon Counting (TCSPC) technique. The frequency of the lamp was 40 kHz. The samples were excited at 282 nm and the lifetime was measured for 700 nm emission. X-ray photoelectron spectroscopy (XPS) studies were carried out on a VG Microtech electron spectrometer using Mg-Kα X-rays (hν = 1253.6 eV) as the primary source of radiation. The chamber pressure was maintained at 1 × 10⁻⁹ torr. An appropriate correction for the charging effect was made with the help of the C 1s signal appearing at 284.5 eV. Solid state 29Si and 27Al magic angle spinning nuclear magnetic resonance (MAS NMR) patterns were recorded using a Bruker Avance III 400 MHz NMR machine with basic frequencies of 79.46 and 104.22 MHz respectively. A single pulse experiment with a pulse duration of 3.5 μs and a relaxation delay time of 10 seconds was used for recording 29Si MAS NMR patterns. The corresponding values for 27Al MAS NMR experiments are 4 μs and 5 s respectively; the samples were packed in 4 mm zirconia rotors and subjected to a spinning speed of 10 kHz for recording the MAS NMR patterns. Chemical shift values are expressed with respect to tetramethyl silane (TMS) and 1 N aqueous solution of Al(NO3)3 for 29Si and 27Al nuclei respectively.2.3 Photocatalytic activity studies
The photocatalytic activity was studied in a tubular quartz reactor using daylight fluorescent lamps (288 Watts) as the source of radiation. The details of the photoirradiator (S1, ESI†) and the spectrum of the fluorescent lamp (Fig. S2) are given in ESI.† Fifty milligrams of the sample were kept in contact with aqueous solutions of Na2S (12.5 cm3) and Na2SO3 (12.5 cm3) for conducting the photocatalysis experiment. The reactor was flushed with argon gas before irradiation. Every one hour, the gas mixture in the reactor was analyzed using a gas chromatograph (Chromatography and Instruments company, GC 2011) equipped with a molecular sieve 5A column and thermal conductivity detector. The total intensity of light incident at the sample position was measured using a Gentec power meter (model Solo 2 (R2)). Details of the irradiation chamber (S1) are given in the ESI† and in our earlier articles.21,223. Results and discussion
3.1 Phase identification and morphology
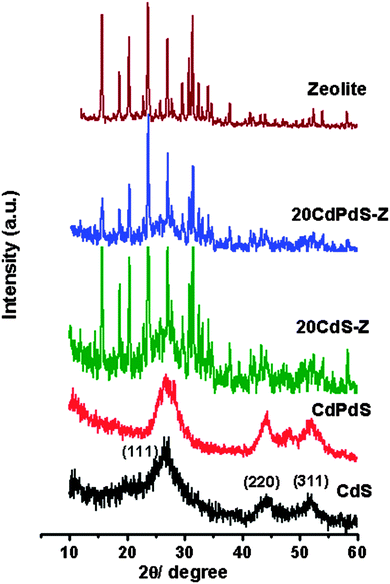
The powder XRD patterns of all samples are shown in Fig. 1. It may be seen that CdS and CdPdS exist in the cubic phase (JCPDS No. 80-0019). It may be noted that in the composite too, CdS exists in the cubic phase. The XRD patterns of the composites confirm that CdS and zeolite exist as separate phases. The XRD pattern of CdPdS is very similar to that of CdS except that a very small peak around 48.1° is seen. This peak can be due to the presence of a very small amount of hexagonal CdS. No additional peak corresponding to PdS is seen indicating that Pd2+ has substituted for Cd2+ in the lattice of CdS. The BET surface area values obtained for NaY zeolite, CdS, CdPdS, 10CdS-Z, 20CdS-Z, 30CdS-Z, 50CdS-Z and 20CdPdS-Z are 670, 45, 48, 168, 154, 103, 82 and 143 m2 g−1 respectively.To further investigate the different phases present in these samples, Raman spectra were recorded and are shown in Fig. 2. Pure CdS shows Raman bands around 306 and 610 cm−1, which can be assigned to the 1 LO (longitudinal optical) and 2 LO phonon modes of CdS respectively.23 The Raman spectrum of zeolite shows a broad band at 503 cm−1, which is characteristic of Y-zeolite.24 The Raman spectra of CdPdS and 20CdPdS-Z are identical to that of CdS and no band corresponding to any other phase like PdS or PdO is seen, which is in conformity with our XRD results. Besides, the Raman bands due to zeolite are not seen in the composite as the Raman spectrum of zeolite is, in general, dominated by a high background fluorescence due to defects.25 The strong background fluorescence makes the Raman bands weak or completely undetectable. A similar effect of the non-observance of zeolite bands in the Raman spectra of the CdS–zeolite composite has been reported previously.26,27
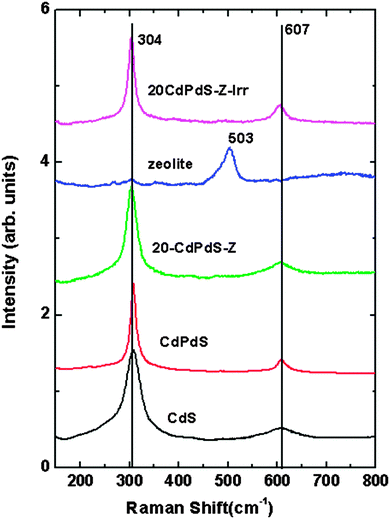 | ||
| Fig. 2 Raman spectra of CdS, CdPdS, NaY-zeolite, 20CdPdS-Z and 20CdPdS-Z–Irr (after the photocatalysis experiment). | ||
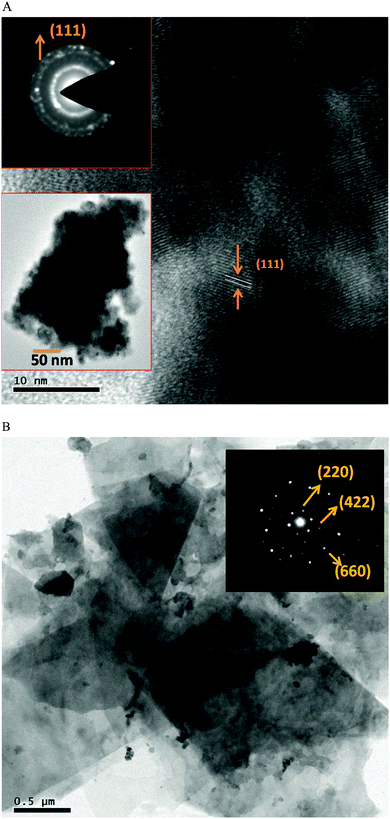
TEM and HRTEM images along with the SAED pattern of CdPdS are shown in Fig. 3A. It is seen from the figure that CdPdS exists as nanosized particles with a size of 20–30 nm. The distance between the fringes obtained from the HRTEM image of the CdPdS sample matched well with the (111) plane of cubic CdS. The SAED pattern could also be indexed as cubic CdS. The TEM image and SAED pattern of 20CdPdS-Z are shown in Fig. 3B. The image consists of irregular shaped, large sized aggregated particles. More TEM images recorded from different regions are shown in Fig. S3 of the ESI.† SAED patterns recorded from different regions of the aggregated particles, showed a diffraction pattern characteristic of the crystalline Y-zeolite phase. No SAED patterns corresponding to CdS phase could be obtained. However, the presence of CdS in this composite is confirmed from the XRD pattern and the Raman spectrum. Thus, the TEM studies suggest that CdS exists as a highly dispersed phase on zeolite.
3.2 Optical properties
UV-visible DRS of CdS, zeolite and the composites are shown in Fig. 4A. A blue shift of the absorption edge is seen for the composite samples compared to CdS. The spectrum of zeolite does not show any absorption as it is a wide bandgap material. Pd doping in CdS results in a significant increase in visible light absorption as seen from the spectrum of CdPdS and the 20CdPdS-Z composite. Fig. 4B shows the modified Kubelka–Munk function [(F(R∞)hν)2] plotted against hν. The bandgaps of CdS and the composites obtained from these plots are 2.40, 1.16, 2.25, 2.49 and 2.53 for CdS, CdPdS, 20CdPdS-Z, 30CdS-Z and 20CdS-Z respectively. Thus, a clear decrease in the bandgap of CdS is observed as a result of Pd doping in CdS.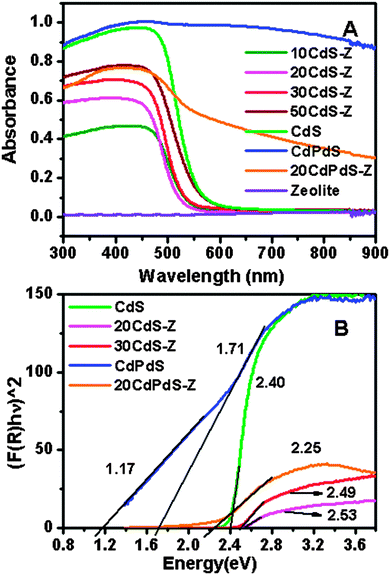 | ||
| Fig. 4 (A) UV-Visible DRS of CdS, zeolite and composites (B) Modified K–M function plotted against hν for CdS and composites. | ||
The PL spectra of CdS, zeolite, CdPdS, 20CdS-Z and 20CdPdS-Z are shown in Fig. 5A. The emission spectrum of CdS shows a broad peak around 590 nm. The wavelength corresponding to the emission peaks of CdS suggests that the peak is originating from the defect emission.28 Pure zeolite shows a broad peak centered at 440 nm and can be assigned to the defect emission. The spectra of the composites are similar and show the defect emission peaks corresponding to both CdS and zeolite. The PL spectrum of CdPdS did not show any peak as it is dark in color and hence no emission occurs from it.
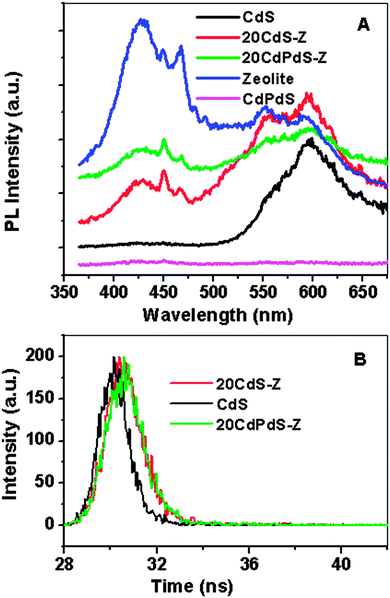 | ||
| Fig. 5 (A) Photoluminescence spectra of CdS, CdPdS, zeolite and composites; (B) fluorescence emission decay curves (emission at 590 nm) for CdS, 20CdS-Z and 20CdPdS-Z. | ||
Fluorescence lifetime studies were carried out for the CdS–zeolite composite samples and the time resolved fluorescence decay plots are shown in Fig. 5B. In powder samples, the intensity of the emission peak depends on the properties of the powder and hence it is incorrect to draw any conclusion regarding the luminescence efficiency or lifetime based on a comparison of the intensities of the emission peaks. Fluorescence lifetime is the more appropriate parameter that needs to be considered for this purpose. The fluorescence emission decay at 590 nm was studied. It can be seen from the figure that the recombination is slower in the composite samples than in pristine CdS. The fluorescence lifetimes obtained for CdS, 20CdS-Z and 20CdPdS-Z are 193, 603 and 620 ps respectively. The increased lifetime of the charge carriers in the composite samples indicates that zeolite is playing a role in increasing the lifetime of the photogenerated charges.
3.3 XPS studies
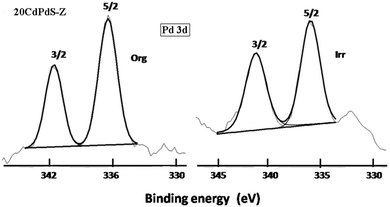
X-ray photoelectron spectra of 20CdPdS-Z before and after photocatalysis experiments were recorded to determine the oxidation state of the different species present on the surface and to see whether any change in the oxidation state occurred after catalysis. The Pd 3d spectra of these samples are shown in Fig. 6. It can be seen that the spectra of both 20CdPdS-Z composites before and after catalysis showed two peaks at 336.1 and 341.2 eV. These peaks can be assigned to the 3d5/2 and 3d3/2 spin orbital components of the Pd2+ species.29 It is seen that peak position is more or less the same in both samples. Even after irradiation, there is no significant change in the peak positions, indicating that palladium remains as the oxidized species in the doped samples. The S2p spectra of 20CdPdS-Z are shown in Fig. 7. The spectra of original and irradiated samples showed a single peak with a binding energy of 161.8 eV and the peak position is unchanged for the irradiated sample. This corresponds to the S2− of cadmium sulfide.30 The Cd 3d spectra of all samples are shown in Fig. 7. Two peaks seen at 404.1 and 410.9 eV arise from the 3d5/2 and 3d3/2 components of Cd in CdS.31 The surface composition of 20CdPdS-Z as obtained from the XPS analysis before and after photocatalysis work is shown in Table 1. It can be seen that there is no significant change in the composition of CdPdS after photocatalysis work indicating that the catalyst is quite stable under the present experimental conditions.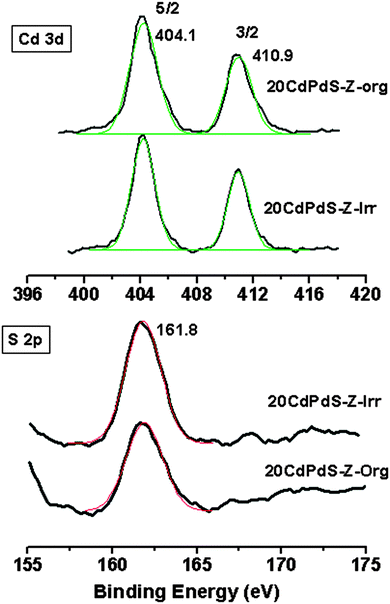 | ||
| Fig. 7 Cd 3d and S 2p X-ray photoelectron spectra of 20CdPdS-Z of the original and irradiated samples. | ||
| Element | 20CdPdS-Z–Org (atom%) | 20CdPdS-Z–Irr (atom%) |
|---|---|---|
| Cd | 14.5 | 16.4 |
| Pd | 3.6 | 3.1 |
| S | 12.9 | 13.3 |
| C | 12.2 | 7.7 |
| O | 37.6 | 40.7 |
| Si | 14.3 | 13.4 |
| Al | 4.9 | 5.4 |
3.4 Solid state MAS NMR studies
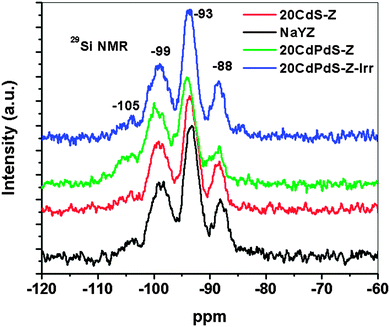
The 27Al and 29Si NMR spectra of zeolite, 20CdS-Z and 20CdPdS-Z were recorded to study the nature of the interaction between CdS and CdPdS with zeolite. Fig. 8 shows the27Al NMR spectra of NaY zeolite, 20CdS-Z and 20CdPdS-Z. A peak around 62 ppm is seen for all samples indicating that Al is in the 4-coordination state.32,33 A closer look at the peaks indicates that there is a shift of the peak towards lower chemical shift values for the composite samples. Though, the shift of the peak position of 20CdPdS-Z appears to be small compared to zeolite, it is significant as 27Al is a quadrupolar nucleus and its sensitivity to the electronic environment is relatively less compared to the spin 1/2 nucleus. This shift can be explained by considering the fact that with Cd2+ incorporation in the system, the Na+ attached with AlO4− units gets replaced with Cd2+ ions. As the Z/r value of Cd2+ (2.6) is much larger than Na+ (1.01, almost double), the AlO4−−Cd2+ interaction will be more covalent compared to the AlO4−−Na+ interaction. The increased covalent character of AlO4−−Cd2+ linkages results in increased electron density in AlO4− structural units and eventually increases the net electron density around Al. This leads to decreased 27Al NMR chemical shift values for AlO4−−Cd2+ linkages compared to AlO4−−Na+ linkages and an associated upfield shift in the 27Al MAS NMR peak. The 29Si MAS NMR spectra of all samples are shown in Fig. 9. The 29Si MAS NMR pattern of the Zeolite Y sample is characterized mainly by four peaks around −105, −99, −93 and −88 ppm which are characteristic of silicon structural units having different number of Al3+ ions as next nearest neighbors. Based on the previous 29Si MAS NMR studies of Zeolite Y samples, the peaks around −105, −99, −93 and −88 ppm have been attributed to silicon structural units with 1Al, 2Al, 3Al and 4Al respectively as the next nearest neighbors.34 The chemical shift values of peaks corresponding to all samples are almost the same indicating that the local environment around Si in the framework is unaffected by the dispersion of CdS (or CdPdS) on its surface and there is no direct interaction between silicon structural units and Cd2+ ions. Thus, 29Si MAS NMR results substantiate the 27Al MAS NMR results that Cd directly and selectively interacts with the Al of the zeolite framework. It may be noted that the 27Al and 29Si spectra of the catalyst after irradiation is very similar to the original one suggesting that the catalyst is stable and no change occurs in the catalyst during irradiation.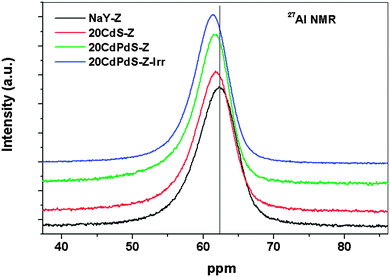 | ||
| Fig. 8 . 27Al MAS NMR spectra of NaY-zeolite, 20CdS-Z, 20CdPdS-Z and 20CdPdS-Z–Irr (after the photocatalysis experiment). | ||
3.5 Photocatalytic activity and the possible electron transfer process in the composite
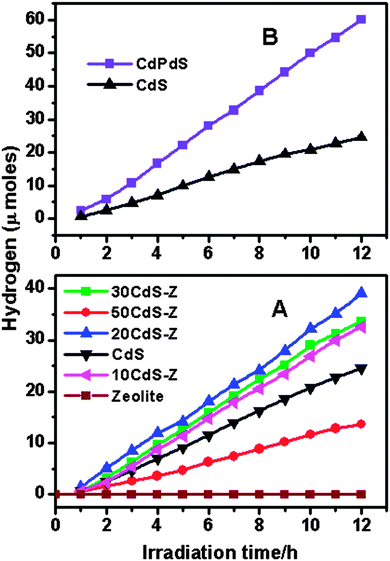
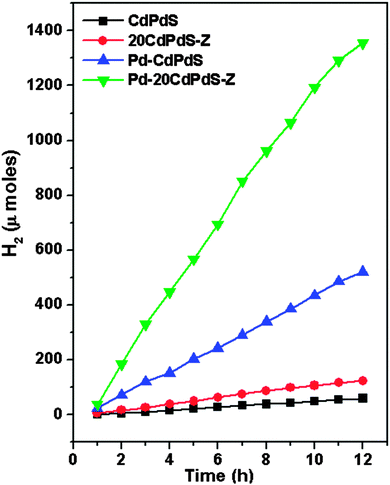
Fig. 10A shows the variation of the photocatalytic activity of the CdS–zeolite composite as the concentration of CdS on zeolite is increased. It is seen that the photocatalytic activity initially increases with CdS loading and reaches a maximum when the concentration is 20%. Beyond that, the activity decreases indicating that the dispersion of CdS is the highest at the 20% concentration of CdS. Further increase in the concentration of CdS decreases the effective surface area and results in a decrease in the photocatalytic activity. As expected, zeolite does not show any activity due to its wide bandgap. The effect of Pd doping in CdS on the photocatalytic activity is shown in Fig. 10B. A considerable increase in the photocatalytic activity for CdS is seen after doping with Pd. This increase in the photocatalytic activity of CdPdS can be attributed to the improved visible light absorption as seen from the UV-visible DRS of this sample. The effects of loading Pd as the co-catalyst on the photocatalytic activity of CdPdS and 20CdPdS-Z are shown in Fig. 11. It can be seen that the presence of the Pd co-catalyst enhances the photocatalytic activity of both CdPdS and 20CdPdS-Z and a hydrogen generation rate of 113 μmol h−1 is obtained for the Pd-20CdPdS-Z catalyst. These results clearly reveal that the presence of palladium as both dopant and co-catalyst plays a significant role in increasing the photocatalytic activity of CdS dispersed on zeolite.The stability of the catalyst was tested by repeating the photocatalysis experiment using the same catalyst after flushing the system with argon gas. The time course of hydrogen evolution for repeated cycles is shown in Fig. 12. It is seen that there is no significant decrease in the photocatalytic activity up to 60 h in the experiment indicating that the catalyst is stable under the present experimental conditions. The XRD patterns of the samples recorded before and after the photocatalysis work (Fig. S4 of the ESI†) indicate that no phase change occurs in the sample during photocatalytic reaction. Besides, the Raman spectrum of the irradiated 20CdPdS-Z sample (Fig. 2) is similar to that of the fresh catalyst, which further confirms that no noticeable change occurs in the catalyst due to irradiation. It may be recalled that the surface oxidation state of different elements and the composition of the 20CdPdS-Z are also found to be almost the same for the original and irradiated samples from the XPS spectra. Thus, both the surface and bulk of 20CdPdS-Z remain unchanged after the photocatalysis experiment.
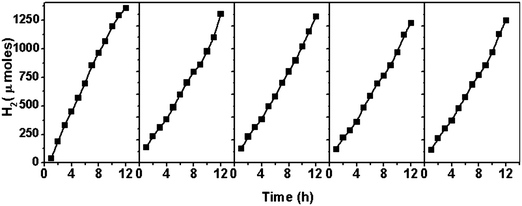 | ||
| Fig. 12 Photocatalytic activity of Pd impregnated 20CdPdS-Z for repeated cycles (reaction conditions same as that of the previous experiment). | ||
Photocatalytic activity studies clearly reveal that zeolite support plays a prominent role in increasing the photocatalytic activity of CdS. The enhanced activity is arising due to two reasons. Dispersion of CdS on zeolite increases the surface area of CdS preventing aggregation, which increases the photocatalytic activity. Besides, the polar environment of zeolite plays a role in improving the charge separation. It acts as a media for charge transfer owing to its electron acceptor–donor properties. Hence, the photogenerated electrons from CdS (or CdPdS) can be effectively transferred to the zeolite framework resulting in an increased lifetime of the charge carriers.35–37 This view is supported by the fluorescence lifetime studies of CdS–zeolite composites. For the charge transfer from CdS to zeolite to be effective, an intimate contact between CdS and zeolite is needed. The NMR spectra of the composite samples clearly show the interaction between CdS and zeolite at the interface, which can favor the charge transfer from CdS to zeolite.
Further, the present study shows that palladium can play multiple roles in enhancing the photocatalytic activity of CdS. Palladium as Pd2+ in CdPdS enhances the optical absorption property by altering the band structure of CdS and improves the photocatalytic activity. Palladium as the co-catalyst (Pd0) improves the activity further by increasing the lifetime of charge carriers. The presence of Pd metal in the palladium impregnated sample could not be seen from the XPS of this sample as its concentration was very low (0.5% by weight). But, its presence is discerned from the photocatalytic activity studies, which clearly show an enhanced activity after Pd impregnation. This is in conformity with the studies reported earlier by us as well as by many other authors.5,11,20–22,38,39 When Pd is used as a co-catalyst, interfacial transfer of electrons occurs from the photocatalyst to Pd. Through this process, the charges are separated efficiently and recombination is reduced. The increased availability of electrons at the metal sites increases the photocatalytic efficiency. A schematic illustration of the charge separation process occurring in the Pd-CdS–zeolite composite is shown in Fig. 13.
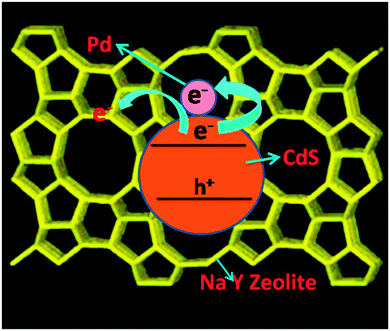 | ||
| Fig. 13 Schematic illustration of the photogenerated charge separation process in the Pd-CdS–zeolite composite. | ||
4. Conclusions
Palladium doped CdS dispersed on zeolite with Pd as the co-catalyst (Pd-20CdPdS-Z) exhibits enhanced photocatalytic activity for hydrogen generation from water compared to pure CdS, palladium doped CdS and CdS dispersed on zeolite. CdS and CdPdS interact selectively with Al of the zeolite framework. In this system, Pd plays the dual role of improving the visible light absorption and increasing the lifetime of the photogenerated electrons. Palladium doping in CdS improves the optical absorption properties of CdS whereas zeolite and the Pd metal co-catalyst increase the lifetime of the charge carriers by enhancing the interfacial transfer of electrons from CdS to Pd metal and zeolite. This observation is supported by the increased fluorescence lifetime for the charge carriers in the composite system. The catalyst is found to be stable and the photocatalytic activity is unchanged for repeated cycles of the experiment.References
- N. Bao, L. Shen, T. Takata, K. Domen, A. Gupta, K. Yanagisawa and C. A. Grimes, J. Phys. Chem. C, 2007, 111, 17527–17534 CAS.
- H. Park, Y. K. Kim and W. Choi, J. Phys. Chem. C, 2011, 115, 6141–6148 CAS.
- G. C. De, A. M. Roy and S. S. Bhattacharya, Int. J. Hydrogen Energy, 1996, 21, 19–23 CrossRef.
- K. He, M. Li and L. Guo, Int. J. Hydrogen Energy, 2012, 37, 755–759 CrossRef CAS PubMed.
- R. Sasikala, A. R. Shirole, V. Sudarsan, K. G. Girija, R. Rao, C. Sudakar and S. R. Bharadwaj, J. Mater. Chem., 2011, 21, 16566–16573 RSC.
- M. Sathish, B. Viswanathan and R. P. Viswanath, Int. J. Hydrogen Energy, 2006, 31, 891–898 CrossRef CAS PubMed.
- X. Wang, G. Liu, Z. G. Chen, F. Li, L. Wang, G. Q. Lu and H. M. Cheng, Chem. Commun., 2009, 3452–3454 RSC.
- W. Yang, Y. Liu, Y. Hu, M. Zhou and H. Qian, J. Mater. Chem., 2012, 22, 13895 RSC.
- S. V. Kahane, R. Sasikala, B. Vishwanadh, V. Sudarsan and S. Mahamuni, Int. J. Hydrogen Energy, 2013, 38, 15012–15018 CrossRef CAS PubMed.
- X. An, X. Yu, J. C. Yu and G. Zhang, J. Mater. Chem. A, 2013, 1, 5158–5164 CAS.
- F. N. Sayed, R. Sasikala, O. D. Jayakumar, R. Rao, C. A. Betty, A. Chokkalingam, R. M. Kadam, Jagannath, S. R. Bharadwaj, A. Vinu and A. K. Tyagi, RSC Adv., 2014, 4, 13469–13476 RSC.
- M. Q. Yang, N. Zhang, M. Pagliaro and Y. J. Xu, Chem. Soc. Rev., 2014, 43, 8240–8254 RSC.
- N. Zhang, Y. Zhang and Y. J. Xu, Nanoscale, 2012, 4, 5792–5813 RSC.
- N. Zhang, M. Q. Yang, Z. R. Tang and Y. J. Xu, ACS Nano, 2014, 8, 623–633 CrossRef CAS PubMed.
- C. Han, M. Q. Yang, N. Zhang and Y. J. Xu, J. Mater. Chem. A, 2014, 2, 19156–19166 CAS.
- L. Jia, D. H. Wang, Y. X. Huang, A. W. Xu and H. Q. Yu, J. Phys. Chem. C, 2011, 115, 11466–11473 CAS.
- D. H. Wang, L. Wang and A. W. Xu, Nanoscale, 2012, 4, 2046–2053 RSC.
- C. Han, M. Q. Yang, B. Weng and Y. J. Xu, Phys. Chem. Chem. Phys., 2014, 16, 16891–16903 RSC.
- H. Kato, H. Kobayashi and A. Kudo, J. Phys. Chem. B, 2002, 106, 12441–12447 CrossRef CAS.
- R. Sasikala, V. Sudarsan, C. Sudakar, R. Naik, L. Panicker and S. R. Bharadwaj, Int. J. Hydrogen Energy, 2009, 34, 6105–6113 CrossRef CAS PubMed.
- R. Sasikala, A. R. Shirole, V. Sudarsan, Jagannath, C. Sudakar, R. Naik, R. Rao and S. R. Bharadwaj, Appl. Catal., A, 2010, 377, 47–54 CrossRef CAS PubMed.
- R. Sasikala, A. R. Shirole and S. R. Bharadwaj, J. Colloid Interface Sci., 2013, 409, 135–140 CrossRef CAS PubMed.
- P. Chawla, S. P. Lochab and N. Singh, J. Alloys Compd., 2010, 492, 662–666 CrossRef CAS PubMed.
- J. Twu, P. K. Dutta and C. T. Kresge, Zeolites, 1991, 11, 672 CrossRef CAS.
- H. Kim, K. M. Kosuda, R. P Van Duyne and P. C. Stair, Chem. Soc. Rev., 2010, 39, 4820–4844 RSC.
- H. V Garcia, M. H. Velez, O. S. Garrido, J. M. M. Duart and J. Jimenez, IEE J. Solid-State Electron Devices, 1999, 43, 1171–1175 CrossRef.
- M. M. Garcia, H. Villavicencio, M. H. Velez, O. Sanchez and J. M. M. Duart, Mater. Sci. Eng., C, 2001, 15, 101–104 CrossRef.
- B. Yang, J. E. Schneeloch, Z. Pan, M. Furis and M. Achermann, Phys. Rev. B: Condens. Matter Mater. Phys., 2010, 81, 073401 CrossRef.
- R. V. Gulyaev, E. M. Slavinskaya, S. A. Novopashin, D. V. Smovzh, A. V. Zaikovskii, D. Yu. Osadchii, O. A. Bulavchenko, S. V. Korenev and A. I. Boronin, Appl. Catal., B, 2014, 147, 132–143 CrossRef CAS PubMed.
- F. Xiangqian, L. Jinyun, W. Yuteng, Z. Xiaoman, M. Fanli and L. Jinhuai, J. Mater. Chem., 2012, 22, 17782–17791 RSC.
- S. A. Vanalakar, R. C. Pawar, M. P. Suryawanshi, S. S. Mali, D. S. Dalavi, A. V. Moholkar, K. U. Sim, Y. B. Kown, J. H. Kim and P. S. Patil, Mater. Lett., 2011, 65, 548–551 CrossRef CAS PubMed.
- L. A. O’Dell, S. L. P. Savin, A. V. Chadwick and M. E. Smith, Solid State Nucl. Magn. Reson., 2007, 31, 169–173 CrossRef PubMed.
- R. Sasikala, V. Sudarsan and S. K. Kulshreshtha, J. Solid State Chem., 2002, 169, 113–117 CrossRef CAS.
- J. Klinowski, Annu. Rev. Mater. Sci., 1988, 18, 189–218 CrossRef CAS.
- Y. Kim and M. Yoon, J. Mol. Catal. A: Chem., 2001, 168, 257–263 CrossRef CAS.
- M. Khatamian, M. S. Oskoui and M. Haghighi, New J. Chem., 2014, 38, 1684–1693 RSC.
- R. Sasikala, A. R. Shirole, V. Sudarsan, V. S. Kamble, C. Sudakarb, R. Naik, R. Rao and S. R. Bharadwaj, Appl. Catal., A, 2010, 390, 245–252 CrossRef CAS PubMed.
- W. Sun, S. Zhang, Z. Liu, C. Wang and Z. Mao, Int. J. Hydrogen Energy, 2008, 33, 1112 CrossRef CAS PubMed.
- P. V. Kamat, J. Phys. Chem. C, 2007, 111, 2834–2860 CAS.
Footnote |
| † Electronic supplementary information (ESI) available: S1. Details of the photocatalytic reactor and irradiation chamber. Fig. S2. Emission profile of the fluorescent lamp used for photocatalysis. Fig. S3. More TEM images and SAED pattern of 20CdPdS-Z. Fig. S4. XRD patterns of fresh and used catalysts. See DOI: 10.1039/c4cp06105e |
| This journal is © the Owner Societies 2015 |

