
 Open Access Article
 This Open Access Article is licensed under a Creative Commons Attribution-Non Commercial 3.0 Unported Licence
Gold and silver nanoparticle monomers are non-SERS-active: a negative experimental study with silica-encapsulated Raman-reporter-coated metal colloids
Yuying
Zhang
,
Bernd
Walkenfort
,
Jun Hee
Yoon
,
Sebastian
Schlücker
and
Wei
Xie
*
Department of Chemistry, University of Duisburg-Essen, Universitätsstr. 5, 45141 Essen, Germany. E-mail: wei.xie@uni-due.de
First published on 1st December 2014
Abstract
Noble metal nanoparticles (NPs) are the most commonly employed plasmonic substrates in surface-enhanced Raman scattering (SERS) experiments. Computer simulations show that monomers of Ag and Au nanocrystals (“spherical” NPs) do not exhibit a notable plasmonic enhancement, i.e., they are essentially non-SERS-active. However, in experiments, SERS enhanced by spherical NP colloids has been frequently reported. This implies that the monomers do not have strong SERS activity, but detectable enhancement should more or less be there. Because of the gap between theory and practice, it is important to demonstrate experimentally how SERS-active the metal colloid actually is and, in case a SERS signal is observed, where it originates from. In particular the aggregation of the colloid, induced by high centrifugal forces in washing steps or due to a harsh ionic environment of the suspension medium, should be controlled since it is the very high SERS activity of NP clusters which dominates the overall SERS signal of the colloid. We report here the experimental evaluation of the SERS activity of 80 nm Au and Ag NP monomers. Instead of showing fancy nanostructures and super SERS enhancement, we present the method on how to obtain negative experimental data. In this approach, no SERS signal was obtained from the colloid with a Raman reporter on the metal surface when the NPs were encapsulated carefully within a thick silica shell. Without silica encapsulation, if a very low centrifugation speed is used for the washing steps, only a negligible SERS signal can be detected even at very high NP concentrations. In contrast, strong SERS signals can be detected when the NPs are suspended in acidic solutions. These results indicate that Au and Ag NP monomers essentially exhibit no SERS activity of practical relevance.
Introduction
Noble metal nanoparticles (NPs) are central components in surface-enhanced Raman scattering (SERS)1,2 as a widely used, highly sensitive molecular spectroscopic method in many fields including biomedical diagnostics3–6 and therapy,7,8 chemical reaction monitoring,9,10 environmental protection,11,12 and food analysis.13,14 When light resonantly interacts with noble metal NPs, electrons on the surface of the metal oscillate against the restoring force of the lattice ions. The frequency of this oscillation is related to the nature of the NPs (i.e. type of metal, size, shape, and interparticle distance), and also the dielectric environment. If the light frequency matches the plasma frequency of the electrons, an enhanced optical field is generated on the NP surface due to the localized surface plasmon resonance (LSPR), a condition under which the Raman scattering of analyte molecules on or near the metal surface is enhanced.15In the electromagnetic enhancement model, the enhanced scattering (SERS) intensity can be approximated by the fourth power of the electric field amplitude of the incident radiation |E|.2 Hot spots with a very high |E| value are usually desired for the generation of strong SERS signals. In this context, numerous metal nanostructures with high plasmonic activity, such as NP dimers,16–18 nanostars,19,20 nanoshells,21,22 and superstructures,7,23 have been synthesized as SERS substrates in the past decade.24 However, “spherical” Au and Ag NPs are still the most frequently used SERS substrates in many applications due to their easy and fast synthesis. Computer simulations demonstrate that spherical Au and Ag NPs cannot generate a strong localized electric field on their surface.25–28 On the other hand, these NPs are widely used in SERS experiments where high quality signals can be obtained from different analytes.29–32 Sometimes the NPs were aggregated before use to increase the SERS enhancement.33 However, in most cases no additional treatment is required and the NPs are simply mixed with the analyte before measuring the spectrum. These examples imply that “spherical” Au and Ag NP monomers are by far not as SERS-active as NP clusters, but the enhancement is sufficient for routine analysis.
Investigating the SERS activity of monomers at the ensemble level is challenging. Upon resonant light excitation, the NP clusters, including dimers, trimers and larger aggregates, exhibit very strong localized electric fields (hot spots) at the NP junctions due to the plasmon coupling between particles. SERS signals can be detected from a single dimer of spherical NPs.17,34 This single-particle sensitivity makes it very likely that NP clusters can dominate the enhancement of the entire ensemble. Another fact is that it is difficult to avoid the formation of NP clusters in the experiments.35 For example, NP clusters can be formed either during the centrifugation steps or when the NPs are suspended in the sample. To investigate the SERS activity of NP monomers, NP clusters should be excluded from the colloid.
In this contribution, we used 80 nm Au and Ag NPs to determine the SERS activity of the corresponding metal NP monomers. Two approaches were used to prevent the aggregation of the NPs: (1) encapsulation in a silica shell. After coating the NPs with a self-assembled monolayer of Raman reporter molecules, the NPs were encapsulated within a thick silica shell to control the minimum distance between the NPs. (2) Low centrifugation speed. Normally high centrifugation speeds are employed to shorten the centrifugation time. The combination of low centrifugation speed and long centrifugation times can avoid the aggregation caused by strong centrifugal forces.
Experimental
Materials and instruments
80 nm Au NPs were purchased from BBI Solutions. 4-Mercaptobenzoic acid (4-MBA) was purchased from TCI. Tetraethylorthosilicate (TEOS), silver nitrate, sodium citrate, L-ascorbic acid, sodium borohydride, ammonium hydroxide (25%), isopropanol, ethanol, and sulfuric acid were purchased from Sigma/Aldrich/Fluka. Glycerol was purchased from AppliChem. Polyvinylpyrrolidone K30 (PVP) was purchased from Carl Roth. All chemical reagents were used as received without further purification. In all experiments ultrapure water (18.2 MΩ) was used.Optical density values were recorded using a Jasco V-630 UV-Vis absorption spectrometer. NP size distributions and concentrations were measured by a Nanosight LM20 NP analysis system. TEM images were obtained using a Carl-Zeiss EM910 transmission electron microscope operating with an acceleration voltage of 120 kV. The NP washing steps were performed using a Hettich Mikro 200 centrifuge. SERS spectra were recorded on a WITec Alpha 300R microscope with a laser excitation wavelength of 632.8 nm (HeNe laser line).
Silica encapsulation
The 80 nm Au NPs were first incubated with 100 μM 4-MBA solution overnight to form a complete 4-MBA self-assembled monolayer (SAM) on the surface. Then they were centrifuged at a low speed (RCF 200g, 30 min). After discarding the supernatant, the NPs were resuspended in water to yield a colloid with an optical density of 5. Then 3 mL of the colloid was added dropwise to a mixture of 12.2 mL of isopropanol, 320 μL of an aqueous ammonium hydroxide solution (25%) and 1.5 mL of water under gentle stirring. 100 μL of a 1% TEOS ethanol solution was subsequently dropped to the reaction mixture every one hour to prepare thick silica shell-encapsulated Au NPs. After 3 times adding TEOS (300 μL in total), the mixture was stirred overnight at a low speed (400 rpm). The obtained NPs were washed 3 times with isopropanol and then resuspended in water.Synthesis of 80 nm Ag NPs
A modified seed-mediated method from ref. 36 was used to synthesize 80 nm Ag NPs. To synthesize ∼25 nm small Ag NP seeds, 20 mL of glycerol was mixed with 30 mL of water in a 100 mL flask and heated up to 104 °C under vigorous magnetic stirring (1200–1400 rpm). 10 mg of sodium citrate was dissolved in 1 mL of water and added to the solution in the flask. 1 mL of 0.5% aqueous AgNO3 solution was subsequently added. After 1 hour, the reaction system was cooled down and a yellow brown colloid was obtained. The obtained ∼25 nm Ag NPs were used as the seeds to produce 80 nm Ag NPs. In a 250 mL flask, 550 mg PVP was added to 138 mL of water together with 23 mL of glycerol. 5 mL of seeds (25 nm Ag NP suspension) were added under vigorous stirring. After 20 s, 1.15 mL of a mixture of 20 mg AgNO3, 1 mL of water, and 220 μL of ammonium hydroxide (25%) solution was added to the flask together with 92 mL of aqueous solution containing 36.8 mg ascorbic acid. The growth finished after 1 h. A gray yellow Ag colloid was obtained. To avoid clusters of Ag NPs, the centrifugation speed of any washing step was 360g (RCF).SERS measurements and NP tracking
SERS measurements on the silica shell-encapsulated Au NPs were performed after centrifugation and resuspension of the NPs. For measurements at different NP concentrations, the silica shell-encapsulated NPs were first centrifuged and then resuspended in water to yield colloids with optical densities (ODs) of 0.7, 2.8, 6.5, and 32, respectively. For experiments in H2SO4, the NPs were resuspended directly in the 10 mM acid solution after centrifugation. For the experiments on NPs without silica shells, the NPs (Au or Ag) were first incubated with 100 μM 4-MBA solution overnight to form a SAM on the surface. To ensure that no or only minimal aggregation takes place in the colloids, the NPs were washed very carefully at a very low centrifugation speed. 80 nm Au NPs were centrifuged at RCF 200g for 30 minutes and for 80 nm Ag NPs the speed was 360g. In all the washing steps Eppendorf protein LoBind tubes were used to avoid the formation of NP clusters. For the acid-induced aggregation experiments, the NPs were resuspended in the corresponding acid solutions, 10 mM and 1 M H2SO4 for Au and Ag, respectively. The mixture was measured at different time periods after the resuspension (Fig. 1).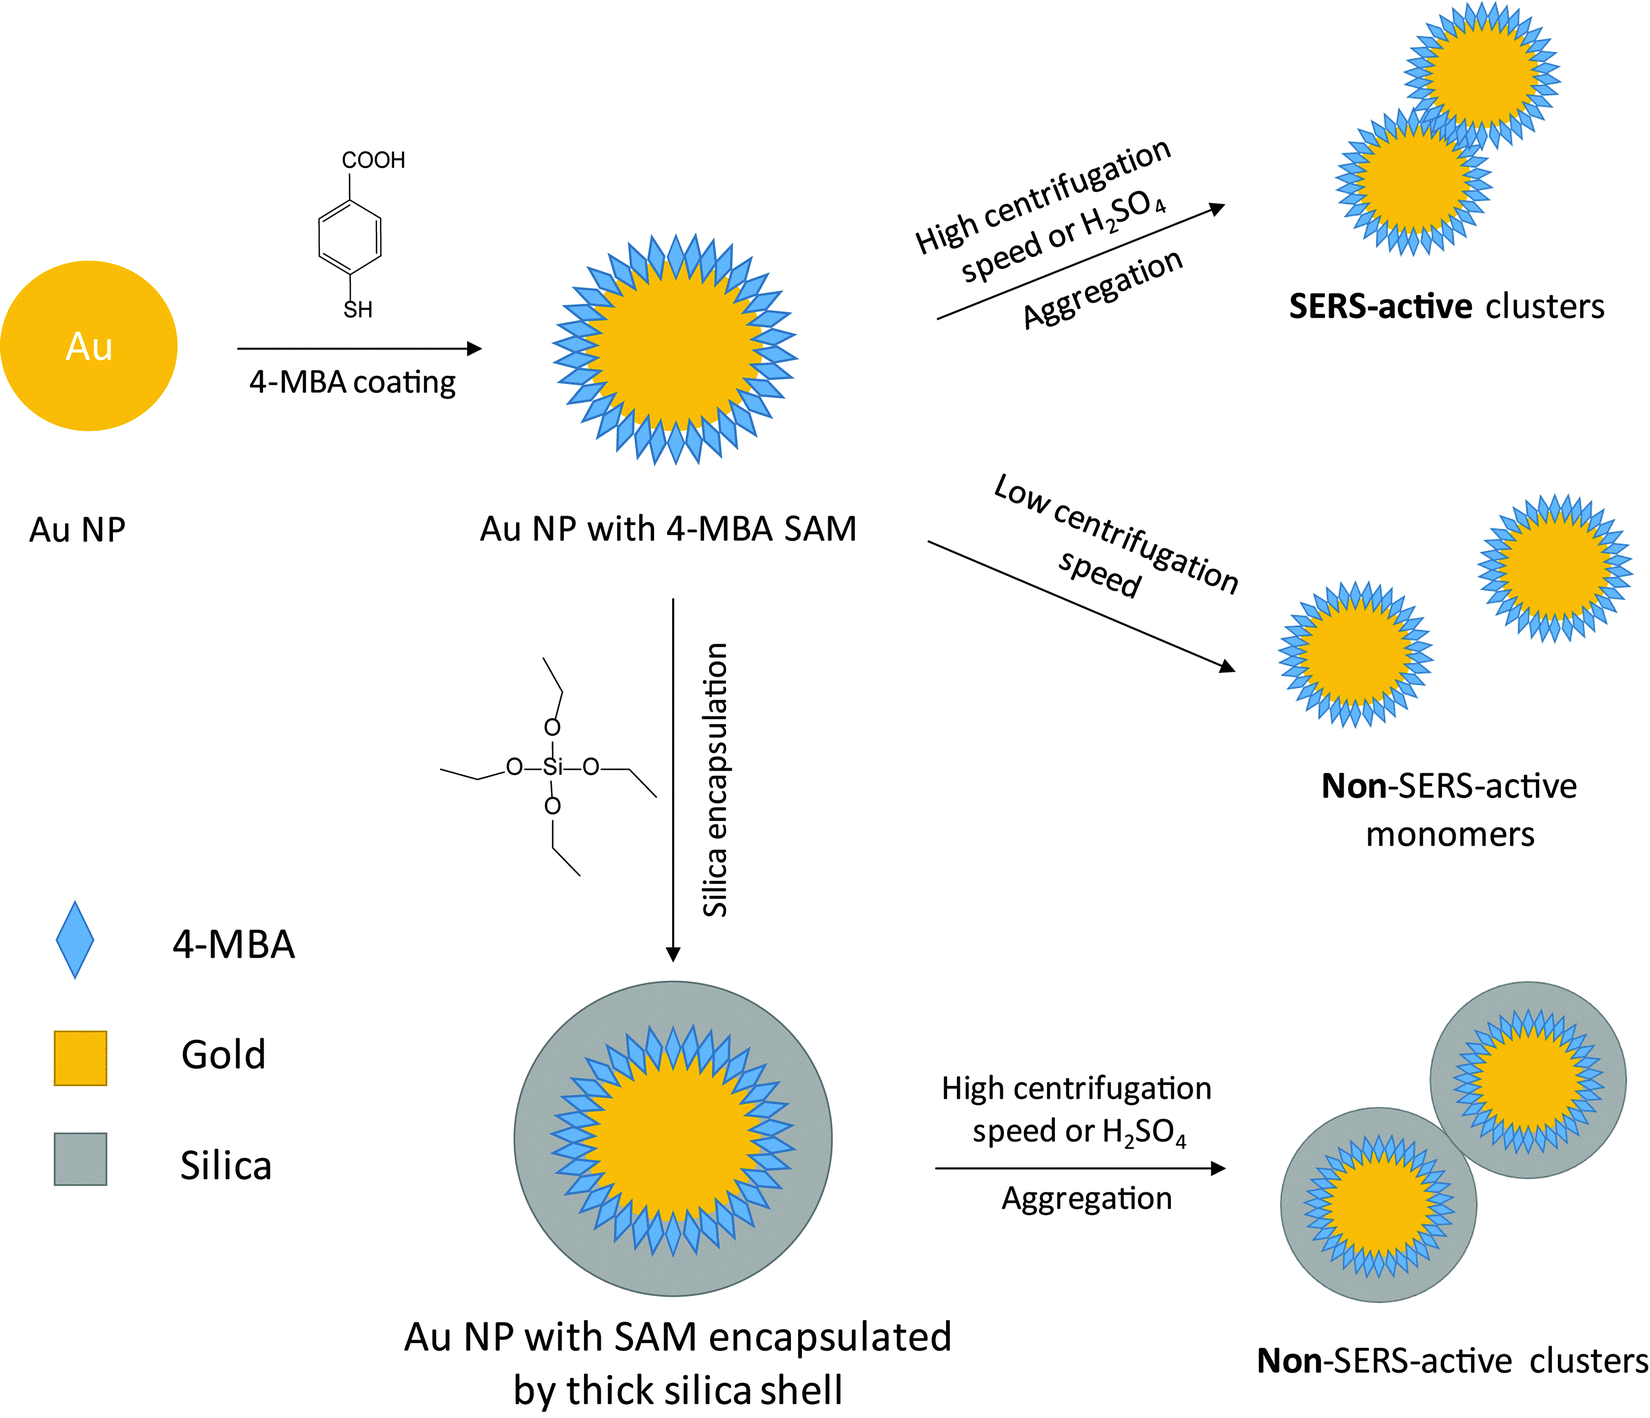 | ||
| Fig. 1 Preparation of SERS-active NP clusters and non-SERS-active Au NP monomers, both coated with a SAM of Raman reporter molecules (4-MBA). When the NPs are washed at a high centrifugation speed or are resuspended in acidic (or salt) solution, SERS-active clusters are formed (top right). Low speed centrifugation (middle right) and encapsulation within a thick silica shell (bottom right) leads to non-SERS-active colloids without plasmonic coupling between NPs. | ||
NP concentrations were measured using a light scattering-based tracking system. The extinction (OD = optical density = extinction calculated for d = 1 cm cuvette length) of the sample was first measured using a UV-Vis absorption spectrometer. Then the sample was diluted to an OD value of about 5 × 10⁻³ and placed in the sample cell. The Brownian motion of the NPs was followed due to the strong Rayleigh scattering of the moving particles when laser passed through the sample. The size distribution (hydrodynamic diameter) was calculated by the NP tracking system according to the Stokes–Einstein equation:
Result and discussion
Fig. 2a shows the incident electric field amplitude |E| distribution on an 80 nm Au sphere calculated by finite element method (FEM) simulations. The maximum |E| value is only 2.42, corresponding to a very small EF of about 34.3 according to the |E|4 approximation for the SERS enhancement; thus these Au NP monomers, theoretically, cannot generate strong SERS signals. However, in the experiments, it is difficult to exclude clusters, especially when there are many NP washing steps before the measurement or the NPs have to stay in harsh local environments such as high ionic strength or low pH values. We therefore encapsulated the Au NPs within a thick silica shell to prevent the NPs from getting close to each other and thereby from plasmonic coupling. Before the silica coating, the number of centrifugation steps was minimized. We only washed the NPs once after incubation with the 4-MBA Raman reporter solution. Low centrifugation speed (RCF 200g) and time (30 minutes) were applied to avoid the formation of NP clusters and also ensure the separation of the NPs and the supernatant.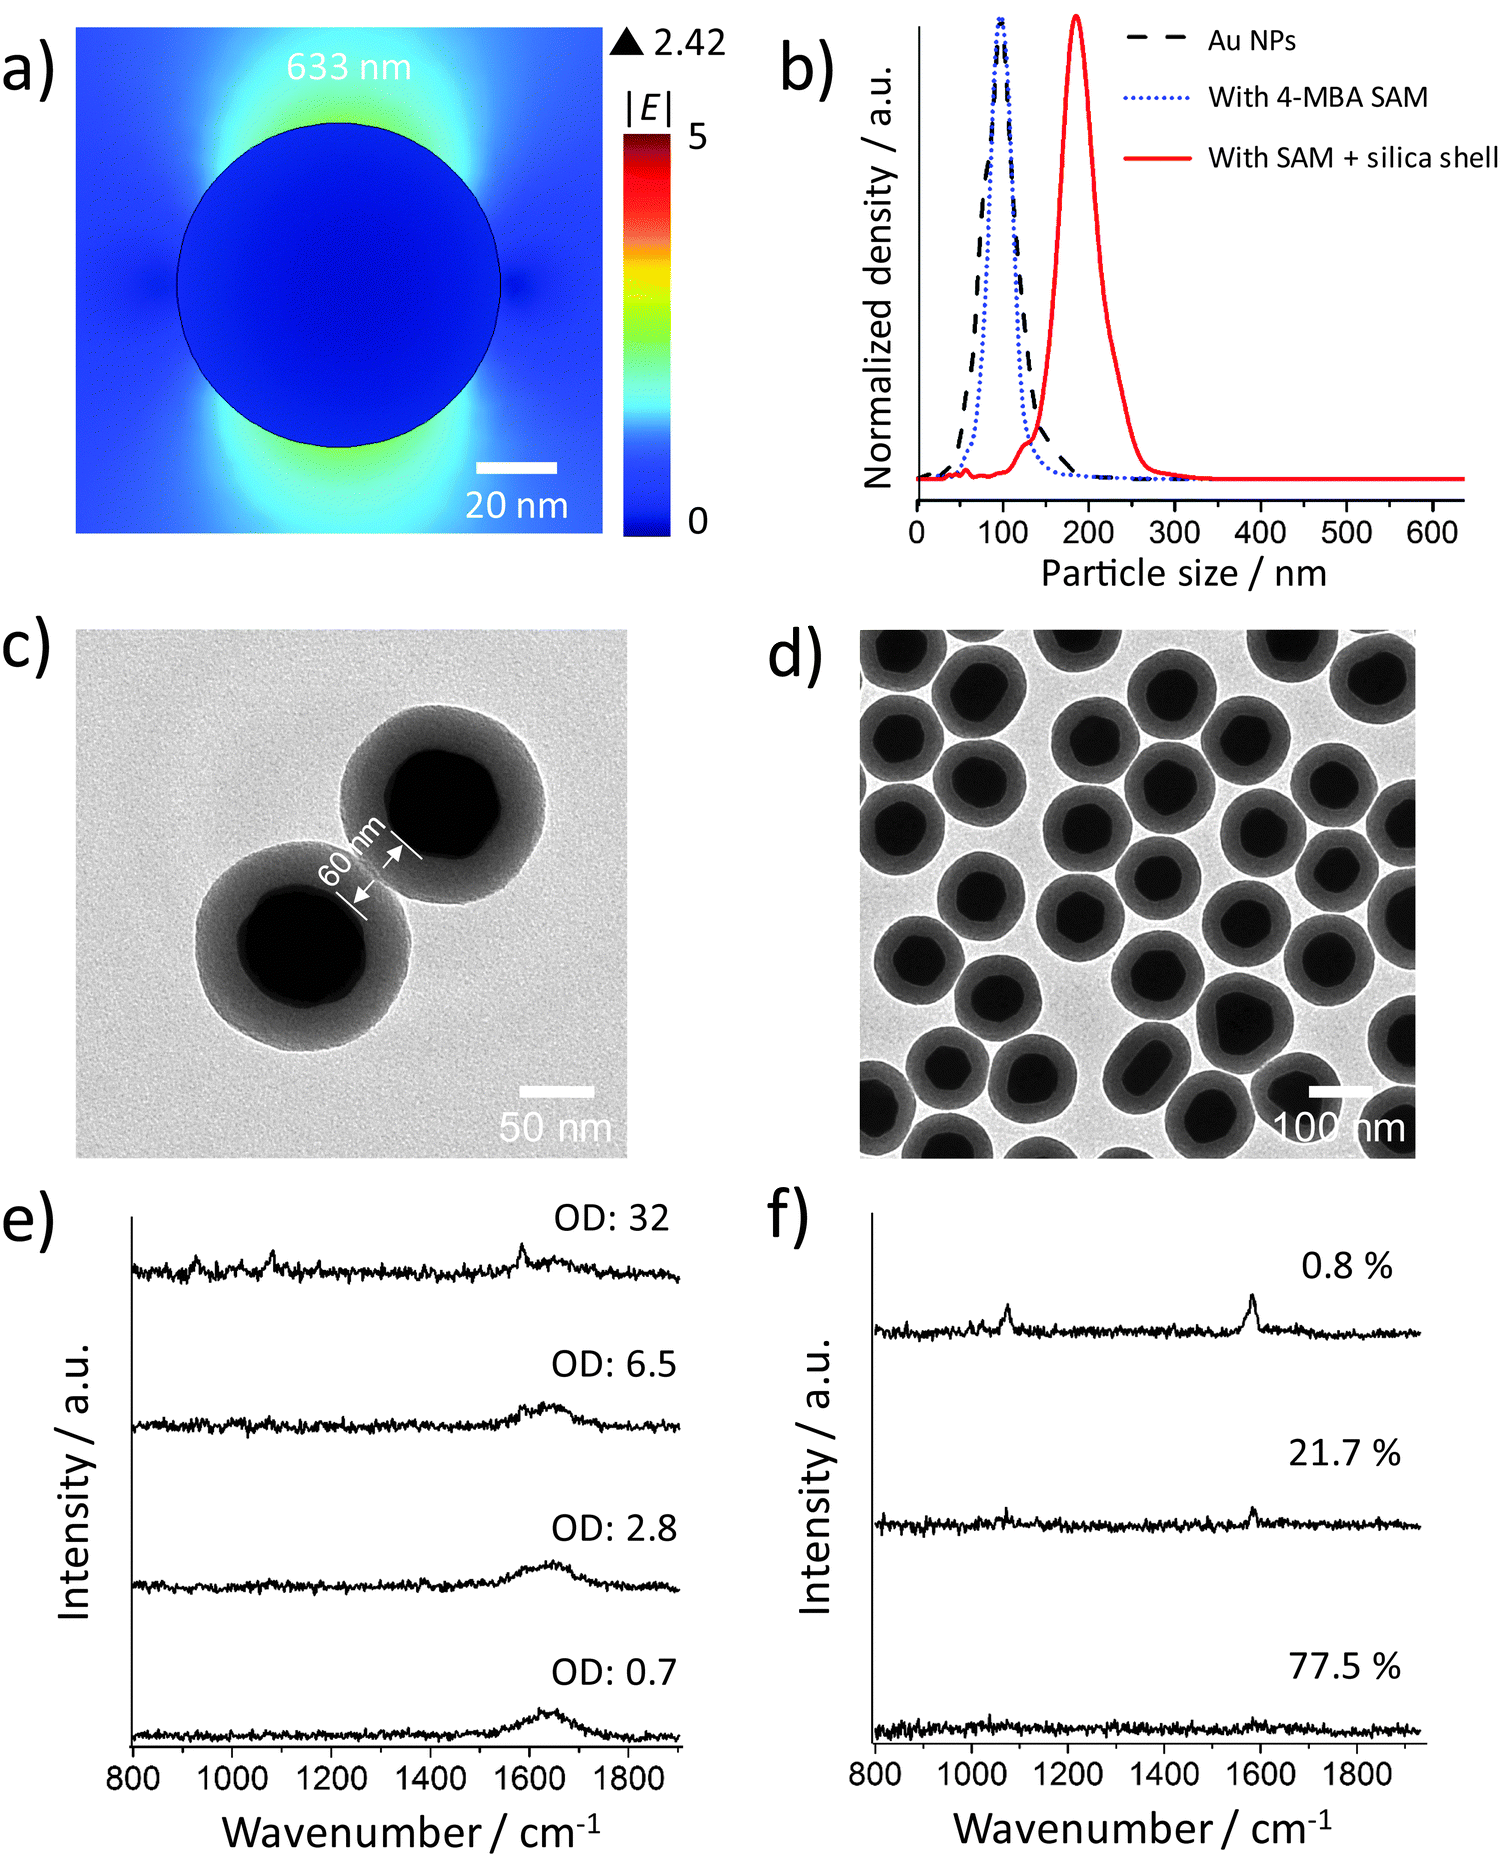 | ||
| Fig. 2 (a) FEM simulation of the incident electric field amplitude |E| distribution on a 80 nm Au sphere upon 633 nm excitation. (b) Size distribution of citrate protected 80 nm Au NPs, Au NPs with 4-MBA SAM and silica shell-encapsulated Au NPs with the SAM. (c) TEM image of a dimer of AuNPs with a thick silica shell. The minimum distance between the metal surfaces is about 60 nm. (d) TEM image of many silica shell-encapsulated Au NPs. (e) SERS spectra of the silica shell-encapsulated Au NP suspension measured at different NP concentrations. (f) Representative SERS spectra of the silica shell-encapsulated Au NP suspension with a high NP concentration (OD: 32) recorded at 1 s integration time. The percentages are the ratio of the corresponding type of spectrum in 120 total SERS spectra. | ||
The size distributions of the 80 nm Au NPs, the NPs with 4-MBA SAM, and the silica shell-encapsulated Au NPs, are shown in Fig. 2b. The encapsulation within a silica shell resulted in a larger hydrodynamic size of the NPs and no cluster was observed in all the three samples. It is important to mention again that the size determined by the Stokes–Einstein equation is the hydrodynamic size of the NPs, which is the real size plus two times the thickness of the electrical bilayer (distance from the NP surface to the slipping plane). TEM is obviously a better solution for measuring the NP size in a direct and accurate way. However, TEM cannot provide correct information on the NP status in suspension: the status of NPs under electron beam is not the original colloidal status and NPs can aggregate on TEM grids during the sample preparation. Thus the NP size distribution measured by the tracking system is necessary here to analyze the overall aggregation status. The thickness of the silica shell determined by TEM is about 30 nm and thus the minimum distance at which two NPs can approach each other is ∼60 nm (Fig. 2c). The colloid exhibits a good monodispersity (Fig. 2d) and we were not able to identify a single NP cluster inside the silica shell out of thousands of NPs on the TEM grids. In this case no plasmon coupling should take place, even when the particles are heavily aggregated.
SERS spectra recorded from colloids with different ODs (Fig. 2e) indicate that the NP monomers have negligible SERS activity. Even at OD 32, only a very weak SERS signal was observed. To avoid reabsorption of the photons at high NP densities, we focused the excitation laser beam and collected the SERS signal directly from the surface of the colloid in the cuvette. The NP concentrations of these samples were determined by using a single-NP tracking system which can follow individual NPs by their elastic light scattering. The measured NP concentration with an OD of 32 is (4.47 ± 0.73) × 1011 particles per mL, corresponding to about 450 million NPs in the detection volume (approximately 1 μL). The SERS signal at this concentration is very weak, but it is still possible that a few clusters in the sample mainly contribute to the observed low signal intensity. We measured the SERS spectra from the colloidal sample with an OD of 32 using 1 s integration time to check if the signal intensity is constant. Fig. 2f shows 3 representative spectra from 120 spectra in total. Only one spectrum is indicative of a moderate SERS enhancement, while all other spectra exhibit either a very weak signal (21.7%) or no signal at all (77.5%). Although we encapsulated the NPs very carefully, it is reasonable that there is still one dimer or other cluster in the same shell among 450 million NPs. When these very few clusters move into the focal volume via Brownian motion, we see the SERS signal that is much stronger than that in the other spectra. Anyway, in most cases there is no SERS enhancement when about 450 million NPs are in the detection volume, indicating that Au NP monomers do not have SERS activity in practice.
These experimental results agree very well with the simulations, but maybe different from our experience that high SERS signals can always be obtained from spherical Au NPs. It is well known that metal NP clusters or aggregates can generate hot spots for SERS enhancement.37 Here, we monitored this process by suspending the Au NPs in acidic solutions. The 80 nm Au NPs coated with a SAM of 4-MBA (without silica encapsulation) were centrifuged carefully at a low speed (RCF 200g) and then resuspended in 10 mM aqueous H2SO4. The SERS signal was recorded at different times after resuspension (Fig. 3a). The spectrum at 0 minutes was obtained by resuspending the NPs in water and no SERS signal was observed in this case. Increasing SERS signals can be recorded when the NPs are dispersed in acid, indicating that aggregation took place and hot spots were formed due to the plasmon coupling between the NPs. Fig. 3b shows the size distributions of the NPs before and 30 minutes after resuspension in H2SO4 (the dash line), which is the confirmation of the NP aggregation. The 80 nm spherical Au NPs are SERS-active only if there is strong plasmonic coupling between them.
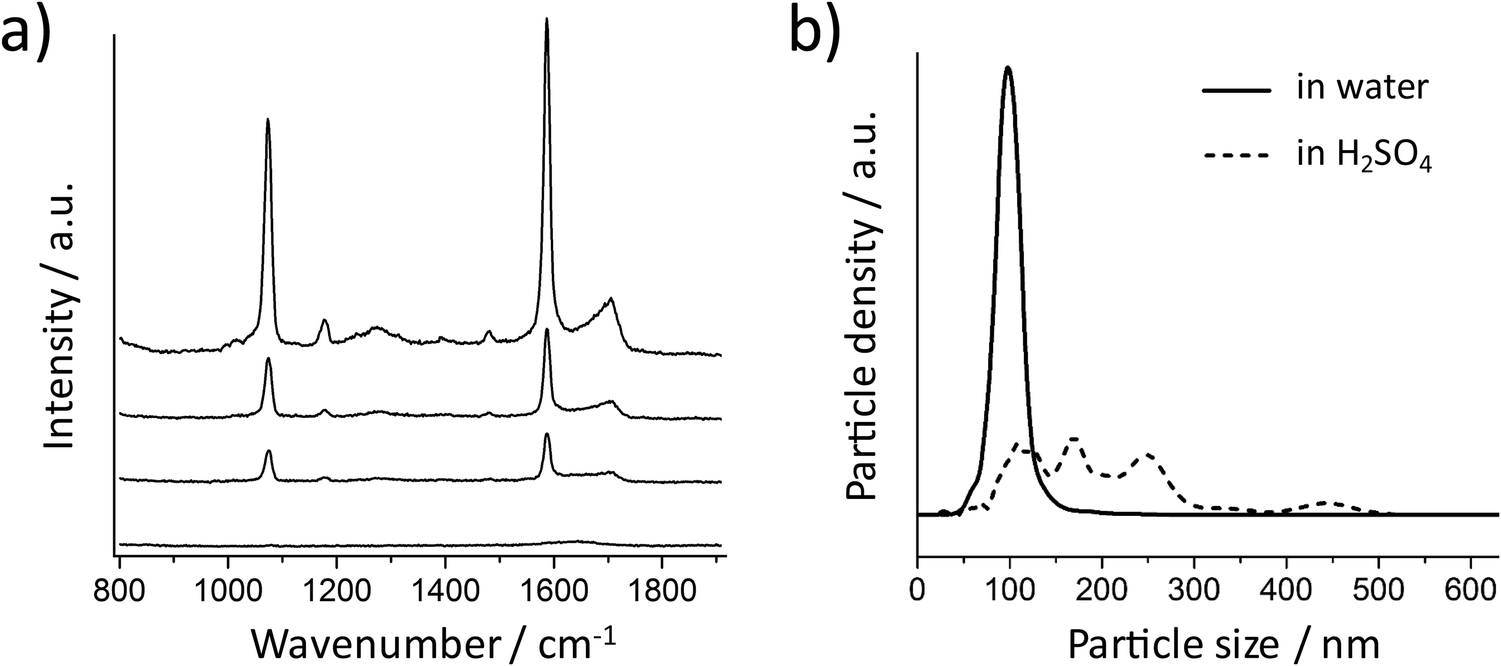 | ||
| Fig. 3 (a) SERS spectra of 4-MBA on Au NPs (without silica shell) recorded at different times after suspension in 10 mM H2SO4 solution. From bottom to top: 0 (before addition of acid), 1, 10, and 30 minutes. (b) Particle size distribution of the Au NPs with 4-MBA SAM in water (solid line) and after 30 minutes in the 10 mM H2SO4 solution (dashed line). | ||
We tested the same aggregation method using the silica encapsulated Au NPs. After one hour incubation of the NPs in 10 mM H2SO4, the SERS signal was recorded from the suspension (Fig. 4a). No signal from 4-MBA was detected although the NPs were heavily aggregated (see the inset of Fig. 4a). This is due to the thick silica shell encapsulation which prevents the metal surfaces from being closer than ∼60 nm. At this distance there is no strong plasmonic coupling between the metal NPs. However, in most SERS applications for the label-free detection of analytes, the metal NPs are not protected by a thick shell. For handling the NPs without silica shell protection, it is much easier to have a SERS-active colloid than to have suspension containing exclusively non-SERS-active monomeric NPs since NP clusters can easily be formed during the centrifugation steps and also due to the sample/analyte or even the container. The Au NPs coated with a 4-MBA SAM do not provide a sufficient SERS enhancement when centrifuged at a low speed (Fig. 4b bottom). The next question which arises is: can we detect a strong SERS signal when the NPs are condensed? We expected a high SERS activity from the condensed sample without silica shell encapsulation. To test if the high NP concentration can promote the formation of hot spots, the NPs were centrifuged and condensed to an extremely high concentration with an OD of 92. Surprisingly, no strong SERS signal was detected (Fig. 4b), indicating that the high density of NPs cannot bring them close enough to form hot spots. When the NPs are stable, the high concentration can probably only increase the chance of clusters to appear in the detection volume. The SERS activity will not change if there is no cluster in the sample. Here it has been demonstrated again that a slow centrifugation speed is essential for washing NPs without producing clusters. In a control experiment, a SERS signal was detected when a high centrifugation speed (RCF 2200g, 10 minutes) was used (Fig. 4b top).
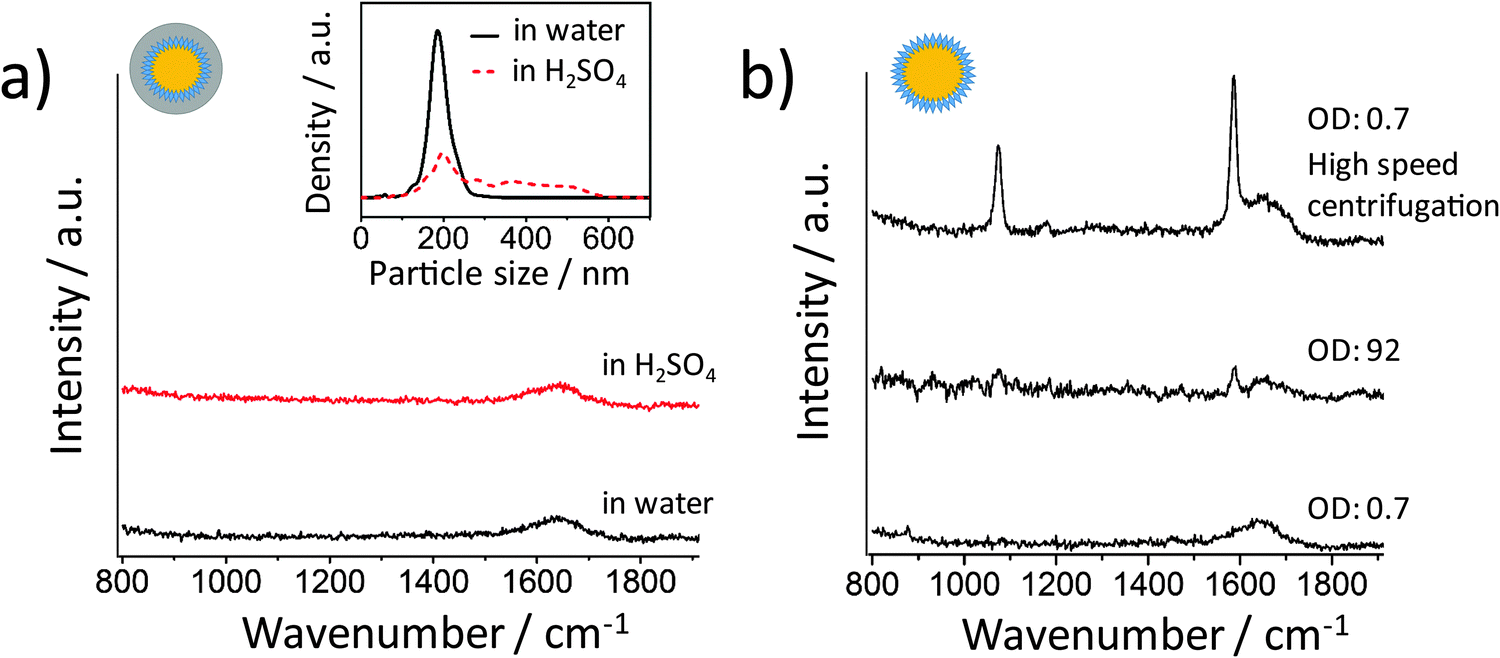 | ||
| Fig. 4 (a) SERS spectra of silica shell-encapsulated Au NPs with 4-MBA SAM after 60 minutes incubation in 10 mM H2SO4 (red) and in water (black). Inset: size distribution of the NPs in water and acid. (b) SERS spectra of 4-MBA-coated Au NPs (without silica shell). From bottom to top: a sample with a low NP concentration treated at a low centrifugation speed (RCF 200g), a sample with a very high NP concentration (low centrifugation speed) and a sample with a low NP concentration but treated at a high centrifugation speed (RCF 2200g). | ||
Silver is the most plasmonically active metal. However, FEM simulations show that 80 nm Ag spheres do not generate much higher |E| values, even at 514 nm excitation (Fig. 5a). We checked the SERS activity of Ag NPs in experiments (Fig. 5b). After incubation with 4-MBA solution, the NPs were centrifuged at RCF 360g for 30 minutes. No SERS signal was detected when they were resuspended in water. When they were resuspended in 1 M H2SO4, a strong SERS signal could be observed after 100 minutes incubation. High acid concentration was used here because the Ag NPs are much more stable in low concentration H2SO4 than the Au NPs. The size distribution of the Ag NPs was measured after an incubation period of 100 min in acid and the result indicates the formation of Ag NP clusters (Fig. 5c). Thus the 80 nm spherical Ag NPs are SERS-active only when clusters are formed.
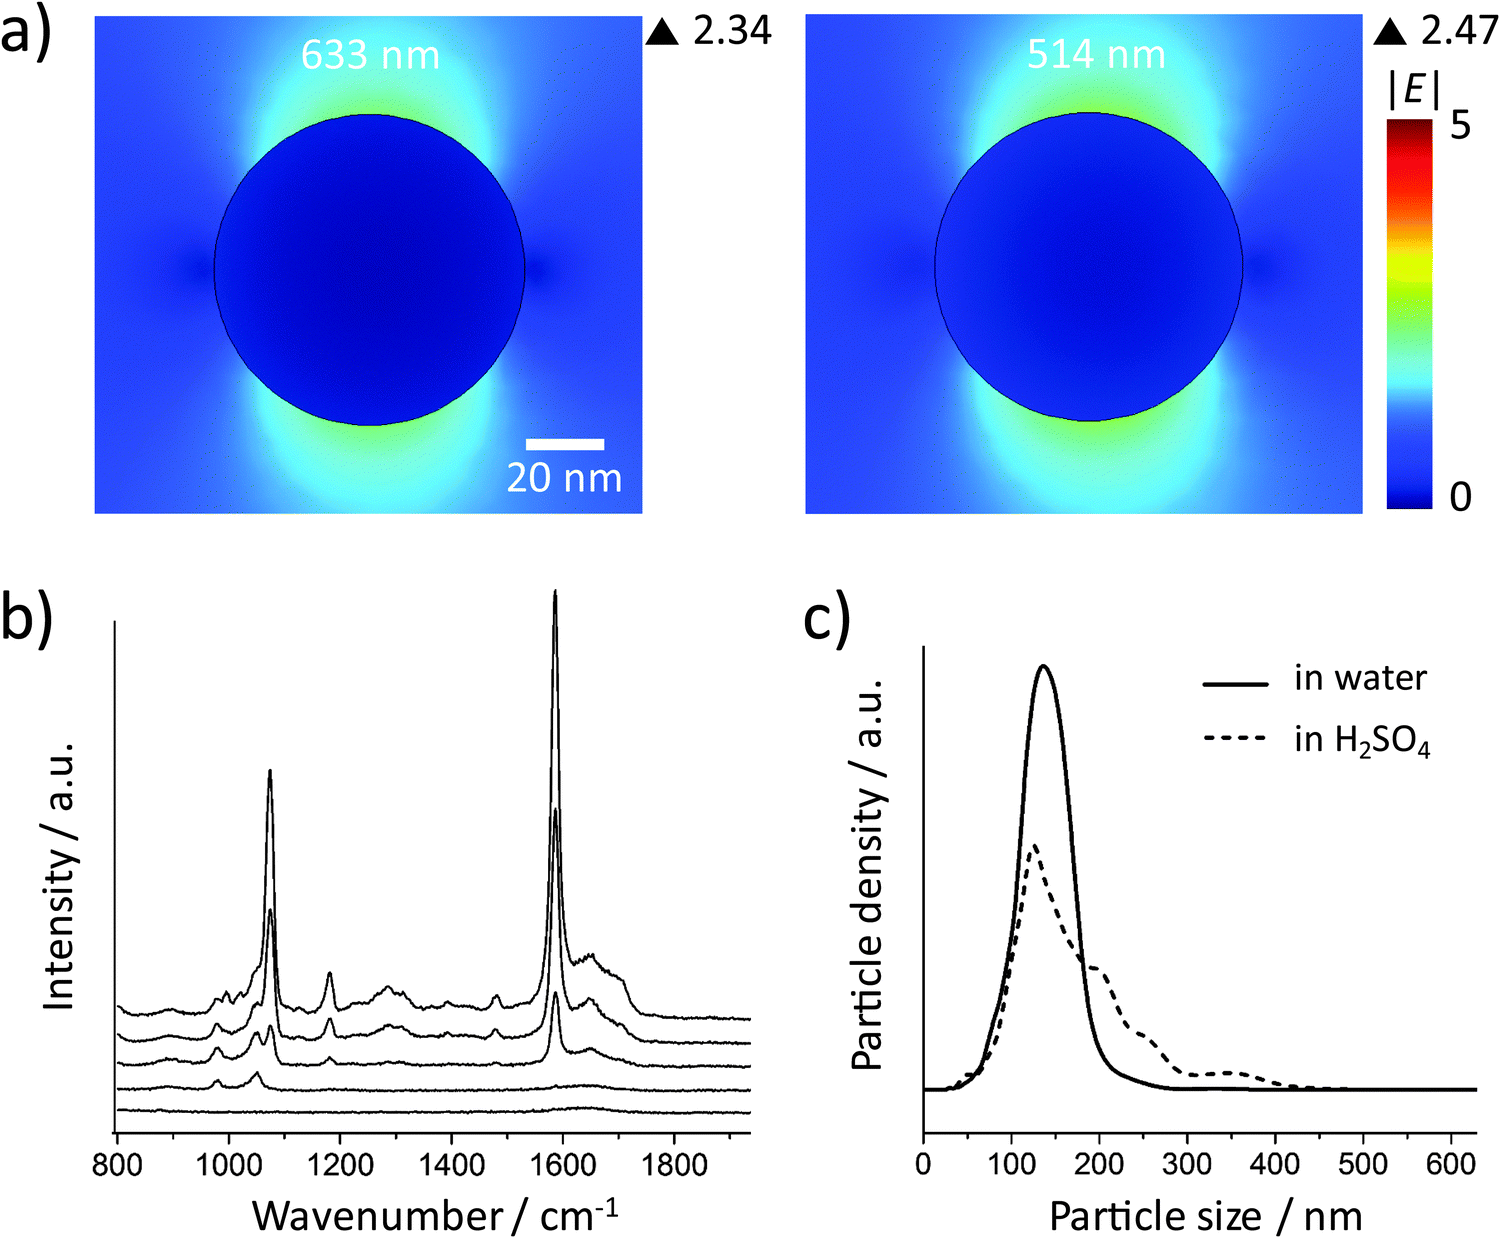 | ||
| Fig. 5 (a) FEM simulation of the incident electric field amplitude |E| distribution on a 80 nm Ag sphere upon 633 (left) and 514 (right) nm excitation. (b) SERS spectra of 4-MBA on the 80 nm Ag NPs measured at different time periods after the addition of 1 M H2SO4. From bottom to top: 0, 1, 30, 60, and 100 minutes. (c) Size distribution of the Ag NPs with 4-MBA SAM in water and after 100 minutes incubation in H2SO4. | ||
Conclusion
Instead of showing the design and synthesis of highly SERS-active metal nanostructures, we report here the negative result about SERS-inactive Au and Ag NPs under real application conditions, i.e. at the ensemble level in colloidal suspension. In this contribution, we investigated the SERS activity of “spherical” Au and Ag NP monomers by using 4-MBA as the Raman reporter. To ensure that the colloidal samples contain no or only a minimal number of NP clusters, the monomeric Au NPs were carefully coated with a 30 nm-thick silica shell and only low centrifugation speeds were employed during the washing steps. The resulting silica-encapsulated NPs exhibited a very high monodispersity and no clusters were identified. As predicted by computer simulations, the monomers showed negligible SERS enhancement since plasmon coupling between NPs could not occur. When the 4-MBA-coated Au NPs without a silica shell were suspended in H2SO4 or centrifuged at a high speed, strong SERS signals could be detected, indicating that only NP clusters can provide high SERS enhancement. Although Ag is more plasmonically active than Au, 80 nm Ag spheres also showed no SERS activity when a slow centrifugation speed was used to avoid the formation of clusters. This study confirmed experimentally that “spherical” noble metal NP monomers are non-SERS-active in routine analysis. In summary, one should thus bear in mind that in the case of “spherical” Au and Ag NPs the high-intensity SERS spectra – independent of whether they have been recorded from small Raman reporter molecules or from living cells – are generated by NP clusters and not from monomeric NPs.Acknowledgements
This work was supported by the Deutsche Forschungsgemeinschaft (DFG, XI 123/1-1 and CRC 1093 project A9).References
- Principles of Surface-Enhanced Raman Spectroscopy, E. C. Le Ru and P. G. Etchegoin, Elsevier, Amsterdam, Netherlands, 2009 Search PubMed.
- S. Schlücker, Angew. Chem., Int. Ed., 2014, 53, 4756–4795 CrossRef PubMed.
- Surface-Enhanced Raman Spectroscopy: Analytical, Biophysical and Life Science Applications, ed. S. Schlücker, Wiley-VCH, Weinheim, Germany, 2011 Search PubMed.
- Y. Q. Wang, B. Yan and L. X. Chen, Chem. Rev., 2013, 113, 1391–1428 CrossRef CAS PubMed.
- M. Vendrell, K. K. Maiti, K. Dhaliwal and Y. T. Chang, Trends Biotechnol., 2013, 31, 249–257 CrossRef CAS PubMed.
- W. Xie and S. Schlücker, Phys. Chem. Chem. Phys., 2013, 15, 5329–5344 RSC.
- J. B. Song, J. J. Zhou and H. W. Duan, J. Am. Chem. Soc., 2012, 134, 13458–13469 CrossRef CAS PubMed.
- W. T. Lu, A. K. Singh, S. A. Khan, D. Senapati, H. T. Yu and P. C. Ray, J. Am. Chem. Soc., 2010, 132, 18103–18114 CrossRef CAS PubMed.
- W. Xie, B. Walkenfort and S. Schlücker, J. Am. Chem. Soc., 2013, 135, 1657–1660 CrossRef CAS PubMed.
- W. Xie, C. Herrmann, K. Kömpe, M. Haase and S. Schlücker, J. Am. Chem. Soc., 2011, 133, 19302–19305 CrossRef CAS PubMed.
- D. Bhandari, M. J. Walworth and M. J. Sepaniak, Appl. Spectrosc., 2009, 63, 571–578 CrossRef CAS PubMed.
- S. Sarkar, M. Pradhan, A. K. Sinha, M. Basu and T. Pal, Chem. – Eur. J., 2012, 18, 6335–6342 CrossRef CAS PubMed.
- A. P. Craig, A. S. Franca and J. Irudayaraj, Annu. Rev. Food Sci. Technol., 2013, 4, 369–380 CrossRef CAS PubMed.
- R. M. El-Abassy, P. Donfack and A. Materny, J. Raman Spectrosc., 2009, 9, 1284–1289 CrossRef.
- P. L. Stiles, J. A. Dieringer, N. C. Shah and R. P. Van Duyne, Annu. Rev. Anal. Chem., 2008, 1, 601–626 CrossRef CAS PubMed.
- K. L. Wustholz, A. I. Henry, J. M. McMahon, R. G. Freeman, N. Valley, M. E. Piotti, M. J. Natan, G. C. Schatz and R. P. Van Duyne, J. Am. Chem. Soc., 2010, 132, 10903–10910 CrossRef CAS PubMed.
- D. Steinigeweg, M. Schütz, M. Salehi and S. Schlücker, Small, 2011, 7, 2443–2448 CrossRef CAS.
- G. Chen, Y. Wang, M. X. Yang, J. Xu, S. J. Goh, M. Pan and H. Y. Chen, J. Am. Chem. Soc., 2010, 132, 3644–3645 CrossRef CAS PubMed.
- M. Schütz, D. Steinigeweg, M. Salehi, K. Kömpe and S. Schlücker, Chem. Commun., 2011, 47, 4216–4218 RSC.
- L. Minati, F. Benetti, A. Chiappini and G. Speranza, Colloids Surf., A, 2014, 441, 623–628 CrossRef CAS PubMed.
- B. Küstner, M. Gellner, M. Schütz, F. Schöppler, A. Marx, P. Ströbel, P. Adam, C. Schmuck and S. Schlücker, Angew. Chem., Int. Ed., 2009, 48, 1950–1953 CrossRef PubMed.
- J. K. Yang, H. Kang, H. Lee, A. Jo, S. Jeong, S. J. Jeon, H. I. Kim, H. Y. Lee, D. H. Jeong, J. H. Kim and Y. S. Lee, ACS Appl. Mater. Interfaces, 2014, 6, 12541–12549 CAS.
- M. Gellner, D. Steinigeweg, S. Ichilmann, M. Salehi, M. Schütz, K. Kömpe, M. Haase and S. Schlücker, Small, 2011, 7, 3445–3451 CrossRef CAS PubMed.
- W. Xie and S. Schlücker, Rep. Prog. Phys., 2014, 77, 116702 CrossRef PubMed.
- C. E. Talley, J. B. Jackson, C. Oubre, N. K. Grady, C. W. Hollars, S. M. Lane, T. R. Huser, P. Nordlander and N. J. Halas, Nano Lett., 2005, 5, 1569–1574 CrossRef CAS PubMed.
- B. M. Ross and L. P. Lee, Opt. Lett., 2009, 34, 896–898 CrossRef CAS.
- M. Rycenga, M. R. Langille, M. L. Personick, T. Ozel and C. A. Mirkin, Nano Lett., 2012, 12, 6218–6222 CrossRef CAS PubMed.
- J. M. McLellan, Z. Y. Li, A. R. Siekkinen and Y. N. Xia, Nano Lett., 2007, 7, 1013–1017 CrossRef CAS PubMed.
- W. Xie, L. Wang, Y. Y. Zhang, L. Su, A. G. Shen, J. Q. Tan and J. M. Hu, Bioconjugate Chem., 2009, 20, 768–773 CrossRef CAS PubMed.
- Y. F. Huang, M. Zhang, L. B. Zhao, J. M. Feng, D. Y. Wu, B. Ren and Z. Q. Tian, Angew. Chem., Int. Ed., 2014, 53, 2353–2357 CrossRef CAS PubMed.
- A. Huefner, W. L. Kuan, R. A. Barker and S. Mahajan, Nano Lett., 2013, 13, 2463–2470 CrossRef CAS PubMed.
- J. Kneipp, H. Kneipp, W. L. Rice and K. Kneipp, Anal. Chem., 2005, 77, 2381–2385 CrossRef CAS PubMed.
- K. Kneipp, A. S. Haka and H. Kneipp, Appl. Spectrosc., 2002, 56, 150–154 CrossRef CAS.
- S. M. Stranahan, E. J. Titus and K. A. Willets, J. Phys. Chem. Lett., 2011, 2, 2711–2715 CrossRef CAS.
- F. L. Wang, R. G. Widejko, Z. Q. Yang, K. T. Nguyen, H. Y. Chen, L. P. Fernando, K. A. Christensen and J. N. Anker, Anal. Chem., 2012, 84, 8013–8019 CrossRef CAS PubMed.
- D. Steinigeweg and S. Schlücker, Chem. Commun., 2012, 48, 8682–8684 RSC.
- L. Guerrini and D. Graham, Chem. Soc. Rev., 2012, 41, 7085–7107 RSC.
| This journal is © the Owner Societies 2015 |