Dual relaxation and structural changes under uniaxial strain in main-chain smectic-C liquid crystal elastomer
Dena M.
Agra-Kooijman
a,
Michael R.
Fisch
b,
Leela
Joshi
ac,
Wanting
Ren
d,
Philip J.
McMullan
d,
Anselm C.
Griffin
d and
Satyendra
Kumar
*a
aDepartment of Physics, Kent State University, Kent, OH 44242, USA. E-mail: skumar@kent.edu
bCollege of Applied Engineering Sustainability and Technology, Kent State University, Kent, OH 44242, USA
cDepartment of Physics, Amrit Campus, Tribhuvan University, Kathmandu, Nepal
dSchool of Materials Science and Engineering, Georgia Institute of Technology, Atlanta, GA 30332, USA
First published on 7th November 2014
Abstract
The relationship between strain-dependent macroscopic elastic behavior and the changes in microscopic structure of the smectic-C liquid crystal elastomer (LCE), C11MeHQSi8 were investigated using synchrotron X-ray studies. At very low strains ε ≤ 0.2, the smectic layers are randomly oriented. As the strain increases beyond 0.2, the smectic layers reorient and become parallel to the direction of the applied strain. The polydomain to monodomain (P–M) transition accompanied by the formation of chevron structure ensues for ε > 0.2 and is nearly complete for ε = 0.7. The chevron structure relaxes after the applied strain changes, with a time constant τα ∼ 45 min while the orientation order parameters of the mesogenic and elastomeric components gradually increase and saturate at 0.83 and 0.4, respectively at ε = 1.7 which is near the end of the plateau region. Relaxation rates τα for the tilt angle and τd corresponding to the smectic layer spacing both become about 10 times faster when the strain exceeds 0.7. The LCE remains “locked” into the monodomain state and retains 90% and 80% values of α and S, respectively for 24 hours after the applied strain is removed. The viscoelastic properties of the liquid crystal appear to dominate the equilibration process at low strains while the elastomeric properties control the system's response at high strains.
Introduction
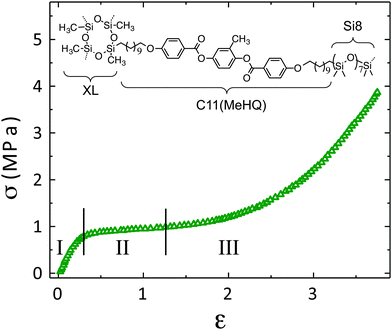
Liquid crystal elastomers1 (LCE) uniquely combine the orientational and translational order of liquid crystals2 with the disordering tendency of crosslinked polymers.3,4 Qualitatively, the anisotropic field imposed by the liquid crystalline (LC) order of mesogens is expected to render the polymer conformation anisotropic. The coupling and inherent competition between LC and polymer properties manifests itself in their interesting thermo-mechanical response,5,6soft elasticity,7–12 and the shape memory effect.13,14At temperatures far below the clearing temperature, the elastic response of LCEs depends on the applied stress and can be divided into three regions15–17 shown in Fig. 1. In the first linear elastic region I, the response (strain) of an LCE to low level of stress is linear in accordance with the Hooke's law and is fully reversible. In the second non-elastic reversible region II, it exhibits large elongation with minimal increase in the applied stress. The sample partially recovers its length when stress is removed. This phenomenon of soft elasticity in LCEs is reflected in a plateau in the stress–strain curve.18–21 In this region, an initially polydomain sample transforms into a pseudo-monodomain22 (referred to as the monodomain) configuration.23,24 The free energy of the system remains invariant24 while permitting continuous reorientation of the director (i.e., the direction of mesogens' symmetry axis) and the symmetry axis of the (anisotropic) polymer chain conformation towards the stretch direction. When the reorientation process is complete, the LCEs again become stiff in the non-elastic and partially irreversible region III with an elastic modulus comparable to that of pure elastomers.
In the case of polydomain samples crosslinked in the isotropic (melt) state, the plateau19–21 arises from shear-induced reorientation of a local LC director of each microdomain25–27 towards the stretch direction. On the other hand, a polydomain elastomer prepared in the anisotropic nematic state may “lock-in” the local director orientations and require a much higher strain to reorient them.21 In a polydomain nematic elastomer, local directors undergo reorientation towards the strain direction and affect the polydomain to monodomain (P–M) transition. Similarly, in smectic elastomers, it costs minimal energy for the layers in a microdomain to collectively undergo rotation in response to an external strain. The situation is slightly more complicated in the smectic-C (SmC) LCEs where the director is tilted at a fixed polar angle with respect to the smectic layer normal, but has the freedom to reorient azimuthally. Soft elasticity of SmC elastomers is predicted9 to arise from reorientations of, both, the smectic layers as well as the local directors relative to the smectic layer normal. In the final optically uniform (or monodomain) state, the director of all monodomains is parallel to the strain direction while smectic layers acquire a conical orientational distribution about the macroscopic director. Such monodomains have been reported in both side-chain28 and main-chain29–31 LCEs.
The intriguing elastic behavior of LCEs under applied stress has been the subject of several experimental5,6,21,29,32 and theoretical1,25,33–35 investigations. The relationship between strain and stress and, in some cases, the relaxation behavior36–39 has been well characterized. However, the relationship between the macroscopic behavior and the changes in microscopic organization or structure has not been established. In this paper, we report the results of synchrotron X-ray investigations conducted on main chain SmC LCEs. Some of the (preliminary) results were included in a review article12 on soft elasticity of LCEs. Here, we present a complete data analysis and explanation of the changes in their structure, order parameters, and the relaxation processes at the microscopic level. The results provide deeper understanding of the dynamics of microscopic changes that occur at varying degree of strain, how their elastic behavior is related to their microscopic structure, and what mechanism(s) govern the relaxation dynamics during the application/removal of strain in these materials. Soft-elasticity in the second region is one of the foci of this study. The results provide insights into the role of the anisotropic LC and isotropic polymeric components of the system in their microscopic and macroscopic behavior.
Experimental
The SmC main-chain liquid crystal elastomer (C11MeHQSi8), shown in Fig. 1, was prepared15,40 as a film in polydomain state at room temperature. An elastomer strip (3 mm × 6 mm, ∼0.3 mm thick) was mounted in an Instec (model HCS402) hotstage equipped to regulate sample temperature to ±0.1 °C. One end of the elastomer strip was clamped to a fixed support in the oven while the other end was attached to a motorized support, which allowed linear motion with a precision of 122 nm. It was used to apply a predetermined strain. The elastomer sample of initial length L0 was in situ stretched by ΔL at a rate of 0.4 mm s−1, to generate a uniaxial strain ε = ΔL/L0. The hotstage was translated in the opposite direction by ΔL/2 to keep the same sample volume in the X-ray beam.The liquid crystalline structure of C11MeHQSi8 film was investigated by synchrotron X-ray diffraction at beamline 6ID-B of the Advanced Photon Source, Argonne National Laboratory. An X-ray beam of 100 × 100 μm2 cross-section and wavelength of 0.765335 Å was used. Diffraction patterns were collected using a Marresearch image plate detector (MAR345) with 100 μm pixel size placed at a distance of 513.2 mm. The data were calibrated using the NIST 640C silicon standard.
Samples were systematically subjected to varying uniaxial strains. At each strain, the sample was allowed to relax while the associated changes in its microscopic structure were investigated with X-ray diffraction as a function of time. The exposure and readout times of the image plate detector limited the number of diffraction patterns that could be acquired before the sample reached equilibrium. Seven diffraction patterns, each about 3 min apart, were recorded over a period of approximately 22 minutes after each change in the applied strain. To estimate strain retention, the lower clamp was removed to release the applied stress. A weight of ∼0.3 g was attached to the free end of the film to keep it flat. The sample was allowed to recover for ∼24 h before determining the changes in its structure. Sample temperature was gradually raised while performing X-ray diffraction scans to investigate the effect of thermal annealing and to facilitate sample length recovery.
Three samples, S1, S2 and S3, were cut from the same film. Sample S1 was strained at an interval of Δε = 0.4 from ε = 0 to 3. It was then removed from the hotstage and preserved for ∼24 h for length recovery. Length recovery measurements were carried out while raising sample temperature above TI at 1 °C min−1. Sample S2 was strained to ε = 3 in increments of unity. Data collection was started within two minutes of the changes in the strain and continued until no significant structural changes were observed. The experiment was repeated on S3 after six months but with smaller strain intervals of 0.1 to obtain the details of the structural changes that occur across the P–M transition. The changes occurring in the sample during this time were determined from the analysis of the diffracted X-ray intensity vs. q plots (2θ-scan) and azimuthal (or, χ-) scans generated from the three peaks using the FIT2D41 program. The smectic layer thickness d was determined from 2θ-scans of the small angle peak, and the angle between the layer normal and uniaxial strain direction α (or chevron angle) from the separation of two small angle peaks in the χ-scans. The orientational order parameter, S was calculated from χ-scans of the wide-angle peak using the method employed by Davidson, et al.42 The measured value of S depends on both the orientational distribution of the director of individual domains and the intrinsic orientational order parameter of each domain.
Results and discussion
Structural changes vs. applied strain
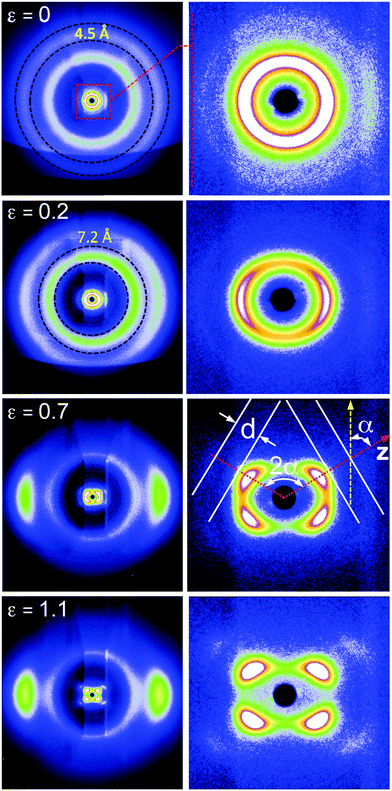
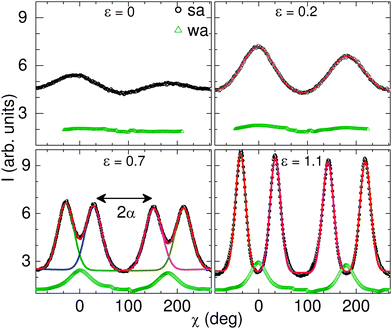
Representative diffraction patterns acquired after the sample had nearly reached equilibrium at each strain (ε = 0, 0.2, 0.7 and 1.1) and enlarged views of the small-angle region are shown on the right hand side in Fig. 2. The presence of the two (outer) reflections at ∼4.5 Å and ∼7.2 Å corresponding to the lateral separation between the hydrocarbon and siloxane segments of the molecule and polymer chains, respectively, suggests their segregation14 at molecular level. The 7.2 Å diffraction ring suggests that the siloxane segments remain in a highly coiled (disordered) state15 at low strains. The innermost peak (on right hand side) arises from the strain dependent smectic layer spacing ranging from 45 Å to 49 Å over the full range of applied strains.The χ-scan for ε = 0 (Fig. 3) shows small intensity modulation which is attributed to slight stretching of the film during the sample mounting process. At low strains (ε ∼ 0.2), small angle scattering becomes concentrated into two broad arc-like reflections parallel to the (vertical) stretch direction indicating that the smectic layers are oriented parallel to the strain direction. The wide-angle diffuse rings (Fig. 2) remain nearly unchanged. It is not surprising that S calculated from the large angle peaks in this region is close to zero for both the hydrocarbon and siloxane components, Fig. 4. This confirms that the director orientation of smectic (micro) domains is random.
Soft-elasticity in the plateau (0.3 < ε < 1.5) region of the stress–strain curve (Fig. 1) is believed to arise from reorientation of the directors of individual domains towards the stretch direction and the soft-mode19,20 associated with the azimuthal rotation of the mesogens (and local director) about the SmC layer normal which leaves the layer spacing unchanged. Eventually, in the final configuration, the smectic layers are inclined at a fixed polar angle with respect to the direction of strain and the director, but are azimuthally degenerate. Since X-ray diffraction probes the arrangement of molecules in the plane perpendicular to the scattering vector, the distribution of smectic layers appear as chevron-like with its apex parallel to the strain direction. The cone (chevron) angle α can be directly determined from the pairs of small angle peaks.
Small angle reflections at intermediate strains retain the general arc shape but their analysis reveals the presence of two peaks within each arc suggesting an emergence of chevron-like arrangement of smectic layers. The peaks become fully resolved (Fig. 2 and 3) at ε = 0.7 with chevron apex along the stretch direction. The second order small angle smectic reflection become visible at ε = 1.1, Fig. 2. This confirms a highly condensed smectic density wave in these materials. As the strain increases, the two peaks become sharper and the separation between them increases. The large-angle diffraction rings at 4.5 Å and ∼7.2 Å from mesogenic (hydrocarbon) and polymeric (siloxane) components, respectively, also acquire noticeable intensity modulation due to increasing macroscopic orientational order along the strain direction.
Clearly, the initial polydomain structure progressively transforms into chevron-like, Fig. 2, SmC configuration, often referred to as the monodomain structure. The chevron structure becomes better defined and the four peaks gradually become sharper as the strain is increased above ε = 0.7. The presence of second order smectic reflections at these strains confirms that the smectic order remains well developed in these systems.
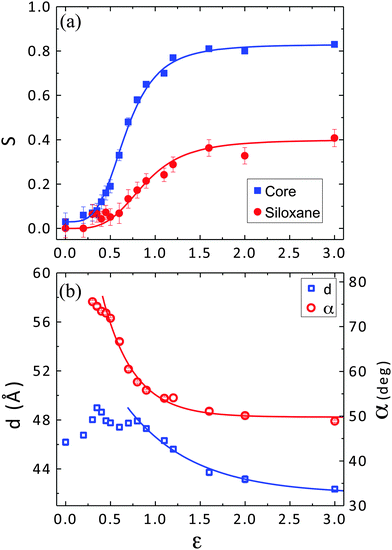
The intensity of the 4.5 Å peak gradually becomes concentrated in the equatorial direction indicating that the mesogenic molecules are oriented vertically parallel to the stretch direction. The wide-angle siloxane ring at 7.2 Å also develops intensity modulation transforming it into a pair of arc-like peaks in the horizontal direction. Clearly, the siloxane segments and mesogens are both oriented vertically, i.e., parallel to the strain direction. The dependence of the order parameter, S on applied strain for the hydrocarbon and siloxane components calculated from their respective wide-angle peaks is shown in Fig. 4(a). The value of S for siloxane evidently increases in the soft elastic region and saturates to a constant value of ∼0.4 at higher strains (region III). This shows that higher strains increasingly straighten the siloxane segments, rendering them parallel to the strain direction, and thus enhancing their orientational order.
At low strains, the domain-directors in as prepared samples remain randomly oriented and the measured values of S are nearly zero. In the middle region of the strain–stress graph, the domain-directors rotate towards the stretch direction resulting in an increase in measured orientational order parameter. The values of S saturate at ∼0.83 for the mesogens and at ∼0.4 for polymeric siloxane segments at strains ε ≥ 1.2, in part, due to the topological constraints of the polymer network1 and crosslink points which prevent a complete alignment. This “S-shaped” dependence of S on strain conforms to the expectations of a phenomenological logistic growth model,43
The chevron angle, α decreases rapidly from about 75° to ∼50° in the soft-elastic region then saturates to a minimum value (α = 50°) at higher strains, Fig. 4(b). This evidently shows that the rotation of the smectic domains as measured by α occurs at the soft elastic region and is coupled with the reorientation and realignment of the mesogenic component measured by S. The layer spacing, d, however in Fig. 4(b) does not show any systematic strain dependence at low strains. It decreases from ∼48 Å at ε = 0.7 to ∼41.5 Å at a high strain of ε = 3.0. The apparent strain dependence of d is only evident after the smectic domains attain the chevron structure.
Relaxation dynamics
The data collected immediately after each change in the applied strain provide valuable insight into the underlying relaxation process in LCEs. Azimuthal scans of the small angle peaks are fitted to a sum of two Gaussians (Fig. 3). The separation between them is a direct measure of the chevron angle α. The values of α and d are plotted in Fig. 5 as functions of equilibration time. It is clear that both parameters relax continuously at a constant strain, making a step jump with every increment of applied strain. The chevron angle gradually decreases with increasing strain and saturates at ∼50° in the monodomain state; d follows the same general trend as α beyond ε = 0.4.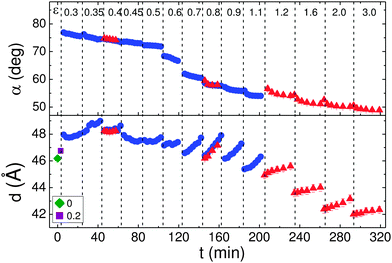 | ||
| Fig. 5 Relaxation of parameters α (top panel) and d (bottom panel) at each constant strain for samples S1 (blue circles) and S3 (red triangles). | ||
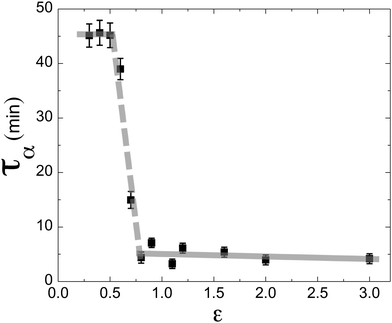
The time dependence of α at different strains shown in Fig. 6 reveals two different relaxation rates. A simple single-exponential decay describes the data very well with fewer adjustable parameters than the traditionally used15,37,44,45 stretch exponential function. The relaxation time changes from rather long times of 46 min in the elastic region (for ε ≤ 0.7) to much faster rates of ∼5 min in the plateau (soft elastic) and the third non-elastic irreversible regions (i.e., above ε ≥ 0.7), Fig. 7. This suggests that different relaxation processes are at play below and above ε ∼ 0.7. For ε between 0.5 and 0.8, the relaxation rates lie between the low and high values where the system apparently transitions from one relaxation regime to another. The slow relaxation of α at smaller strains could be attributed to the restricted rotation of the smectic domains imposed by the highly coiled polymer chains. At higher strains, the polymer chains uncoil rendering the liquid crystal elastomer less viscous therefore giving more freedom for the smectic domains to rotate.
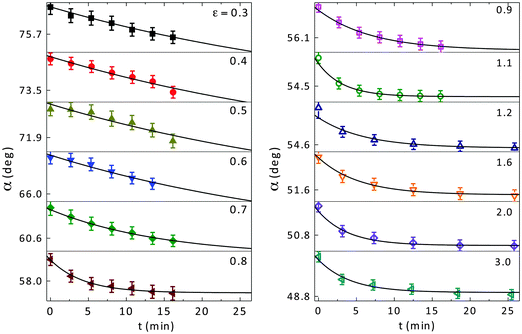 | ||
| Fig. 6 Relaxation of α for different strains. The solids lines are fits to a simple exponential function. | ||
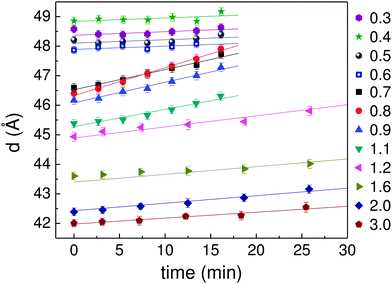
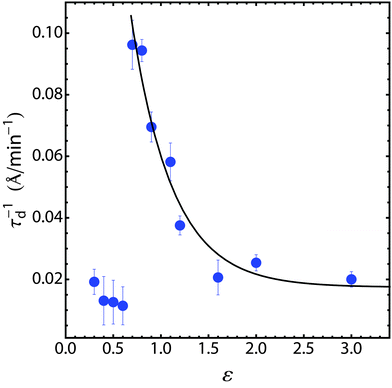
The smectic layer spacing decreases [Fig. 5] immediately upon the application of a higher (than ε = 0.45) strain but then relaxes typically to a higher value. Relaxation of the smectic layer spacing d is shown in Fig. 8. It relaxes nearly linearly with time. An estimate of the rate at which d relaxes at different strains also reveals that two different processes are at play below and above ε ∼ 0.7. The strain dependence of the relaxation rate, Fig. 9, shows that d relaxes sluggishly at strains below 0.7, at a rate of about 0.012 ± 0.001 Å min−1 which appears to be related to the LC component of the LCE that is most affected at the applied low strain. It then drastically rises to ∼0.10 Å min−1 for ε ≥ 0.7, i.e., above the onset of the plateau region where the formation of chevron microstructure commences and where the conformation of the elastomer is influenced by the strain. The relaxation rate gradually decreases to about 5 times smaller value as ε → 3.0. Based on the time dependence of α and d, one is led to conclude that, in both cases, elastic properties of the LC dominate in the linear region I. In region II and III, it is primarily the elastomeric properties that govern the behavior of this LCE.
One of the two previous studies36 revealed slow relaxation at low strains of a nematic side chain elastomer that became faster as the P–M region was approached. In the second case, the relaxation rate (∼1 min) of a smectic main chain elastomer37 was independent of the strain. These contrasting results are likely to arise from the difference in the type of studied elastomers. We further note that these studies measured the stress relaxation, which is related to the slippage of entanglements and loosening the network of molecular chains. Dynamic light scattering measurements38 of a nematic LC elastomer showed that the relaxation rate of the director fluctuations increased with strain due to increased nematic elastic constants. Our study measured the relaxations α and d at each strain and determined their dependence on strain.
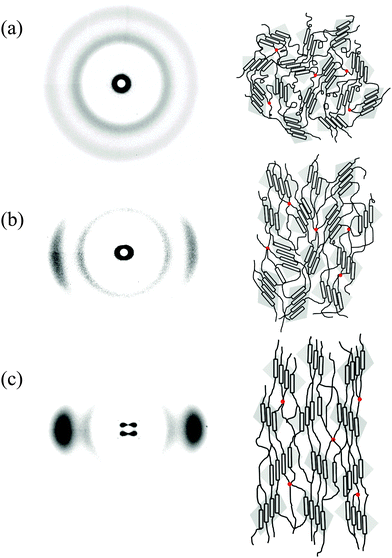
The experimentally measured evolution of chevron structure, orientational order in the hydrocarbon and siloxane parts of the elastomer, smectic layer spacing, and equilibration processes underlying the changes described above, can be explained in a semi-quantitative manner as follows. A freshly prepared sample is comprised of smectic microdomains in which mesogens organize themselves in layers. In the absence of any external force providing a preferred direction and the polymer network's tendency to acquire random conformation causes the orientation of the smectic layer normal and the director to vary randomly from one microdomain to another as schematically shown in Fig. 10(a). So, a strain-free virgin sample consists of smectic microdomains embedded inside a polymer network of random coils. X-ray diffraction patterns of such a powder sample are uniform rings as seen for ε = 0.
When the strain is applied, the sample stretches along the direction of stress and shrinks in the lateral directions to conserve volume. The lateral shrinkage causes distortions in the shape of LC microdomains as it attempts to elongate them in the (vertical) direction of the strain. However, this requires the smectic layers to rotate and the shrinkage in the lateral direction gives rise to shear27 flow. The flexibility of unstretched polymer segments15 initially allows the mesogens freedom to reposition and rotate about the chain axis. The relaxation time at low strains is dependent primarily on the liquid crystal properties, such as the elasticity and viscosity, and is found be approximately 45 ± 2.5 min as shown in Fig. 7. Consequently, the number of domains with vertical smectic layers increases, Fig. 10(b), and the small angle diffraction ring gradually transforms into two vertical arcs as observed for ε = 0.2, Fig. 2. These arc-reflections become increasingly bright and sharp as the alignment of smectic LC microdomains improves at higher strains approaching 0.7. In this regime, the effect of strain on d remains unremarkable.
As the strain ε → 0.5, the siloxane chains and mesogens become increasingly parallel to the stretch direction. Since the director in the SmC phase is tilted at angle α relative to the SmC layer normal with no azimuthal preference, the smectic layers develop a conical distribution about the vertical direction. In the plane perpendicular to the X-ray beam that is sampled in an X-ray experiment, the smectic layer distribution appears to be chevron-like, Fig. 10(c). The small angle peaks gradually develop a flattop in χ-scan for ε = 0.5. As the chevron structure become better defined at higher strains, two Gaussian functions are needed to properly fit the χ-scans, Fig. 3. The small angle arc reflection eventually split into a pair of peaks separated by angle 2α as sketched in Fig. 10(c) and experimentally observed for ε > 0.7. The system eventually becomes optically uniform (or, a monodomain) for light propagating along the strain direction. The polydomain to monodomain transitions in main-chain smectic elastomers were previously reported in an antiferroelectric SmCA,31 a main chain SmC,29 and a SmA LCE.46 Applied strains ε > 0.7 act directly on the siloxane spacers and segments in the polymer network. The initially highly coiled siloxane spacers now become taut and parallel to the stretch direction. In this region, the stress acts mainly on polymer chains. They respond and equilibrate differently than the LC component. Their response measured through the temporal changes in angle α is about 10 times faster than at low strains, Fig. 7. Additionally, the mesogens are oriented along the main chain causing the smectic layers to be well aligned. The second order smectic Bragg peak becomes visible, Fig. 2, suggesting a highly condensed smectic density wave within the smectic microdomains. At larger angles, the hydrocarbon and siloxane rings also transform into two pairs of arc-like peaks that lie on the equator, i.e., in a direction perpendicular to the strain direction.
Strain retention
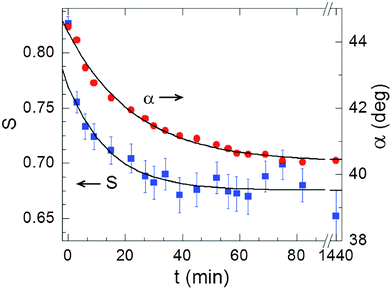
At high strains, C11MeHQ forms a monodomain chevron-like structure that retains its shape and the changes in its internal microscopic structure long after the strain has been removed because the energy related to smectic order dominates over the entropic elasticity of the polymer network. Previous studies14 indicate that a considerable strain (ε ≥ 2.0) is retained and the elastomer persists in this state for a very long time. It should be noted that strain retention for this film occurs at low temperatures (well below TI) which does not allow the full strain recovery that would/does occur at higher temperatures.To investigate strain retention in the present LCE, time evolution of its microscopic structure was monitored for the first 90 minutes after the removal of the strain followed by a final measurement after approximately 24 h. Fig. 11 shows plots of S and α versus time during this strain retention experiment. The second order small angle peak is present even after ∼24 hours. A near equilibrium state having α ∼ 40° and S = 0.68 ± 0.01 was reached after ∼90 min. While S decreases and retains a value of 0.65, α decreases from 45° to 40.4° in 24 h. The relaxation rates of S (14.6 ± 4 min) and α (22.6 ± 1.5 min) are found to be different. A long-term retention of the strain-induced changes clearly establishes the shape-memory retention capability of C11MeHQ. The deformed shape is believed to be stable47 due to the enthalpic trapping of the crosslinking points.
Shape recovery
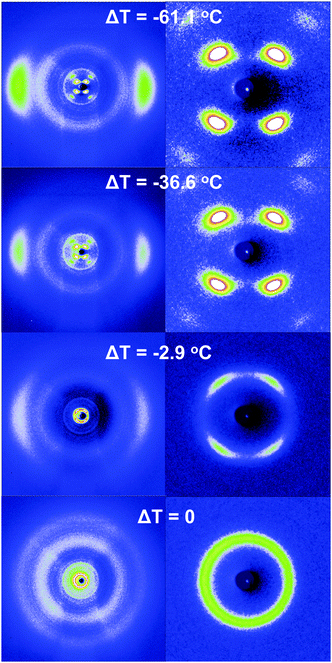
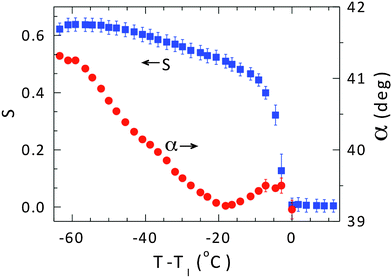
To investigate the shape-recovery, the sample is gradually heated from room temperature to beyond the clearing point, TI, to remove the enthalpic trapping. Fig. 12 shows the evolution of diffraction patterns at representative intermediate temperatures, here ΔT = T − TI. The patterns in the right hand column are expanded views of the small angle peaks. The large angle crescent shaped reflections at ∼4.5 Å (left column, Fig. 12) corresponding to the mesogens gradually become diffuse with increasing temperature to eventually become nearly uniform rings in the isotropic phase. The fact that second order smectic peaks disappear well below TI points to a weakening smectic density wave. The four primary small angle peaks (right column, Fig. 12) become increasingly diffuse and ultimately merge to form a uniform ring. The value of TI determined from X-ray data is ∼10 °C lower than the value measured by DSC14 perhaps because of the differences in two techniques and the rate of temperature changes.Thermal evolutions of S and α are plotted in Fig. 13. Both parameters generally decrease with increasing temperature. The change in S originate from the release of residual strain in the network which effectively frees up the chains that eventually recoils back to their original random conformation. The decrease in α is evidently related to the changes in chevron structure. As α approaches zero, the smectic layers become flat and oriented predominantly horizontally (i.e., perpendicular to the strain) as revealed by the merger of the two arc-like reflections along the vertical direction. This is opposite of what occurs in the initial stages of the application of strain. At temperatures in the proximity of TI, the distributions of polymer chains and the mesogens become increasingly random before the system completely returns to the polydomain state.
Summary
The results of this X-ray study reveal the microscopic structural changes that occur in the three distinct elastic regions of the main chain SmC liquid crystal elastomer C11MeHQSi8. Initially, as prepared samples have no preferred orientation of the director or equivalently the smectic layers, and the orientational order parameter S of the mesogens as well as elastomeric component are close to zero. As the applied strain exceeds 0.2, the smectic layers reorient and become parallel to the strain direction. The P–M transition ensues near ε ∼ 0.2 with the formation of chevron structure. The chevrons relax rather slowly with a time constant τα of approximately 45 min while S for the mesogenic and elastomeric components continue to gradually increase. The P–M transformation is nearly complete at ε = 0.7. The orientational order parameters for the mesogens and the elastomer saturate at 0.83 and 0.4, respectively, at ε = 1.7. Relaxation rates (τα) for the changes in the chevron angle and (τd) smectic layer spacing both become faster by an order of magnitude as the strain exceeds 0.7. The equilibration process appears to be dominated by the viscoelastic properties of the liquid crystal at low strains and of the elastomer at high strains. At strains higher than ∼1.0, parameters such as α, d, τα, and τd continue to systematically decrease with increasing strain.Upon the removal of the strain, the values of α and S relax by ∼10% and 20%, respectively. The elastomer remains “locked” into the monodomain state until an external stimulus, e.g. heat, is applied. During heating, the chevron structure decreases at about four times faster rate than the orientational order parameter of the mesogenic component.
Acknowledgements
The Basic Energy Sciences program of the Office of Science, US Department of Energy supported these X-ray investigations under grant DE-SC0001412. We (RW, PJM, and ACG) also wish to thank the National Textile Center for partial support of this work (M04-GT21). The authors wish to thank Dr Sonal Dey for his help with the experiment and data analysis. X-ray Science Division's beamline 6-ID-B at Sector 6 of the Advanced Photon Source of Argonne National Laboratory used in this study is supported by the Basic Energy Sciences program under Contract DE-AC02-06CH11357.References
- M. Warner and E. M. Terentjev, Liquid Crystal Elastomers, Oxford University Press Inc., New York, NY, USA, 2007 Search PubMed.
- S. Kumar, Liquid crystals: Experimental Study of Physical Properties and Phase Transitions, Cambridge University Press, Cambridge, New York, 2001 Search PubMed.
- L. R. G. Treloar, The Physics of Rubber Elasticity, Oxford University Press Inc., New York, NY, USA, 2005 Search PubMed.
- H. Finkelmann, H. J. Kock and G. Rehage, Makromol. Chem., Rapid Commun., 1981, 2, 317 CrossRef CAS.
- H. Finkelmann, A. Greve and M. Warner, Eur. Phys. J. E: Soft Matter Biol. Phys., 2001, 5, 281 CrossRef CAS.
- A. R. Tajbakhsh and E. M. Terentjev, Eur. Phys. J. E: Soft Matter Biol. Phys., 2001, 6, 181 CrossRef CAS.
- G. C. Verwey and M. Warner, Macromolecules, 1995, 28, 4303 CrossRef CAS.
- S. M. Clarke, A. R. Tajbakhsh, E. M. Terentjev, C. Remillat, G. R. Tomlinson and J. R. House, J. Appl. Phys., 2001, 89, 6530 CrossRef CAS PubMed.
- J. M. Adams and M. Warner, Phys. Rev. E: Stat., Nonlinear, Soft Matter Phys., 2005, 72, 011703 CrossRef CAS.
- J. Adams, S. Conti and A. DeSimone, Continuum Mech. Thermodyn., 2007, 18, 319 CrossRef PubMed.
- A. W. Brown and J. M. Adams, Phys. Rev. E: Stat., Nonlinear, Soft Matter Phys., 2012, 85, 011703 CrossRef CAS.
- S. Dey, D. Agra-Kooijman, W. Ren, P. McMullan, A. Griffin and S. Kumar, Crystals, 2013, 3, 363 CrossRef CAS PubMed.
- I. A. Rousseau and P. T. Mather, J. Am. Chem. Soc., 2003, 125, 15300 CrossRef CAS PubMed.
- W. Ren and A. C. Griffin, Phys. Status Solidi B, 2012, 249, 1379 CrossRef CAS.
- W. Ren, PhD thesis, Georgia Institute of Technology, GA, USA, 2007.
- W. T. Ren, P. J. McMullan and A. C. Griffin, Phys. Status Solidi B, 2009, 246, 2124 CrossRef CAS.
- N. R. Barnes, F. J. Davis and G. R. Mitchell, Mol. Cryst. Liq. Cryst., 1989, 168, 13 CrossRef CAS; F. J. Davis, A. Gilbert, J. Mann and G. R. Mitchell, J. Polym. Sci., Part A: Polym. Chem., 1990, 28, 1455 CrossRef; J. Schätzle, W. Kaufhold and H. Finkelmann, Makromol. Chem., 1989, 190, 3269 CrossRef; A. Shiota and C. Ober, J. Polym. Sci., Part B: Polym. Phys., 1998, 36, 31 CrossRef.
- J. Kupfer and H. Finkelmann, Macromol. Chem. Phys., 1994, 195, 1353 CrossRef.
- S. Clarke, E. Terentjev, I. Kundler and H. Finkelmann, Macromolecules, 1998, 31, 4862 CrossRef CAS PubMed.
- A. Hotta and E. M. Terentjev, J. Phys.: Condens. Matter, 2001, 13, 11453 CrossRef CAS.
- K. Urayama, E. Kohmon, M. Kojima and T. Takigawa, Macromolecules, 2009, 42, 4084 CrossRef CAS.
- P. Heinze and H. Finkelmann, Macromolecules, 2010, 43, 6655 CrossRef CAS.
- M. Warner, P. Bladon and E. M. Terentjev, J. Phys. II, 1994, 4, 93 CrossRef CAS.
- P. D. Olmsted, J. Phys. II, 1994, 4, 2215 CrossRef CAS.
- S. V. Fridrikh and E. M. Terentjev, Phys. Rev. E: Stat. Phys., Plasmas, Fluids, Relat. Interdiscip. Top., 1999, 60, 1847 CrossRef CAS.
- J. S. Biggins, M. Warner and K. Bhattacharya, J. Mech. Phys. Solids, 2012, 60, 573 CrossRef CAS PubMed.
- J. S. Biggins, M. Warner and K. Bhattacharya, Phys. Rev. Lett., 2009, 103, 037802 CrossRef CAS.
- K. Hiraoka and H. Finkelmann, Macromol. Rapid Commun., 2001, 22, 456 CrossRef CAS.
- A. Sanchez-Ferrer and H. Finkelmann, Macromolecules, 2008, 41, 970 CrossRef CAS.
- A. Sanchez-Ferrer and H. Finkelmann, Solid State Sci., 2010, 12, 1849 CrossRef CAS PubMed.
- R. Ishige, K. Osada, H. Tagawa, H. Niwano, M. Tokita and J. Watanabe, Macromolecules, 2008, 41, 7566 CrossRef CAS; K. Osada, H. Niwano, M. Tokita, S. Kawauchi and J. Watanabe, Macromolecules, 2000, 33, 7420 CrossRef.
- I. Kundler and H. Finkelmann, Macromol. Chem. Phys., 1998, 199, 677 CrossRef CAS.
- S. Conti, A. DeSimone and G. Dolzmann, J. Mech. Phys. Solids, 2002, 50, 1431 CrossRef CAS.
- M. De Luca, A. DeSimone, A. Petelin and M. Copic, J. Mech. Phys. Solids, 2013, 61, 2161 CrossRef CAS PubMed.
- J. K. Whitmer, T. F. Roberts, R. Shekhar, N. L. Abbott and J. J. de Pablo, Phys. Rev. E: Stat., Nonlinear, Soft Matter Phys., 2013, 87, 020502 CrossRef.
- S. M. Clarke and E. M. Terentjev, Phys. Rev. Lett., 1998, 81, 4436 ( Faraday Discuss. , 1999 , 112 , 325 ) CrossRef CAS.
- C. Ortiz, C. Ober and E. J. Kramer, Polymer, 1998, 39, 3713 CrossRef CAS.
- A. Petelin and M. Copic, Phys. Rev. E: Stat., Nonlinear, Soft Matter Phys., 2010, 82, 011703 CrossRef.
- N. Uchida, Phys. Rev. E: Stat. Phys., Plasmas, Fluids, Relat. Interdiscip. Top., 2000, 62, 5119 CrossRef CAS.
- W. Ren, P. J. McMullan and A. C. Griffin, Macromol. Chem. Phys., 2008, 209, 1896 CrossRef CAS.
- A. P. Hammersley, S. O. Svensson, M. Hanfland, A. N. Fitch and D. Hausermann, High Pressure Res., 1996, 14, 235 CrossRef.
- P. Davidson, D. Petermann and A. M. Levelut, J. Phys. II, 1995, 5, 113 CrossRef CAS.
- A. Tsoularis and J. Wallace, Math. Biosci., 2002, 179, 21 CrossRef CAS.
- A. Hotta, S. M. Clarke and E. M. Terentjev, Macromolecules, 2002, 35, 271 CrossRef CAS.
- P. Falus, M. A. Borthwick, S. Narayanan and A. R. Sandy, Phys. Rev. Lett., 2006, 97, 066102 CrossRef CAS.
- C. Ortiz, M. Wagner, N. Bhargava, C. K. Ober and E. J. Kramer, Macromolecules, 1998, 31, 8531 CrossRef CAS.
- W. Ren, W. M. Kline, P. J. McMullan and A. C. Griffin, Phys. Status Solidi B, 2011, 248, 105 CrossRef CAS.
| This journal is © the Owner Societies 2015 |

